Wishing you all a merry Christmas and a happy, healthy start to 2026.
After the holiday break (and the typically thin, choppy trading around year-end), this is our first market breadth update of the new year—based on the latest post-close data (Jan 2, 2026).
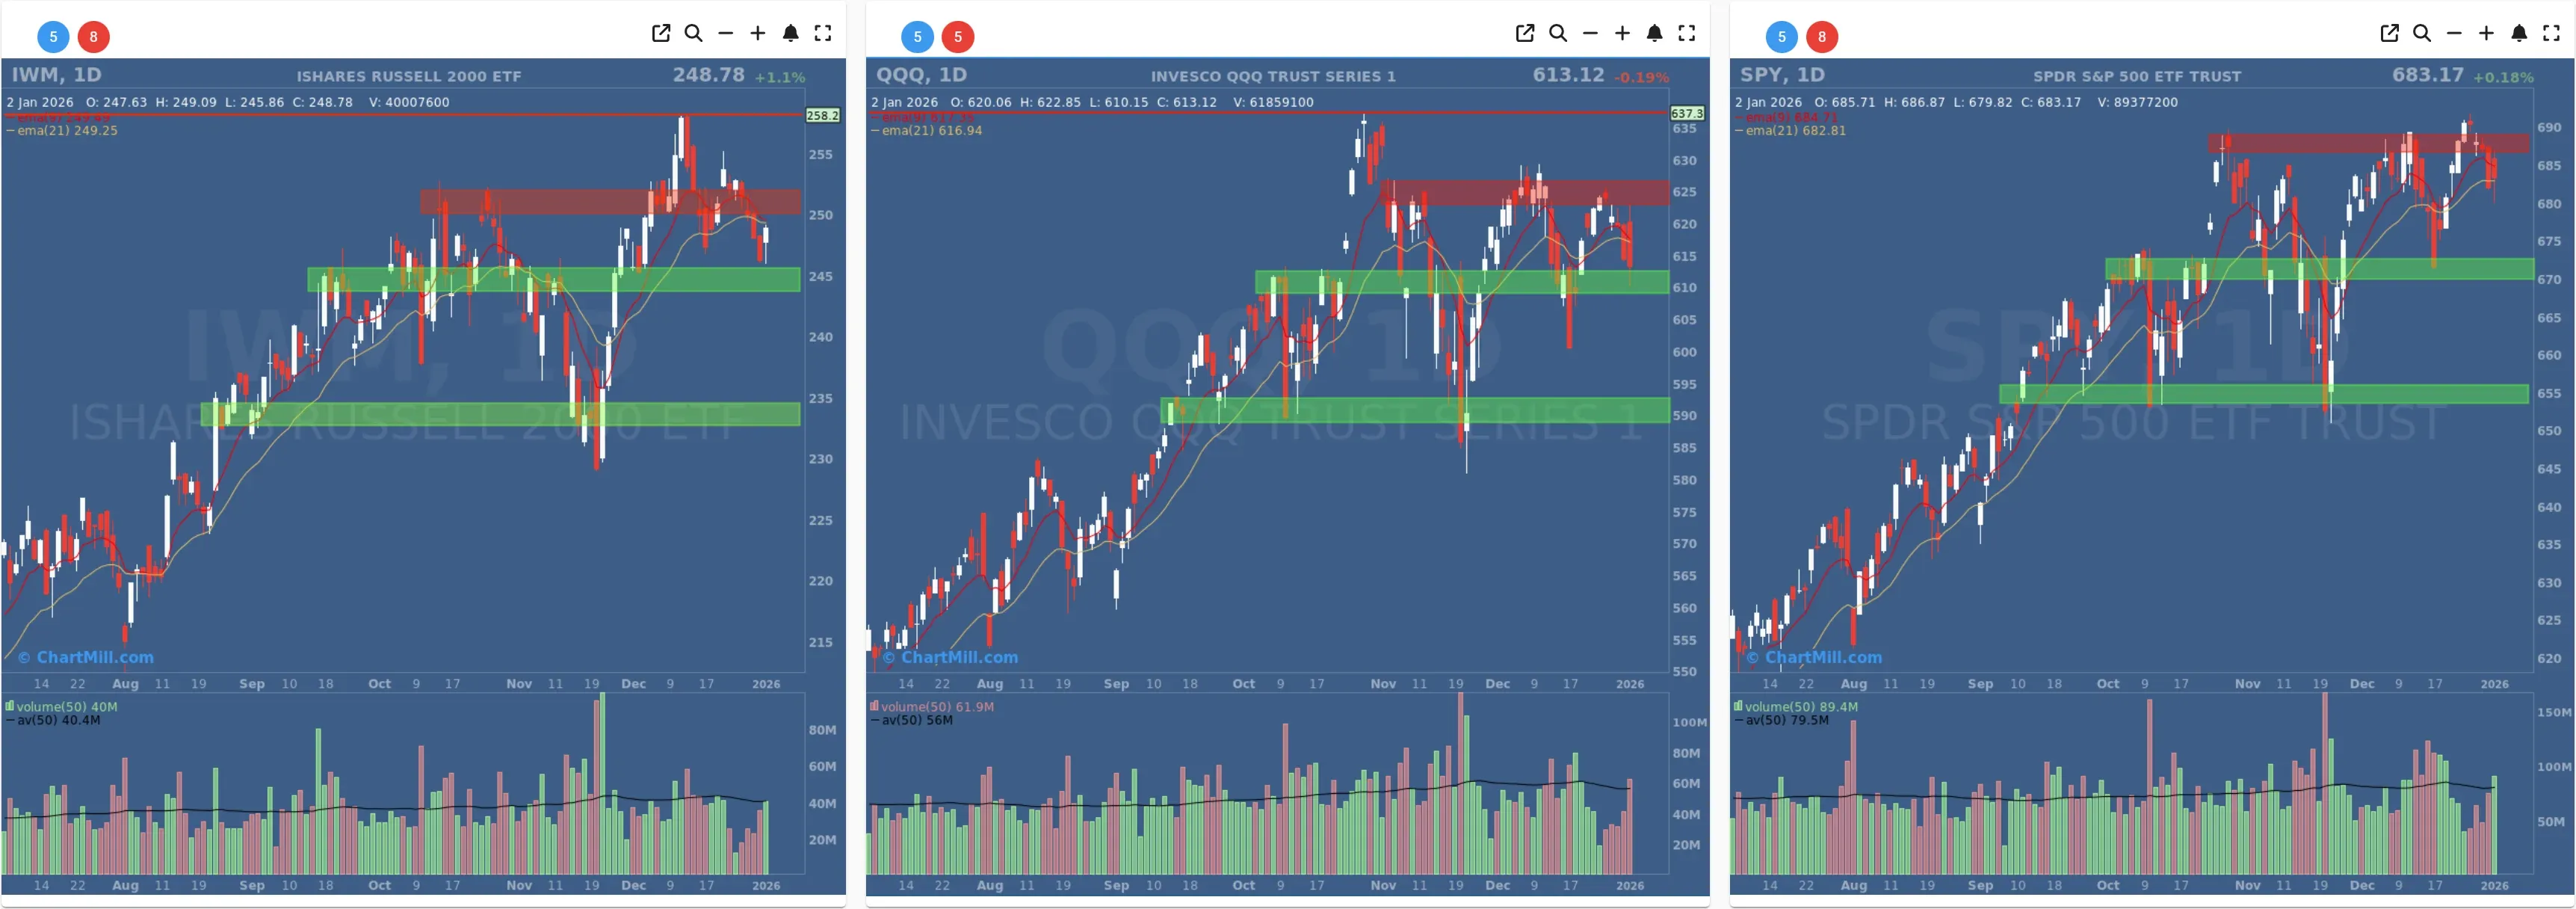
Index overview (SPY, QQQ, IWM)
Short Term (Daily)
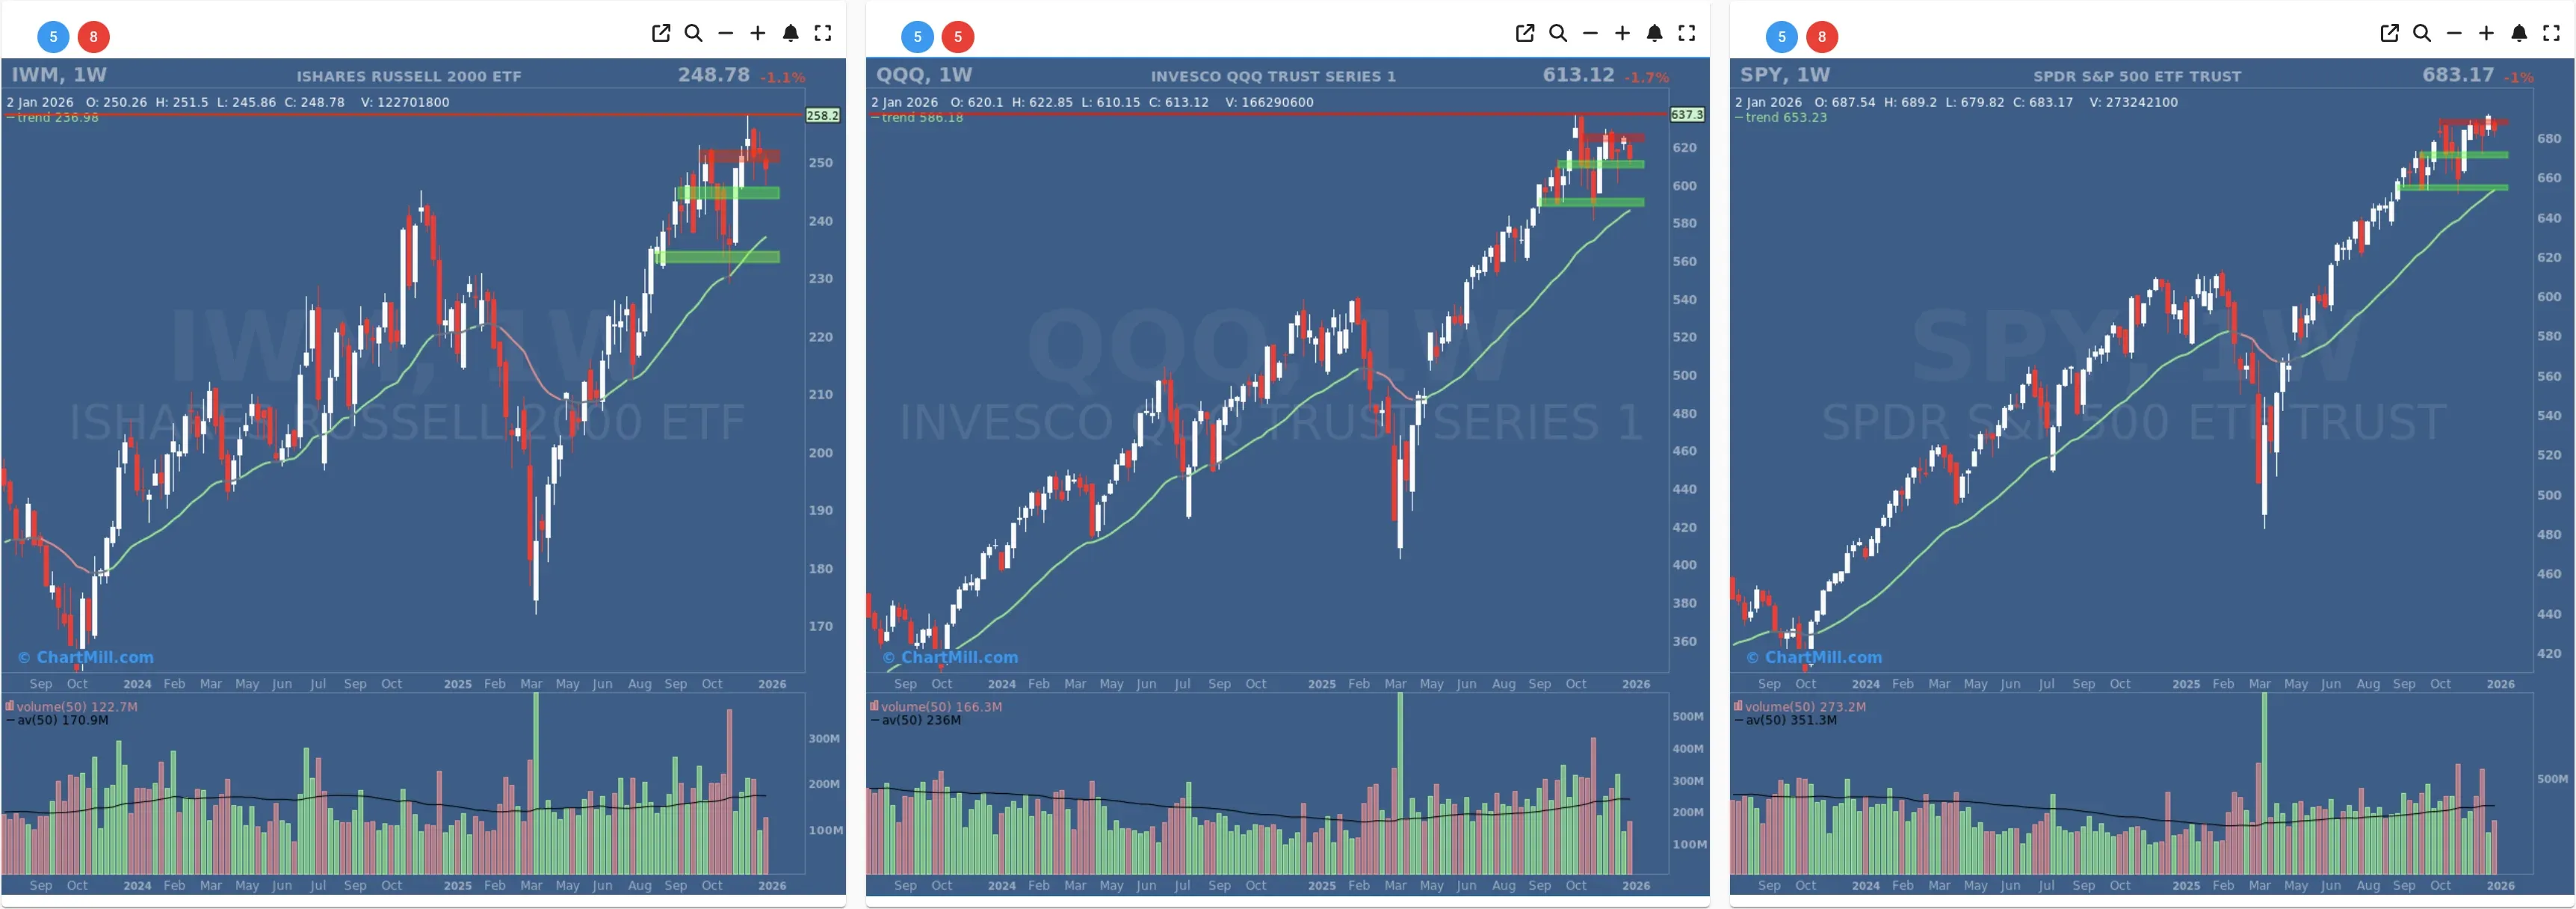
Long Term (Weekly)
SPY
Daily: SPY is still acting like the “steady hand” of the trio. Price closed ~683, sitting just above the EMA21 (~682.8) after some recent back-and-forth. That’s constructive: the market is wobbling, but large caps are not breaking down.
Key levels: Resistance remains near the upper red supply zone (~686–690). Support is clearly defined by the green zones (~675 area first, then ~655).
Weekly: The long-term picture stays positive (trend indicator green). This looks more like consolidation near highs than a structural breakdown.
Takeaway: SPY is holding up well, but it’s also telling us the rally is getting “selective” (index resilience while breadth underneath softens).
QQQ
Daily: QQQ is the weak spot short-term. It closed ~613 and is below the EMA21 (~616.9), a subtle but important loss of short-term trend support.
Key levels: The most important near-term floor is the green demand zone around ~610. If that area doesn’t hold, the next broader support sits much lower (near the next green zone). On the upside, QQQ needs to reclaim the ~617 area (EMA21) and then push back into the ~620–625 supply zone to restore momentum.
Weekly: Despite the daily softness, the bigger trend is still up (green weekly trend indicator) and price remains well above the rising long-term average—so this currently reads as a pullback/consolidation within an uptrend, not an outright trend reversal.
Takeaway: QQQ is the “tell” right now, breadth will have a hard time improving sustainably if QQQ can’t regain its short-term trend levels.
IWM
Daily: IWM had a better day, closing ~248.8 (+~1.1%), but it’s still slightly below the EMA21 (~249.3). That’s consistent with a market that bounced, but hasn’t fully repaired.
Key levels: Overhead supply sits near ~250–252 (the red zone), while support is layered at the ~245 area and then a deeper green zone below.
Weekly: Like the others, the weekly trend indicator remains green, with the long-term average rising, still a bullish structural backdrop.
Takeaway: Small caps are trying to re-stabilize, but they haven’t convincingly reclaimed the short-term trend yet.
Breadth snapshot (what changed since the last update on Dec 23)
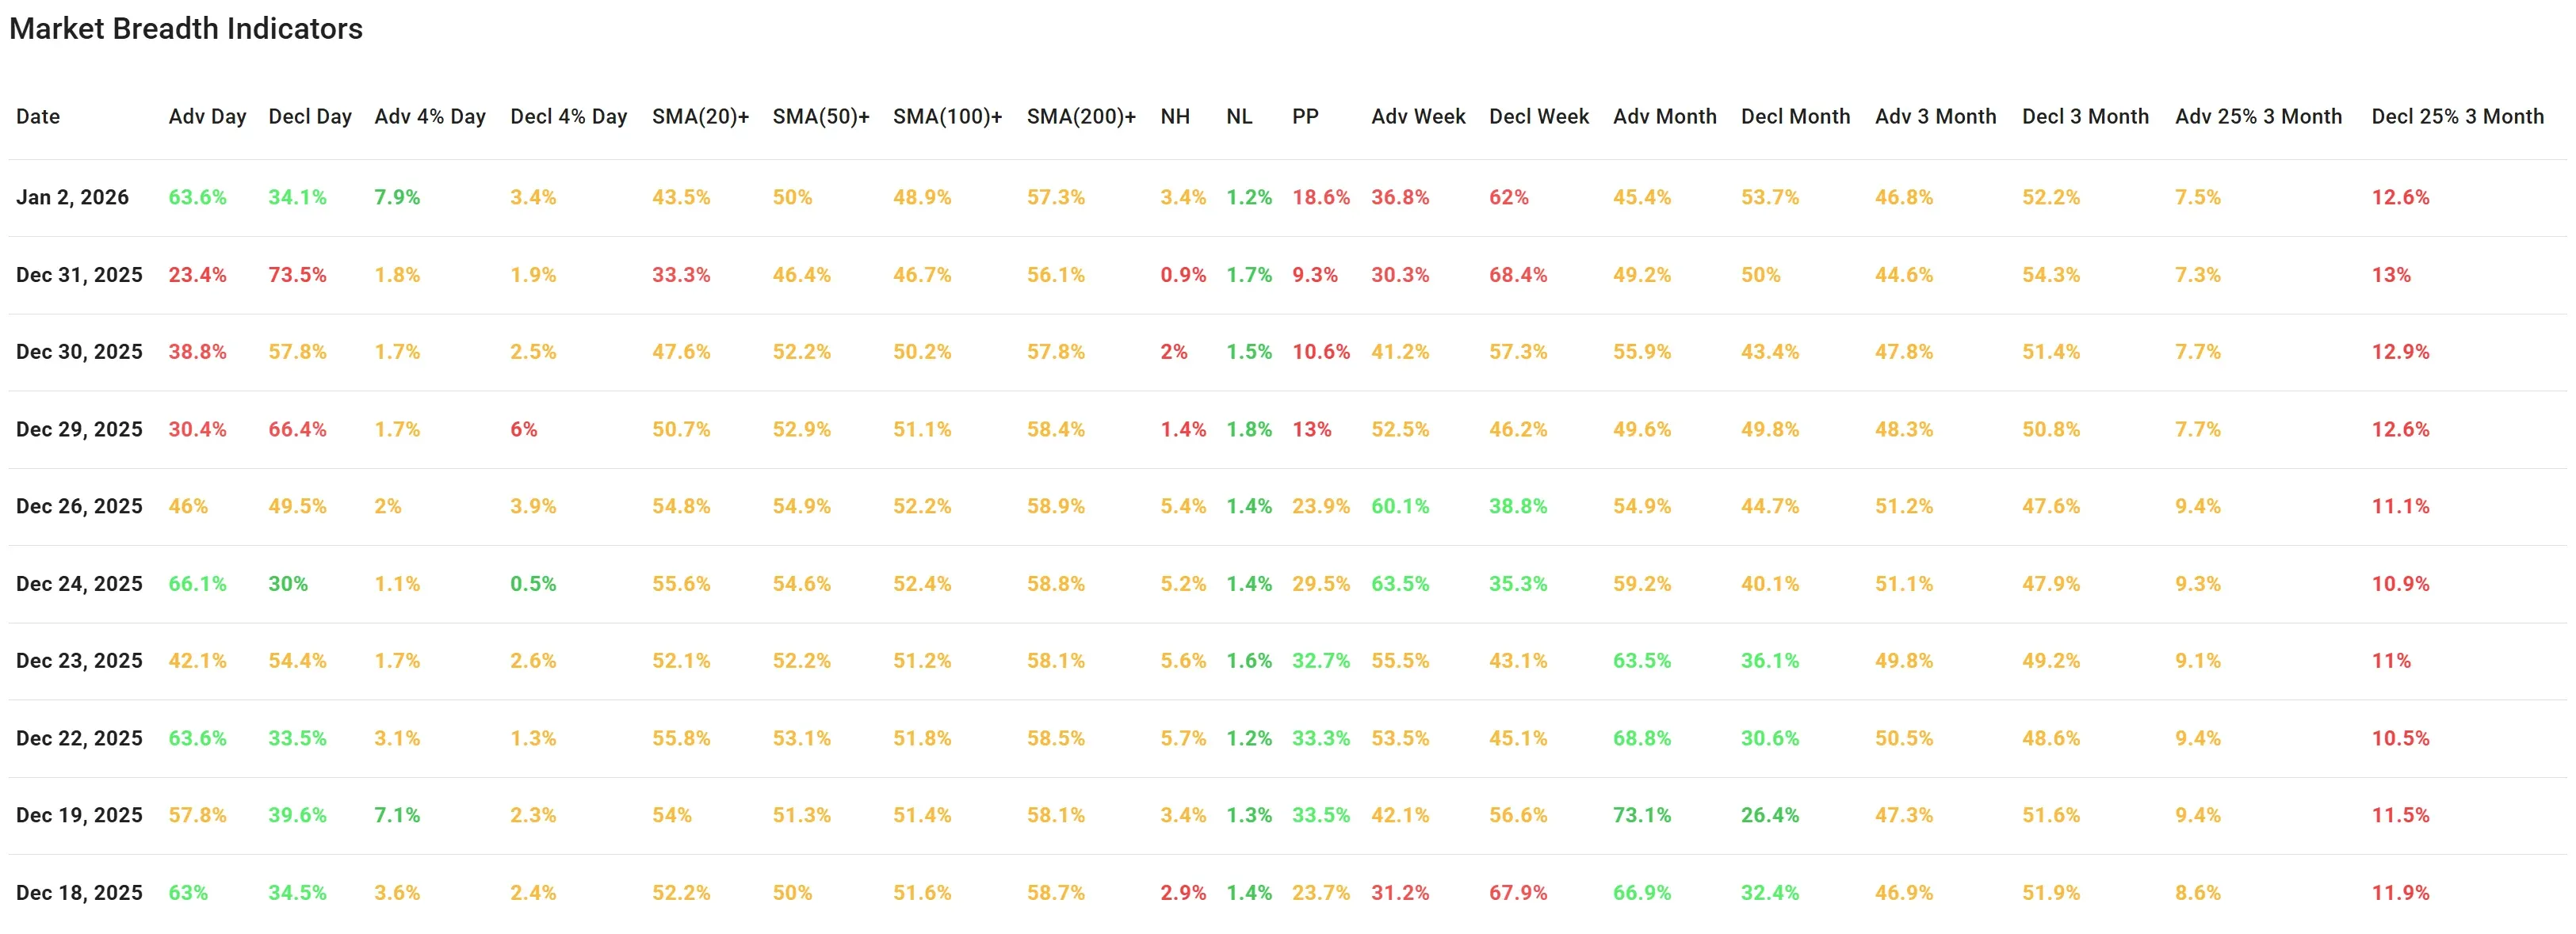
Friday was a broad rebound day, that’s the good news...
-
Advancers: 63.6% vs Decliners 34.1%
-
Big movers: 7.9% gained more than +4%, versus 3.4% down more than -4%
This is the type of session you want to see after a rough or sloppy stretch: participation improves, and upside “power” beats downside “damage.”
But the short-term participation trend has clearly weakened into year-end
Compared with Dec 23, the “how many stocks are above key averages” metrics cooled:
-
SMA(20)+: 43.5% (down from 52.1% on Dec 23)
-
SMA(50)+: 50.0% (down from 52.2%)
-
SMA(100)+: 48.9% (down from 51.2%)
-
SMA(200)+: 57.3% (roughly stable vs 58.1%)
This is a classic pattern when markets churn: the long-term foundation stays intact, but short-term breadth erodes, making rallies harder to sustain without a clean “re-expansion” phase.
The weekly breadth backdrop is still negative
-
Adv Week: 36.8%
-
Decl Week: 62.0%
So while today improved, the last 5 sessions still lean bearish in participation. One strong day helps, but it usually takes a few follow-through sessions to flip this.
The monthly and 3-month picture cooled (quiet warning sign)
-
Adv Month 45.4% vs Decl Month 53.7% (a clear deterioration vs Dec 23, when Adv Month was strongly ahead)
-
Adv 3 Month 46.8% vs Decl 3 Month 52.2%
-
Adv 25% (3M): 7.5% vs Decl 25% (3M): 12.6%
That last line matters: there are still more stocks in deep drawdowns than stocks with big sustained gains. That doesn’t mean “bear market,” but it does mean the market is not broadly healthy under the surface yet.
New highs still beat new lows - long-term trend remains supported
-
New Highs: 3.4%
-
New Lows: 1.2%
This aligns with the weekly charts: the big trend is still up. But highs are lower than late December, suggesting fewer fresh breakouts (another sign of cooling participation).
Bottom line
The first breadth read of 2026 starts with a constructive rebound day, but the broader picture is still one of short-term damage control after a weaker holiday stretch (thin liquidity often amplifies swings and can distort short-window breadth).
Bullish evidence: weekly trends remain green; SPY is holding near highs; new highs still exceed new lows.
Caution evidence: fewer stocks are above their short-term averages; weekly breadth still leans bearish; QQQ remains the soft spot and is below EMA21 (The same applies to IWM).
What would improve the message quickly? A follow-through push where SMA(20)+ climbs back toward/above 50%, and QQQ reclaims EMA21 and the ~620–625 zone. Without that, the most likely path is continued sideways consolidation with pockets of leadership rather than a clean, broad-based advance.
Breadth trend rating
Neutral (positive bias)

Long-term uptrends remain intact, and today’s rebound is encouraging, but short-term breadth still needs repair before we can call the environment outright “positive” again.
Kristoff
Next to read: Chips Save the Open — Tesla Trips Out of the Gate