
(All data & visualisations by ChartMill.com)
Daily Market Trend Analysis – August 5, 2025 (After Market Close)
Minor losses for QQQ and SPY, IWM rose +0.50%
Short Term Trend
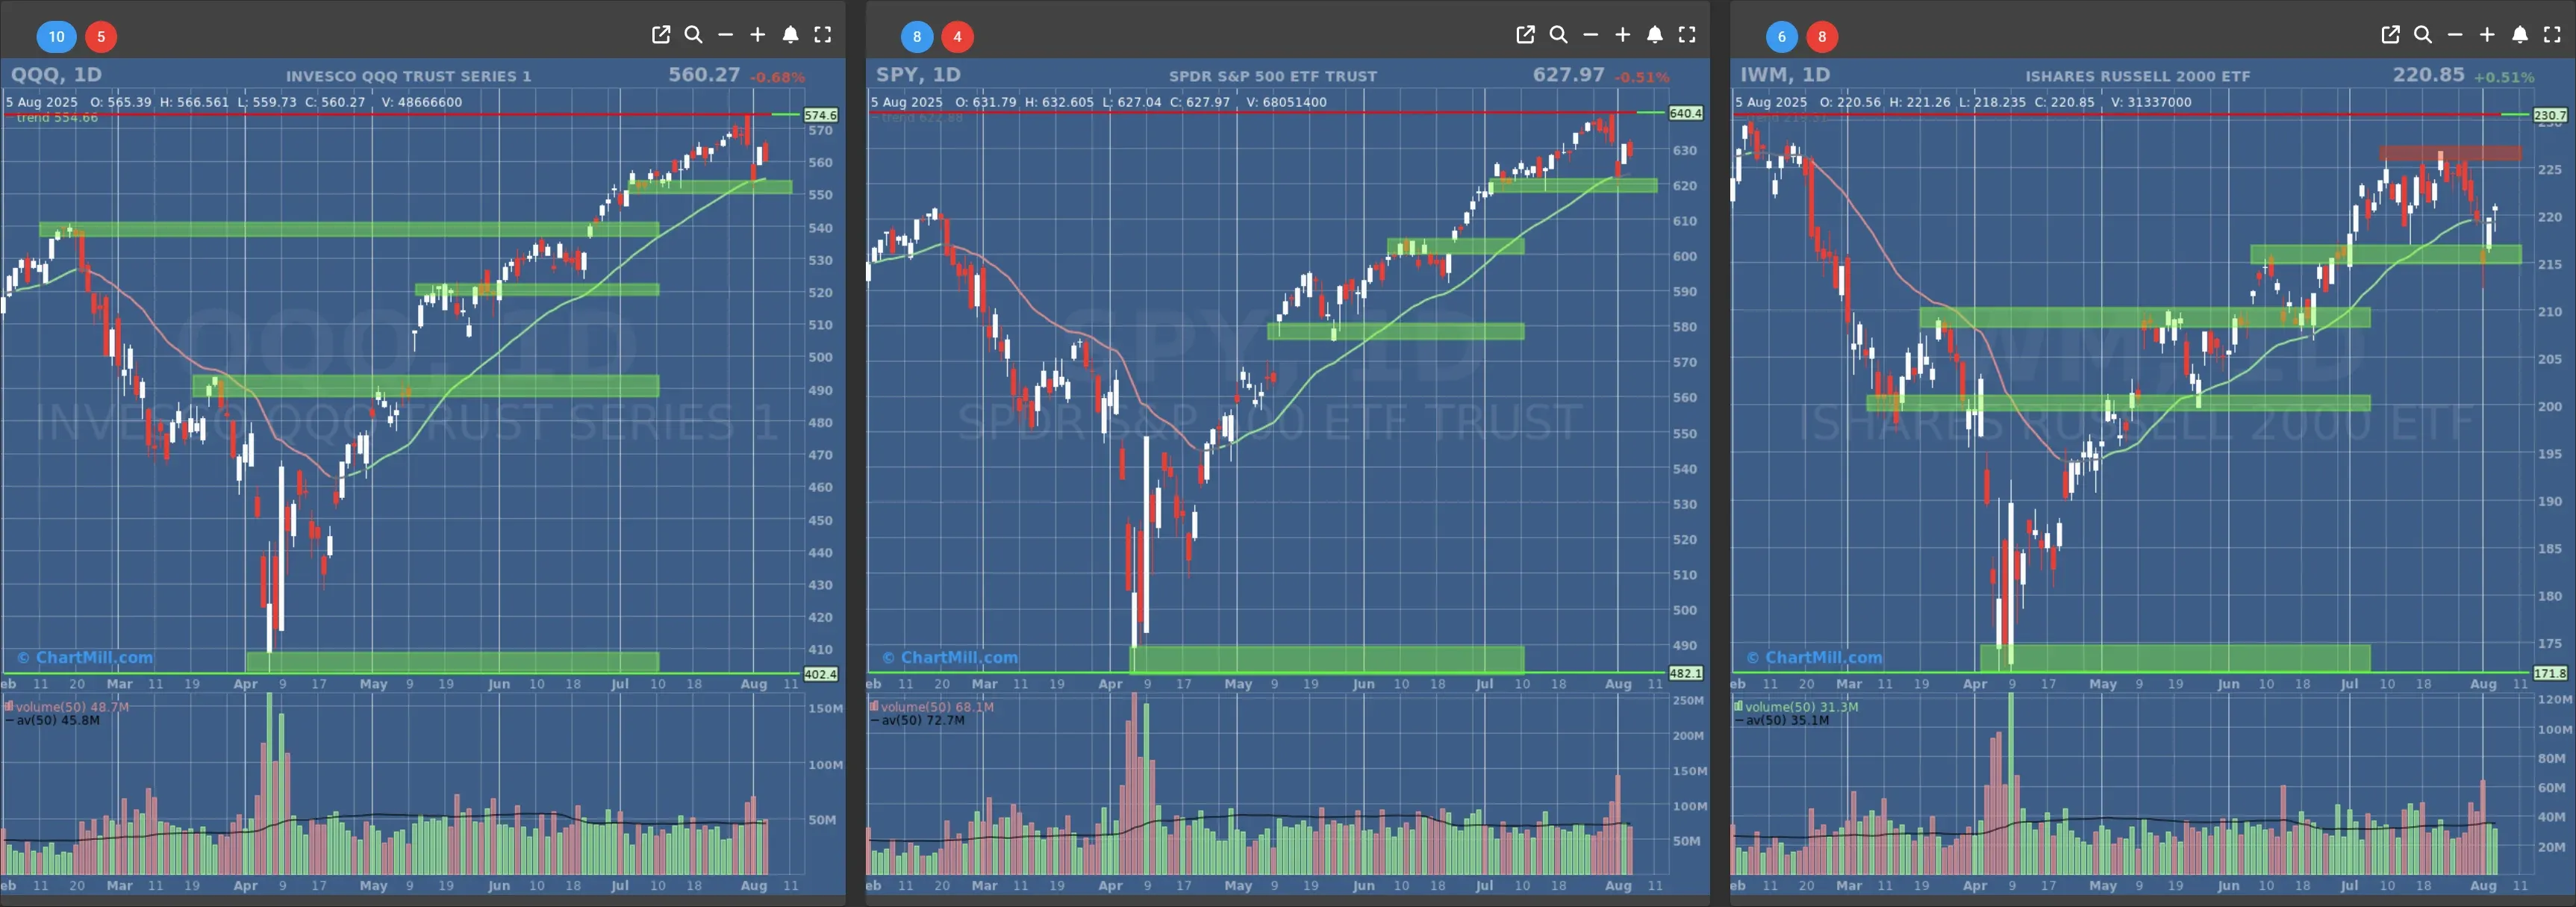
- Short-Term Trend: Neutral (no change)
- Next Support at $620 - $600
- Next Resistance at $640
- Volume: At Average (50)
- Pattern: Down Day
- Short-Term Trend: Bullish (no change)
- Next Support at $550 - $540
- Next Resistance at $575
- Volume: At Average (50)
- Pattern: Down Day
- Short-Term Trend: Neutral (no change)
- Next Support at $220 - $215
- Next Resistance at $226
- Volume: At Average (50)
- Pattern: Up Day - Hanging Man Candle
Long Term Trend

- Long-Term Trend: Positive (no change)
- Long-Term Trend: Positive (no change)
- Long-Term Trend: Positive (no change)
Daily Market Breadth Analysis – August 5, 2025 (After Market Close)
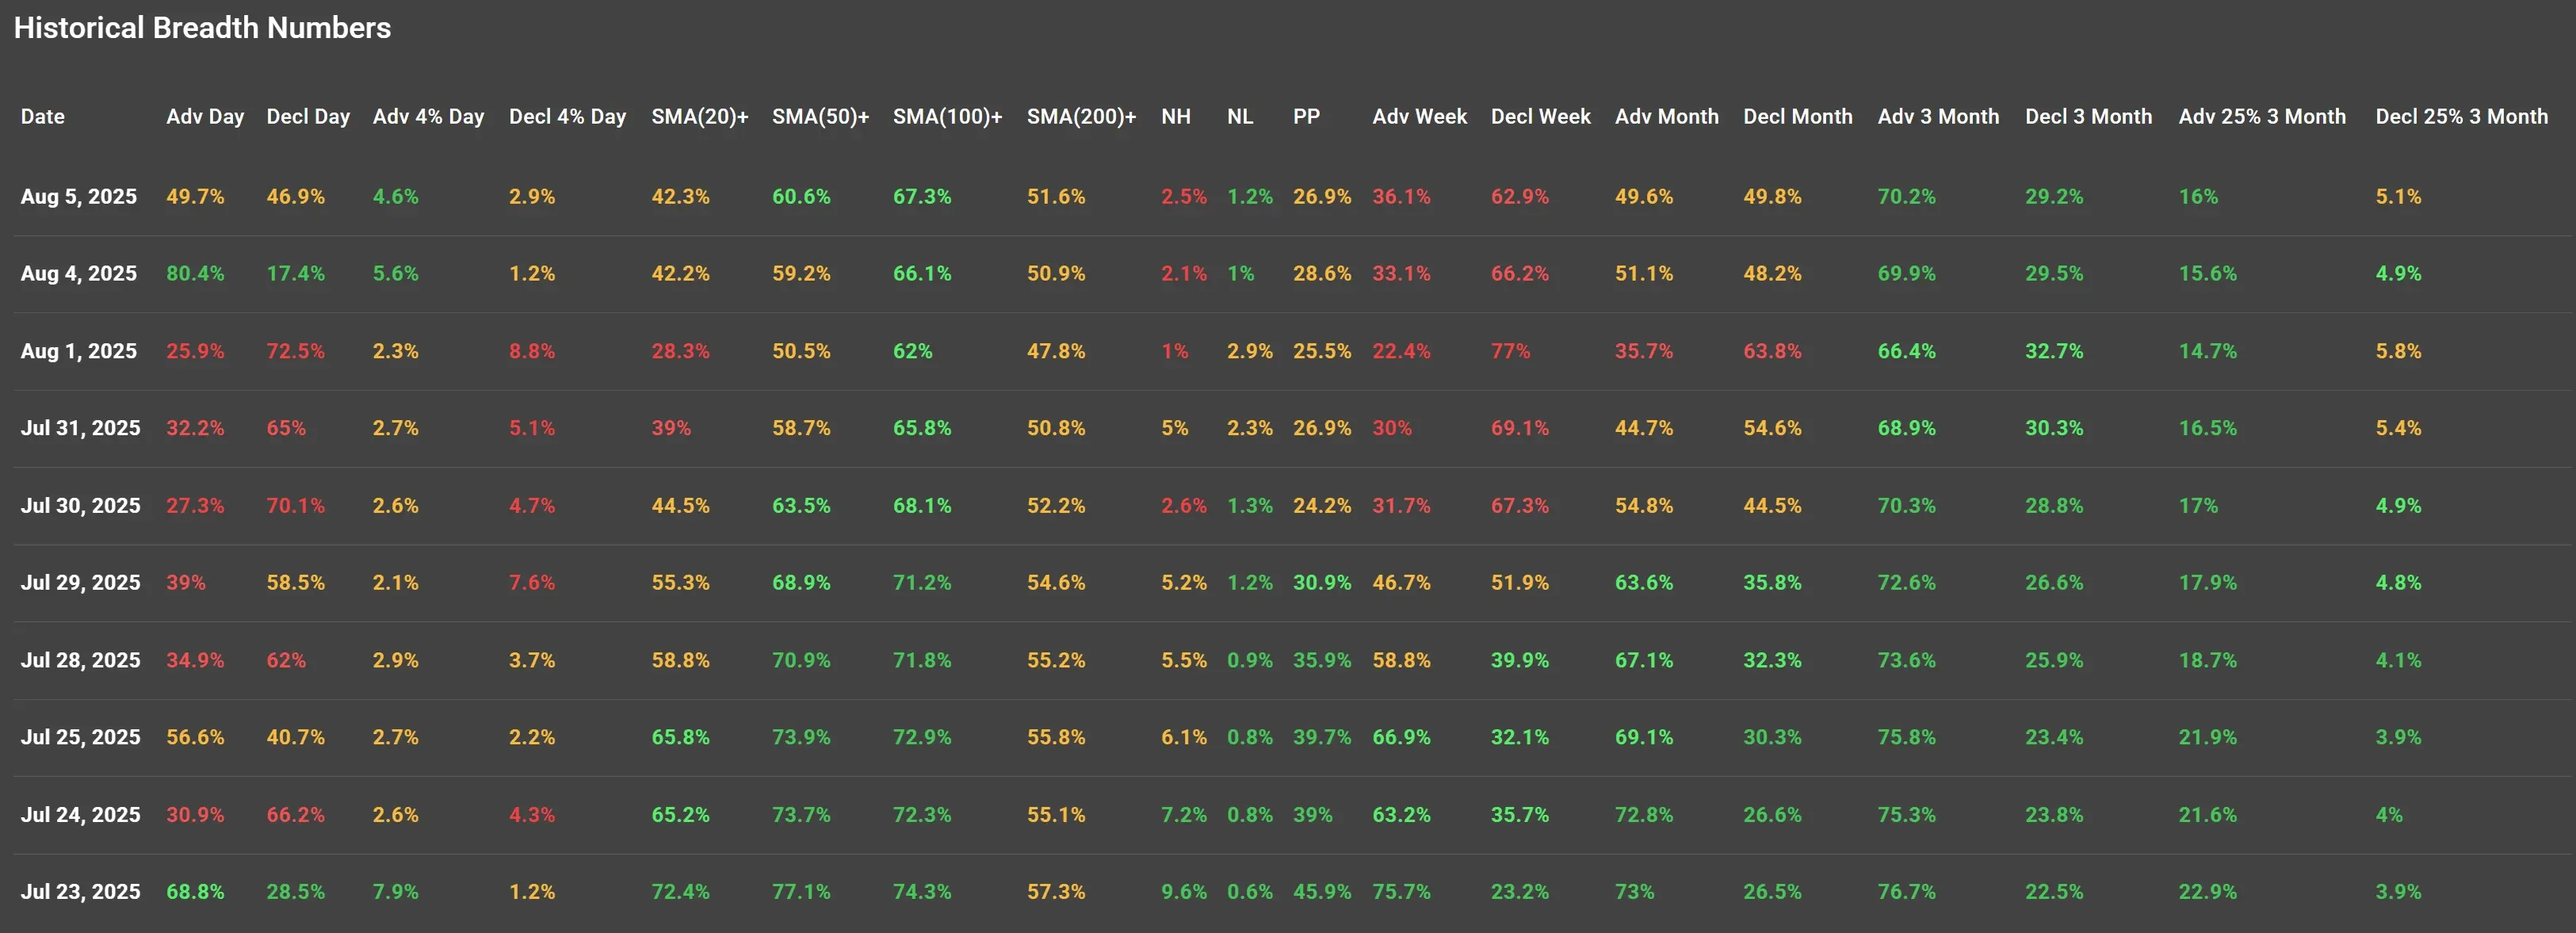
Following an impressive risk-on session on Monday, August 4, where a broad majority of stocks advanced (80.4%) and upside momentum surged, Tuesday’s session (August 5) showed a cooling off, with advancing stocks falling back to 49.7%. However, this wasn’t a broad sell-off, it looked more like a pause after a strong move.
Key Observations:
1. Advancers vs. Decliners
-
Advancers: 49.7% | Decliners: 46.9%
-
Advancers >4%: 4.6% | Decliners >4%: 2.9%
Compared to Monday, where 80.4% of stocks were up, this was a clear drop in participation. But rather than a reversal, this reads more like consolidation. The percentage of stocks making strong moves >4% dipped slightly, but no extreme downside moves appeared either.
2. Moving Average Participation
-
SMA(20)+: 42.3% (flat vs. Monday)
-
SMA(50)+: 60.6%
-
SMA(100)+: 67.3%
-
SMA(200)+: 51.6%
These metrics remained largely unchanged from Monday and still support a constructive medium-term trend. Over half of all stocks remain above their 200-day average—a key longer-term bullish sign.
3. New Highs vs. New Lows
- New Highs: 2.5% | New Lows: 1.2%
New highs ticked up slightly again, continuing a trend from Monday. New lows stayed low, reinforcing the idea that downside pressure is not expanding.
4. Short-Term Breadth
-
Pivot Points (PP): 26.9% (vs. 28.6% on Monday)
-
Advancing on the Week: 36.1%
-
Declining on the Week: 62.9%
The weekly trend remains negative, despite Monday’s burst of strength. That said, Tuesday’s numbers didn’t worsen the weekly breadth, they merely confirmed that we’re still in recovery mode.
5. Medium- to Long-Term Breadth
-
- 1-Month Advancers: 49.6% | Decliners: 49.8% → Neutral
-
3-Month Advancers: 70.2% | Decliners: 29.2%
-
Advancers >25% (3 Months): 16%
These figures confirm strong underlying strength over the longer term, with around 70% of stocks higher over the past 3 months and a rising number gaining >25%. The short-term chop is not damaging that structure—for now.
Comparison to August 4, 2025 (Monday):
Monday delivered one of the strongest single-day breadth readings in weeks, and the follow-up action on Tuesday did not erase those gains.
While momentum cooled, participation held up relatively well. This validates what we observed yesterday: breadth had turned sharply positive, but needed confirmation. Tuesday’s pause is neither bullish nor bearish on its own, but does not invalidate Monday’s strength.
Breadth Trend Rating: 3 – Neutral
While Monday’s surge lifted breadth to bullish territory, Tuesday’s session pulled participation back to a more neutral footing. However, the lack of deterioration in longer-term metrics and the resilience above key moving averages suggests that the bulls are still in control, but not in a dominant position.
Momentum is building, but not yet convincing.

Kristoff - ChartMill
Next to read: Market Monitor News, August 6