
(All data & visualisations by ChartMill.com)
Daily Market Trend Analysis – May 21, 2025 (After Market Close)
All three major ETFs QQQ, SPY, and IWM) show short-term weakness. On the daily charts, each ETF pulled back from key supply levels with elevated volume, confirming the breadth deterioration seen earlier.
On the weekly charts, the uptrend is intact, but this week’s rejection at resistance (especially in IWM) suggests potential stalling momentum. The broader market remains vulnerable if follow-through selling continues and key support zones are tested.
Short Term Trend
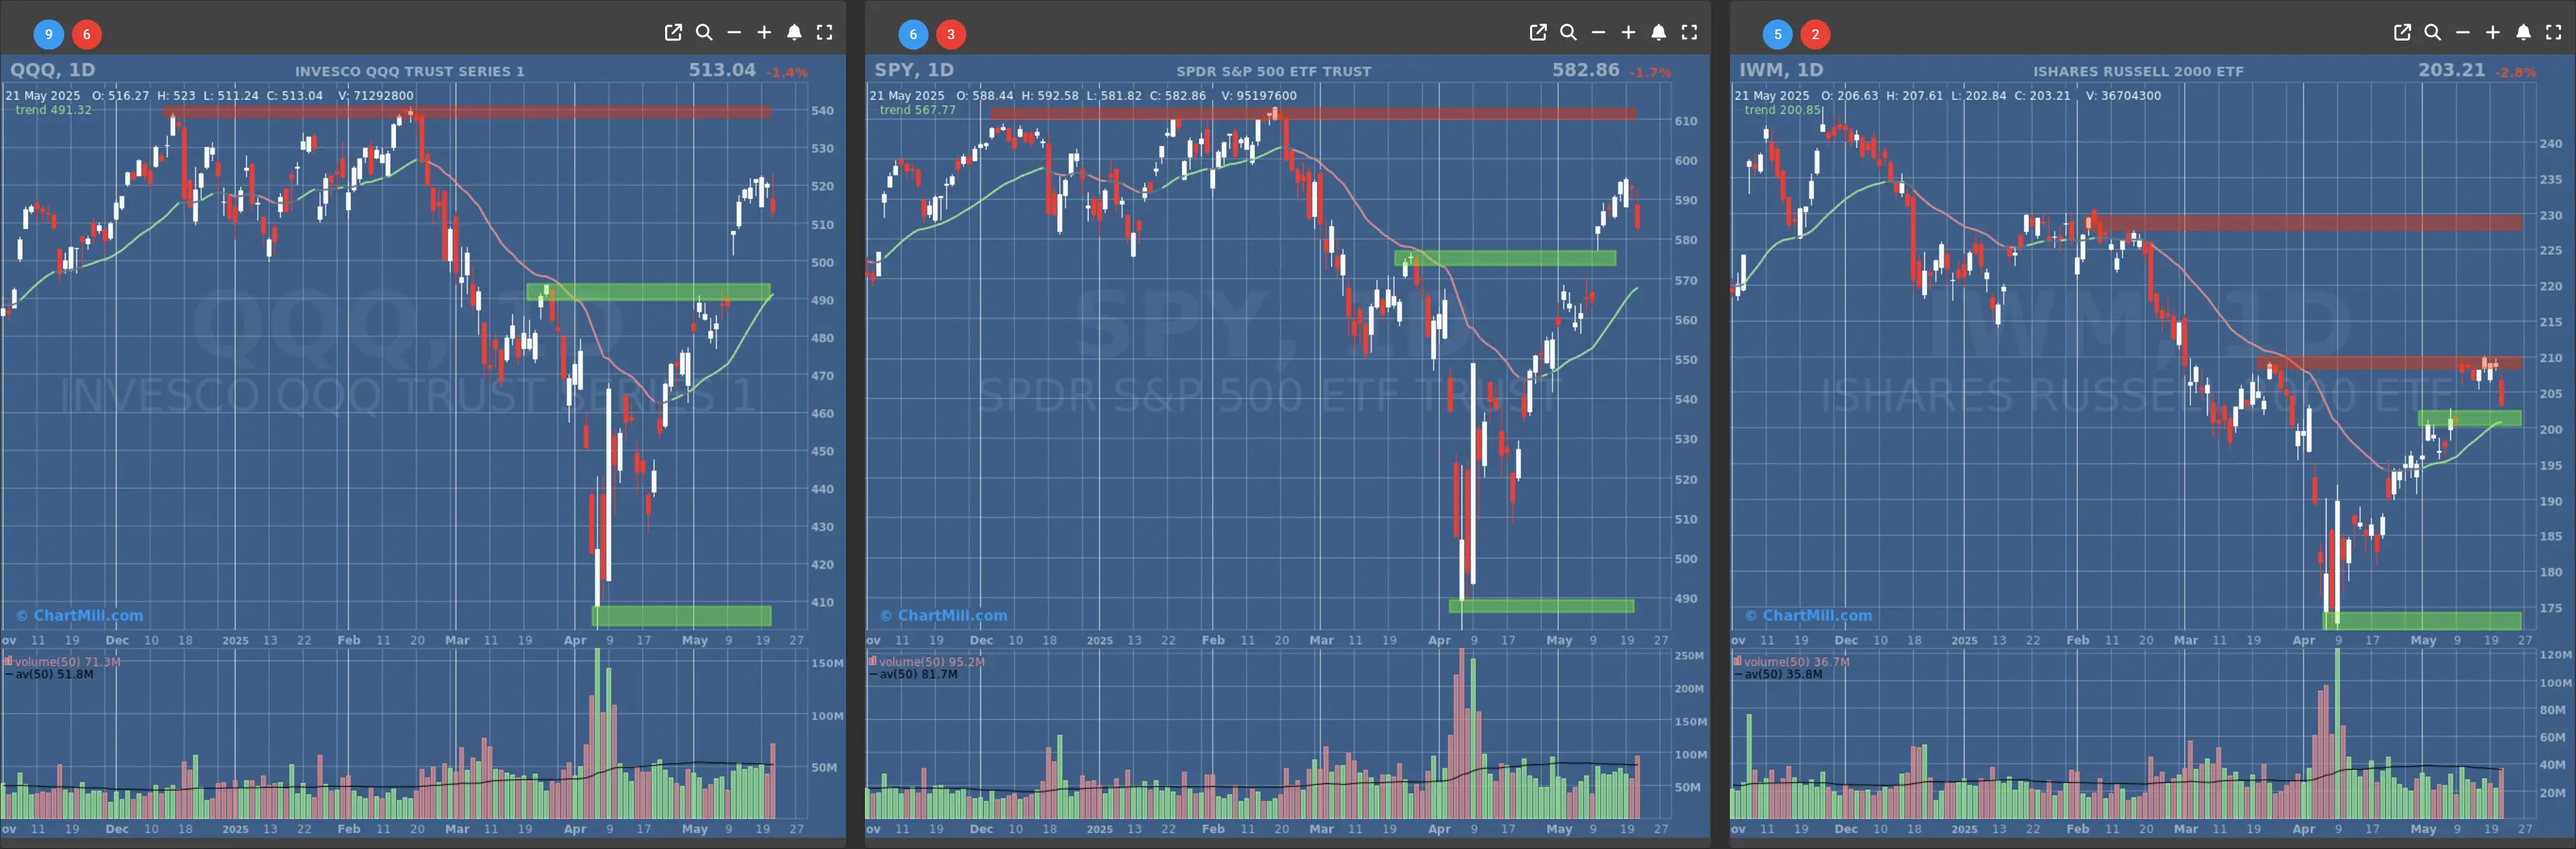
- Short-Term Trend: Bullish (no change)
- Next Support at $570
- Next Resistance at $595
- Volume: Above Average (50)
- Pattern: Hanging Man Candle, Gap Down
- Short-Term Trend: Bullish (no change)
- Next Support at $490
- Next Resistance at $520
- Volume: Above Average (50)
- Pattern: Hanging Man Candle, Gap Down
- Short-Term Trend: Bullish (no change)
- Next Support at $200
- Next Resistance at $205 & $210
- Volume: At Average (50)
- Pattern: Heavy Down Day, Break Down Sideways Range
Long Term Trend
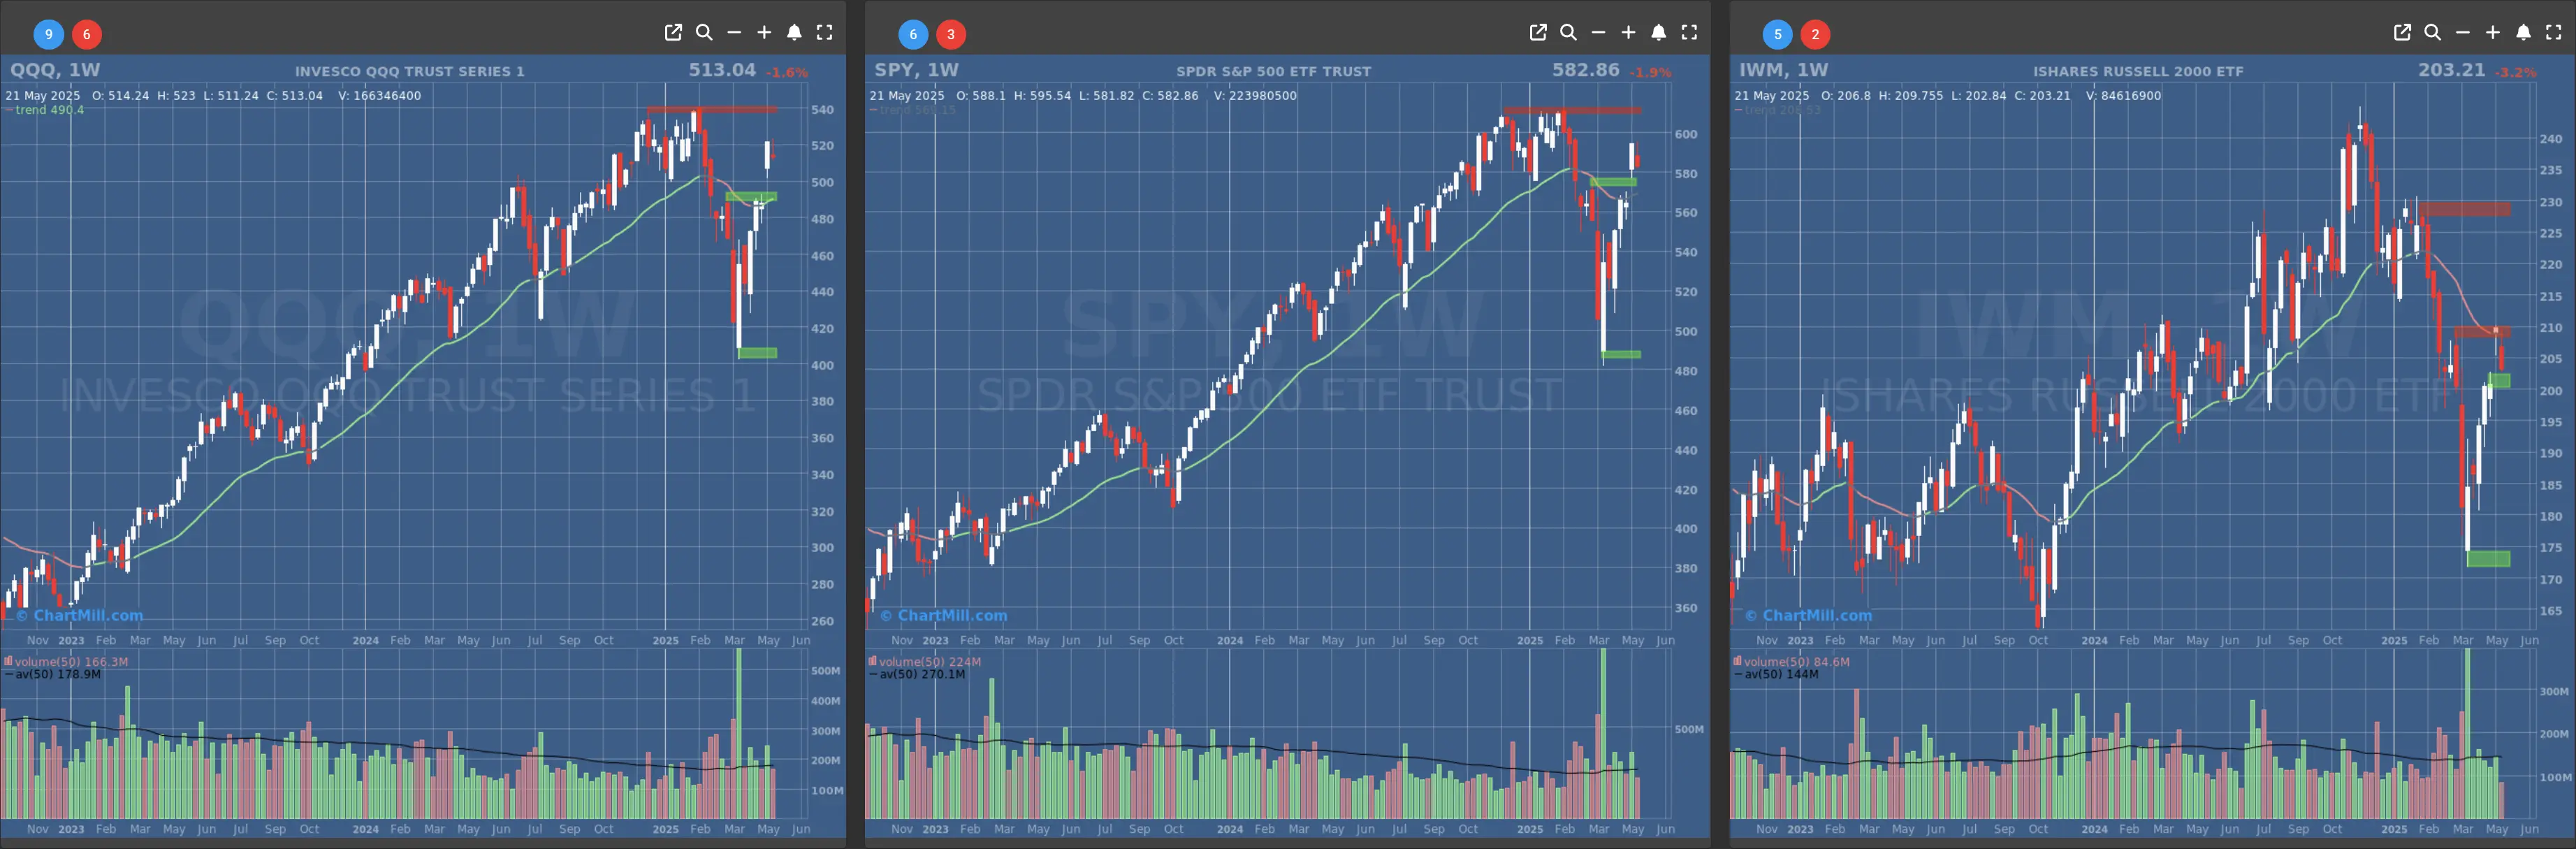
- Long-Term Trend: Neutral (no change)
- Long-Term Trend: Positive (no change)
- Long-Term Trend: Neutral (no change)
Daily Market Breadth Analysis – May 21, 2025 (After Market Close)
Breadth Weakening Significantly into May 21
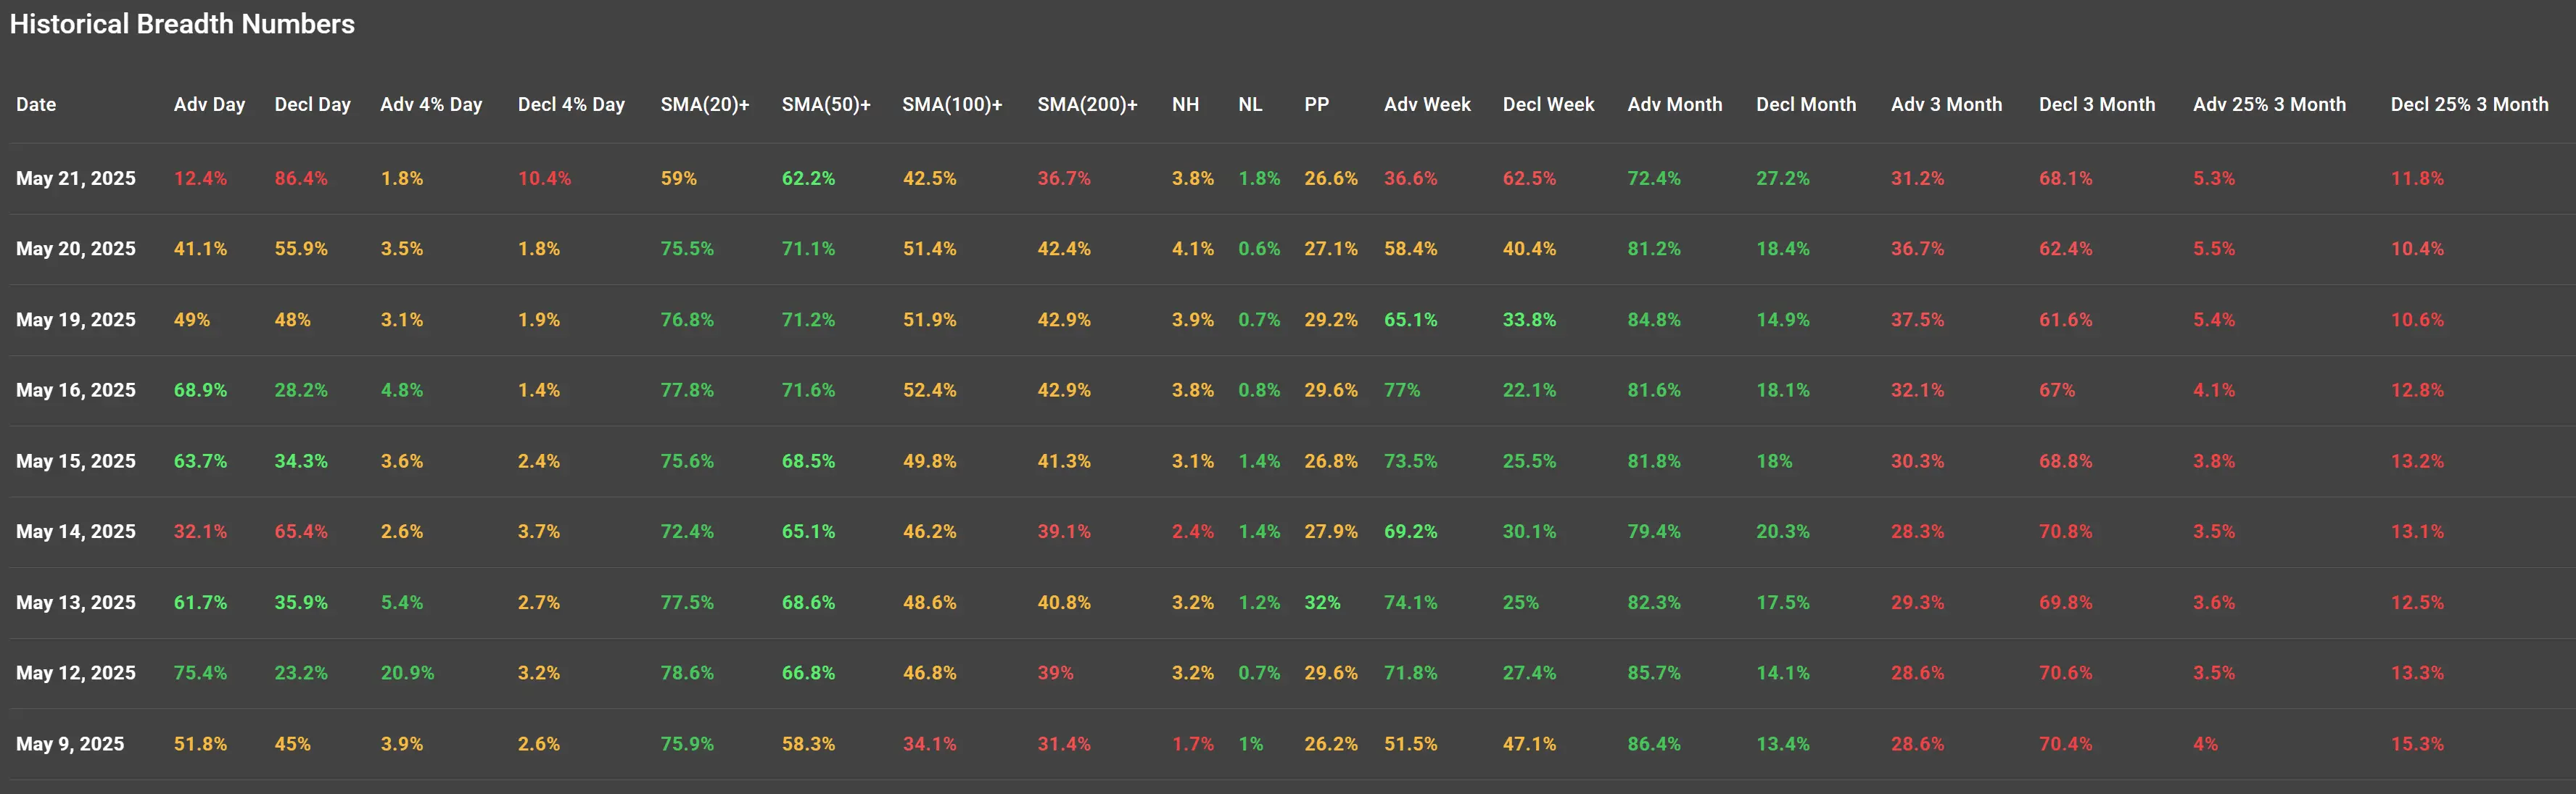
On May 21, 2025, only 12.4% of stocks advanced, while a stark 86.4% declined, one of the weakest breadth days in the period. This contrasts sharply with May 12, where 75.4% of stocks advanced and only 23.2% declined, a broad-based up day.
Gradual Erosion in Participation
From May 12 through May 20, there was a steady decline in advancing issues and a rise in decliners, indicating narrowing participation in rallies.
Breadth deteriorated ahead of the major drop on May 21, signaling weakening market internals before the breakdown.
Stocks Above Key Moving Averages
-
Stocks above the SMA(20) peaked at 78.6% on May 12 but dropped to 59% by May 21.
-
A similar decline is seen in the SMA(50)+ (from 71% to 62%) and SMA(100)+ (51.4% to 42.5%).
-
The SMA(200)+ measure - a long-term health indicator - remains below 43% throughout, suggesting the broader market is still not fully healthy even prior to May 21.
New Highs vs New Lows
-
New Highs remained modest (~3–4%) throughout the period, peaking slightly before May 21.
-
New Lows, while low until May 20, spiked to 1.8% on May 21 — a warning sign of internal damage beneath the surface.
Visual Highlights:
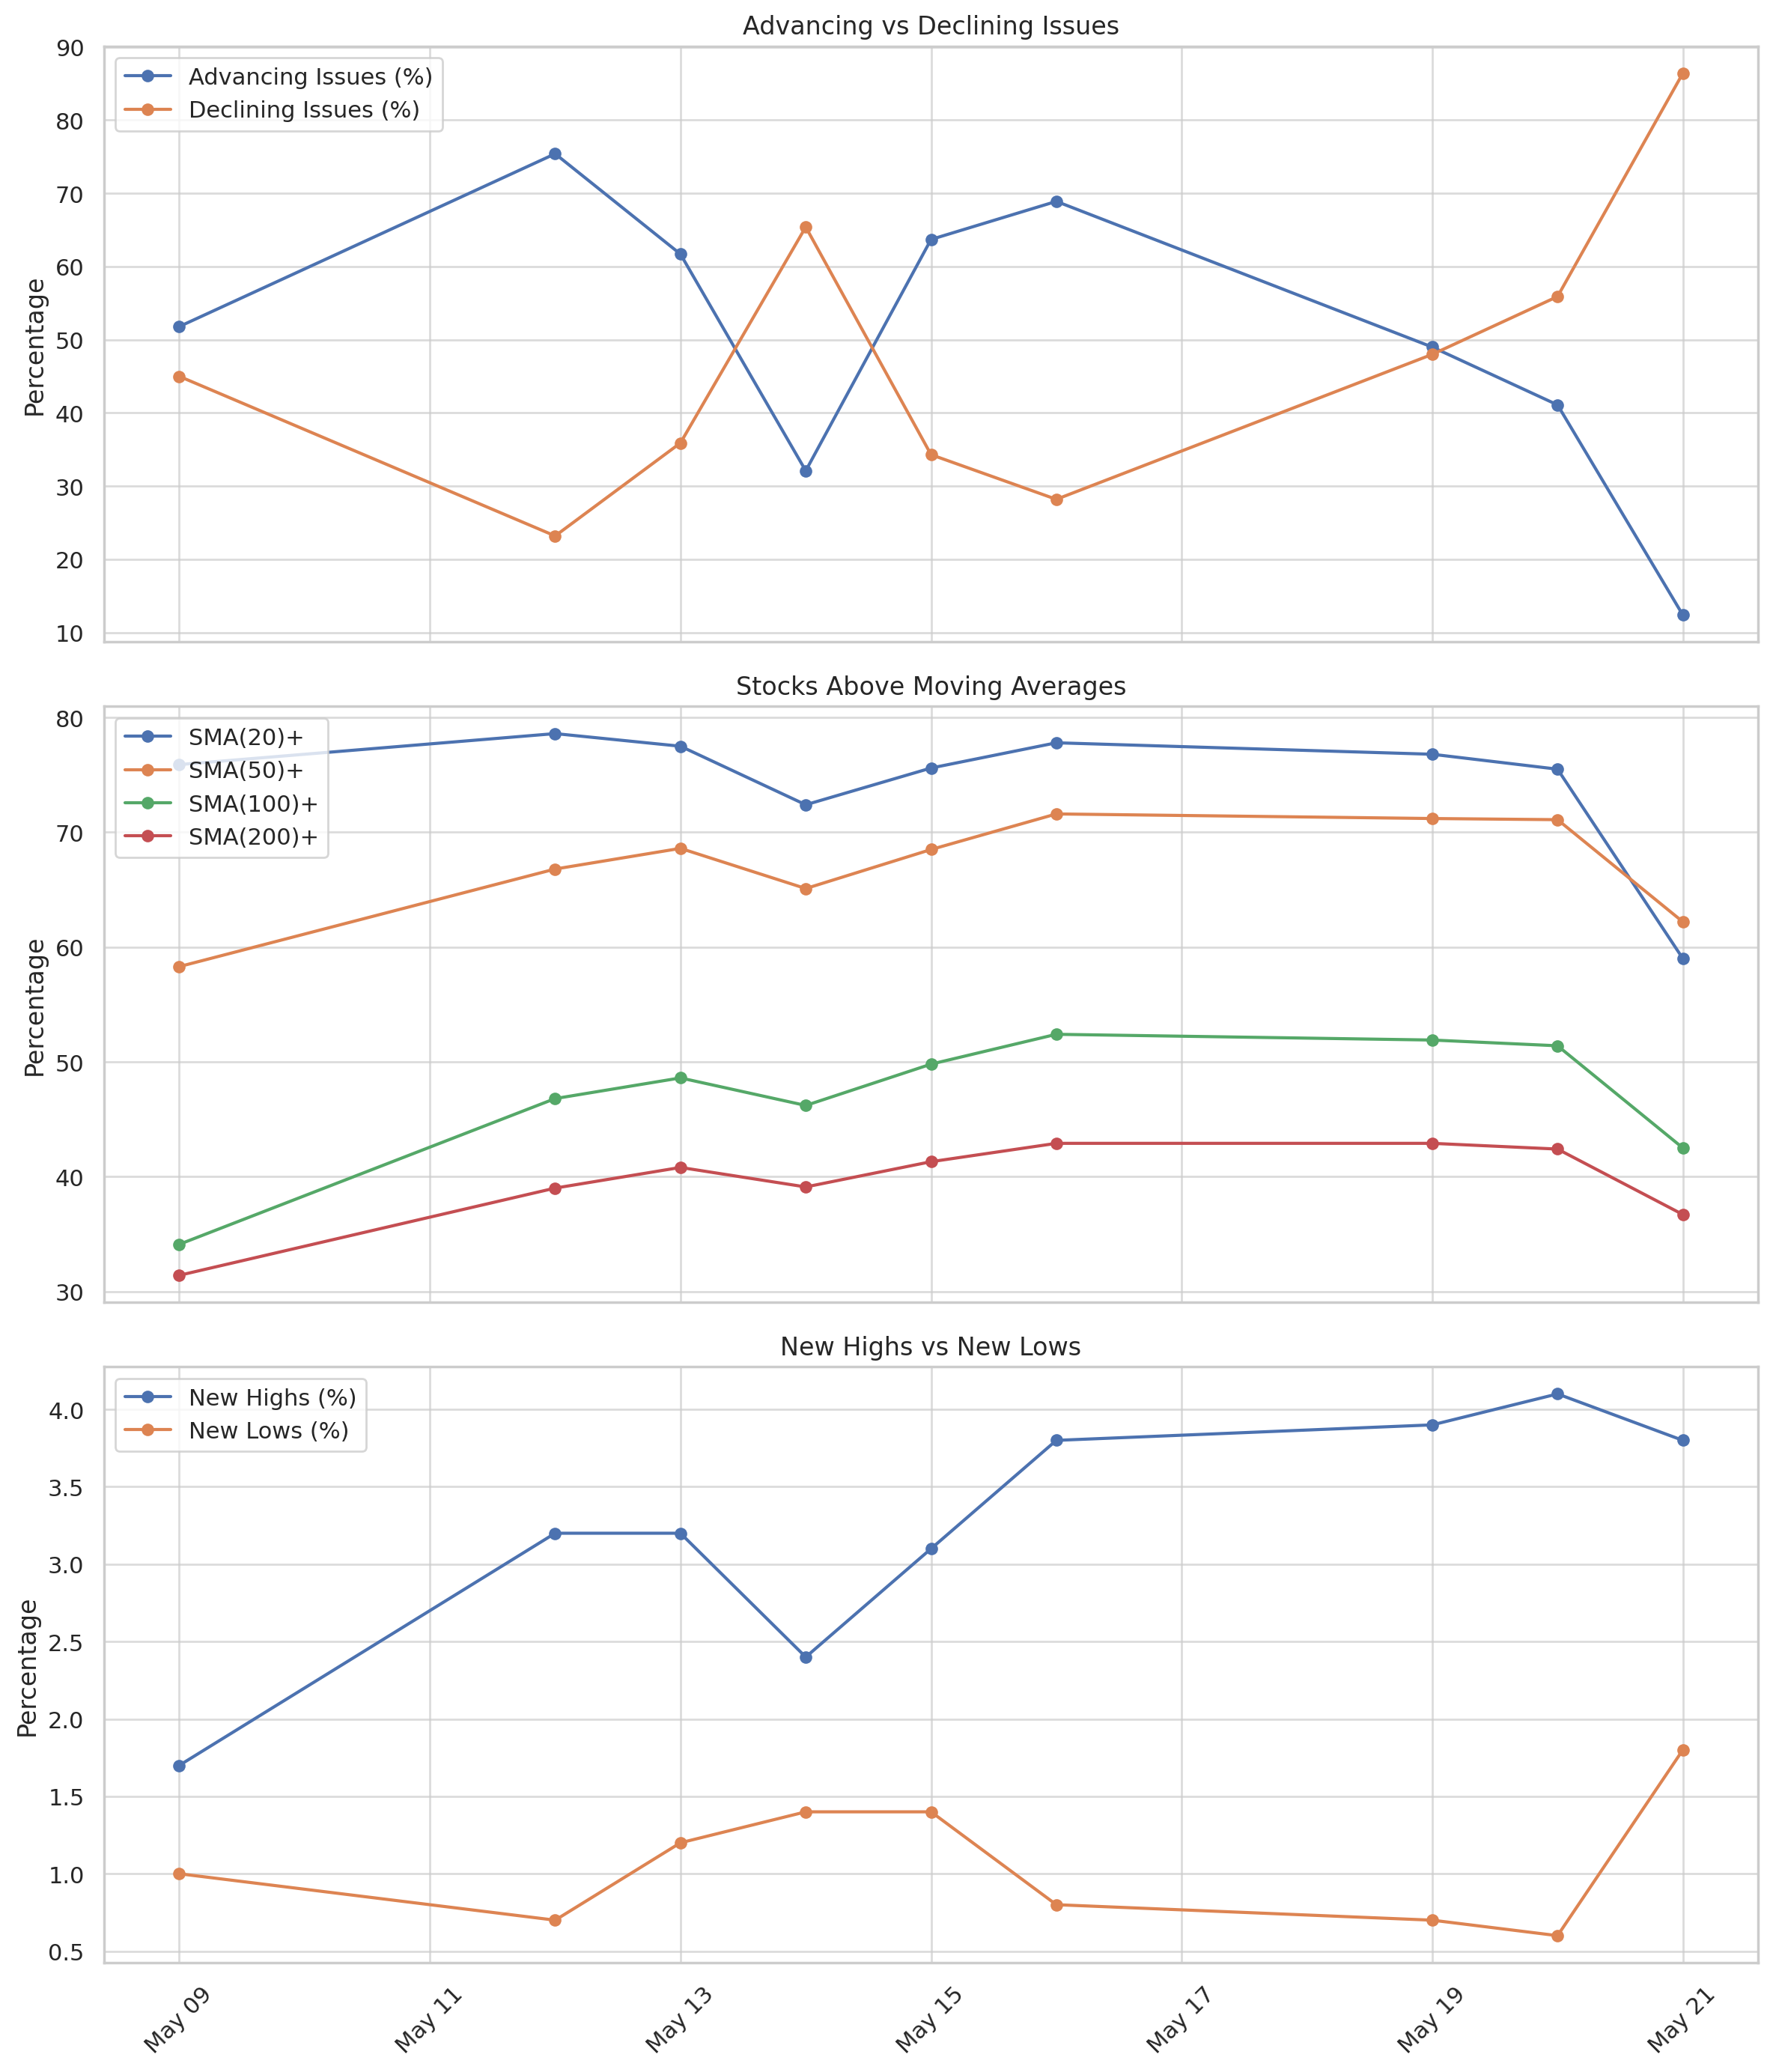
Advancers vs Decliners:
The drastic inversion on May 21 (majority of stocks declining) visually underscores the breadth collapse.
Stocks Above Moving Averages:
A steady downtrend from short- to long-term averages shows internal weakness building.
New Highs vs New Lows:
The spread between NH and NL narrowed, with lows increasing — a classic sign of a deteriorating market.
Implications:
The broad-based selling on May 21 wasn't a surprise, it was preceded by several days of narrowing breadth. Participation is thinning, and without a reversal in moving average support or a broad uptick in advancers, market risk remains elevated.
Traders and investors should be cautious of rallies that lack broad participation and consider risk management or defensive positioning.