
(All data & visualisations by ChartMill.com)
Daily Market Trend Analysis – July 03, 2025 (After Market Close)
All index ETFs are heading into the long weekend on a strong finish.
Short Term Trend
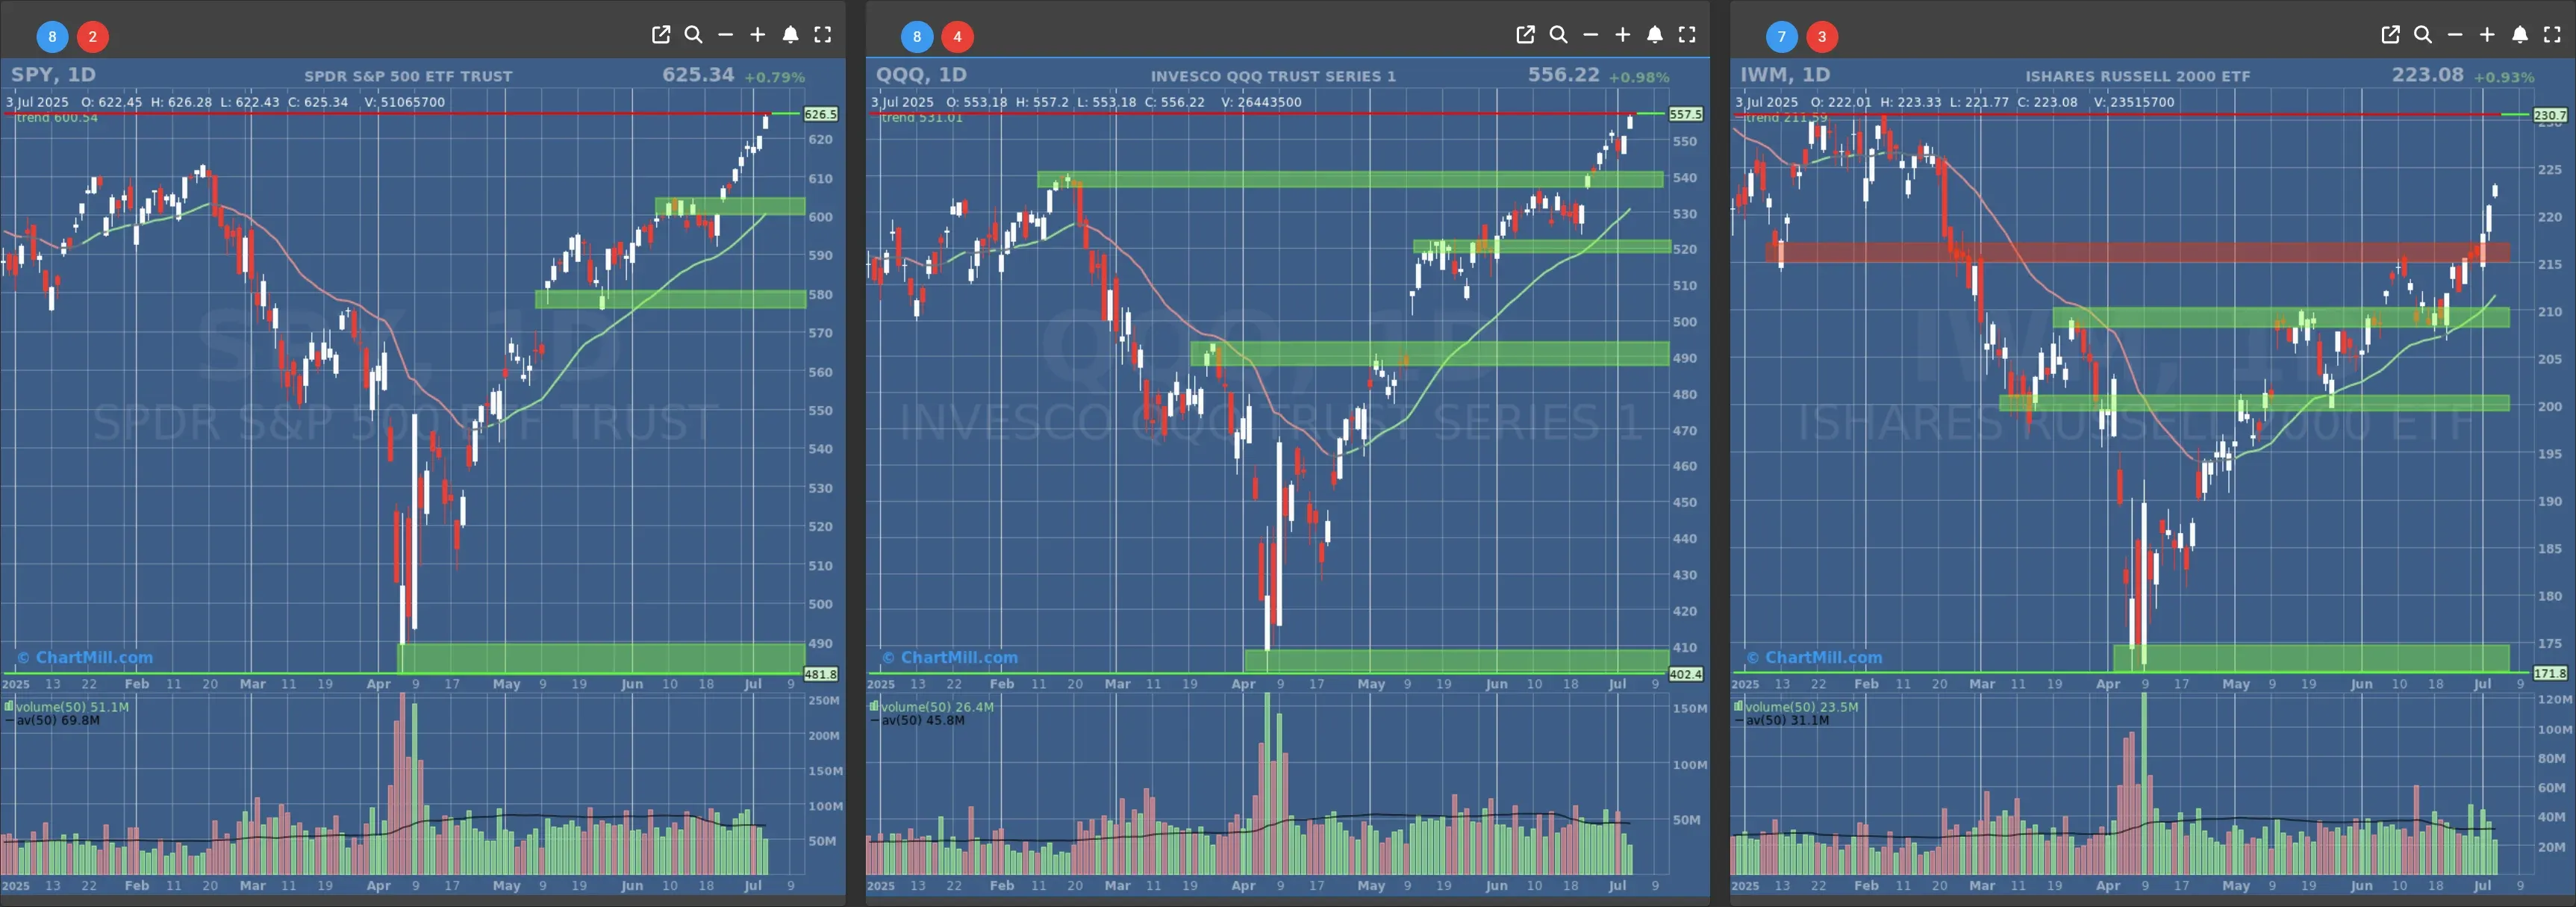
- Short-Term Trend: Bullish (no change)
- Next Support at $600 to $610
- Next Resistance at /
- Volume: Below Average (50)
- Pattern: Gap Up & Up Day
- Short-Term Trend: Bullish (no change)
- Next Support at $540
- Next Resistance at /
- Volume: Far Below Average (50)
- Pattern: Gap Up & Up Day
- Short-Term Trend: Bullish (no change)
- Next Support at $210
- Next Resistance at $215 to $220
- Volume: Below Average (50)
- Pattern: Gap Up & Up Day
Long Term Trend
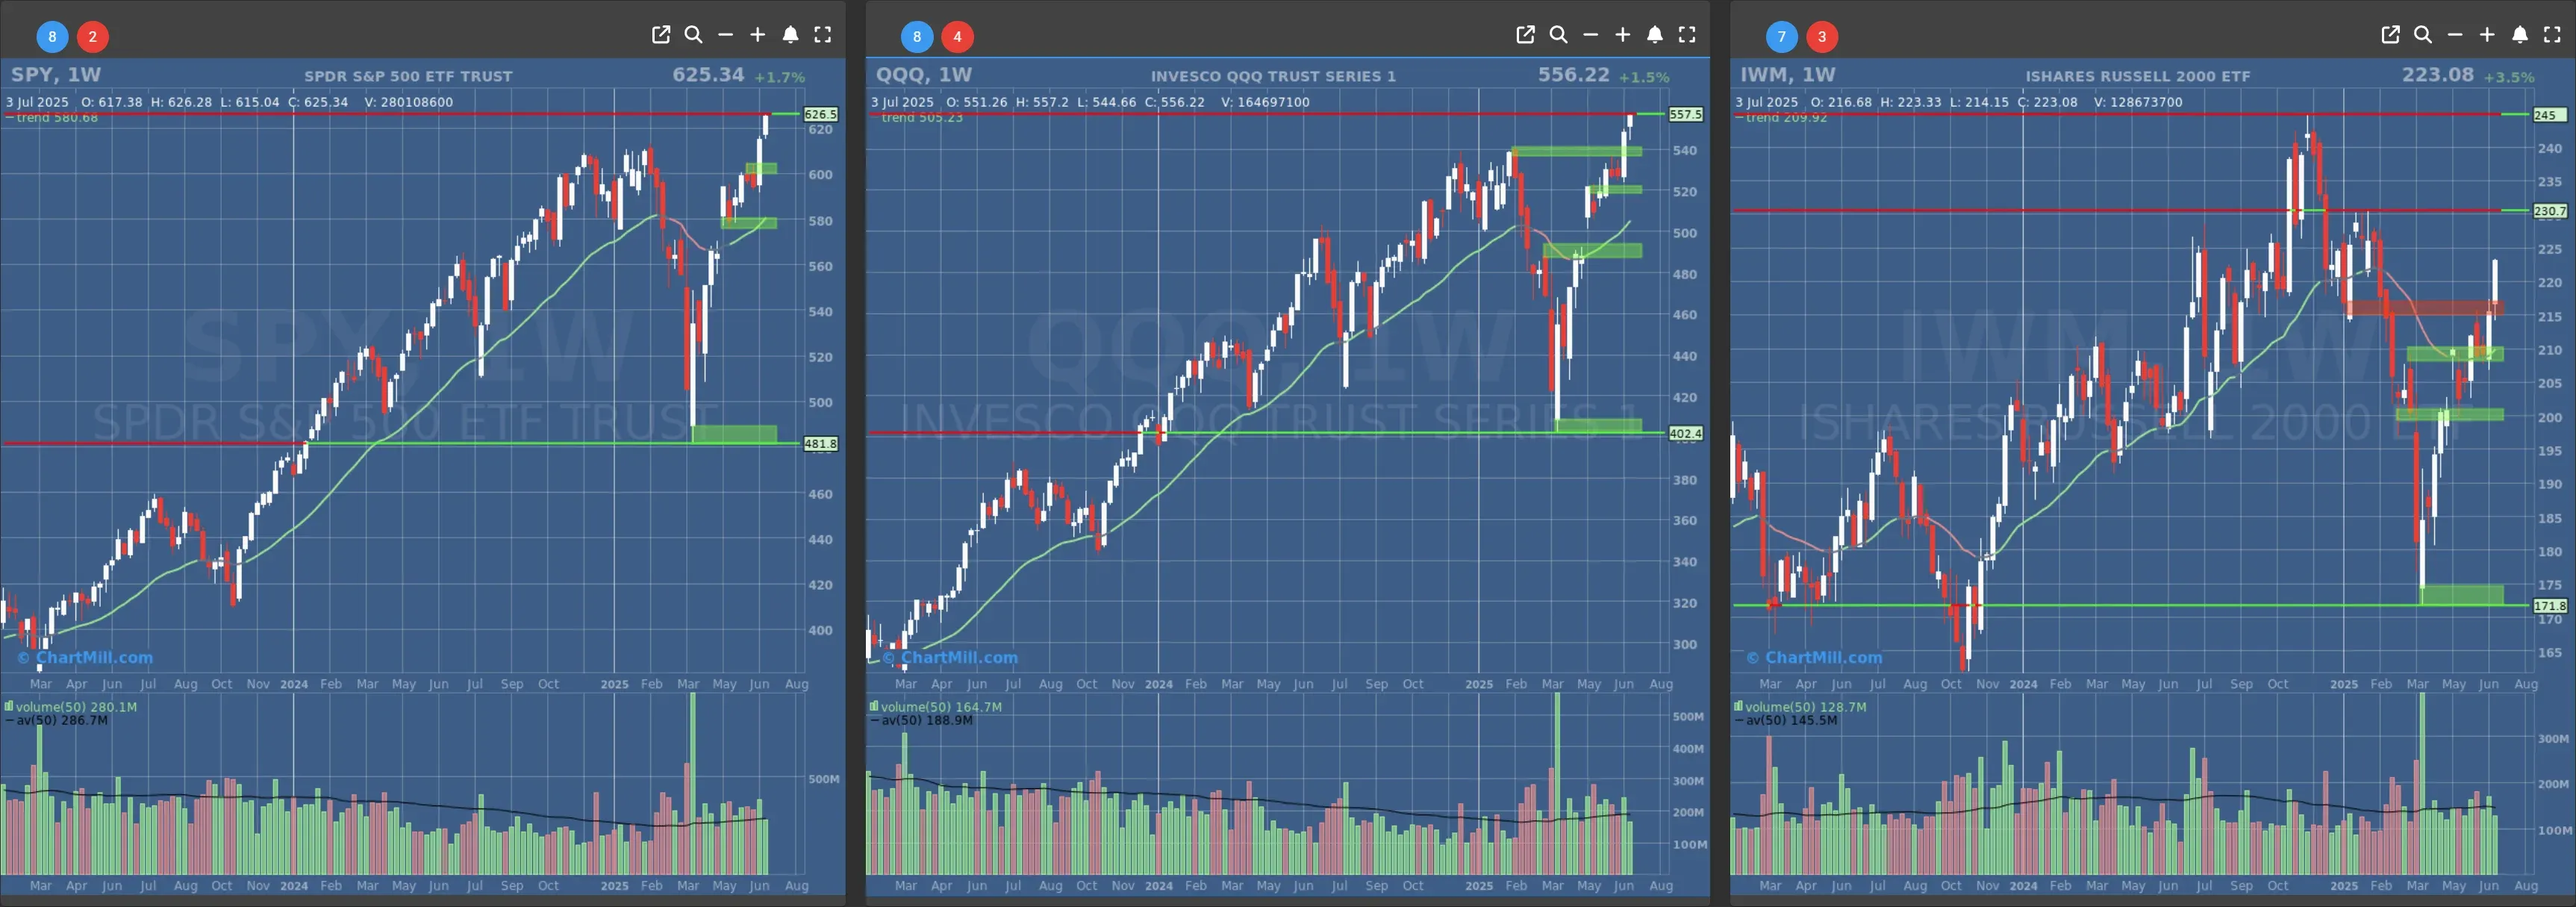
- Long-Term Trend: Positive (no change)
- Long-Term Trend: Positive (no change)
- Long-Term Trend: Positive (changed from neutral) - CONFIRMED
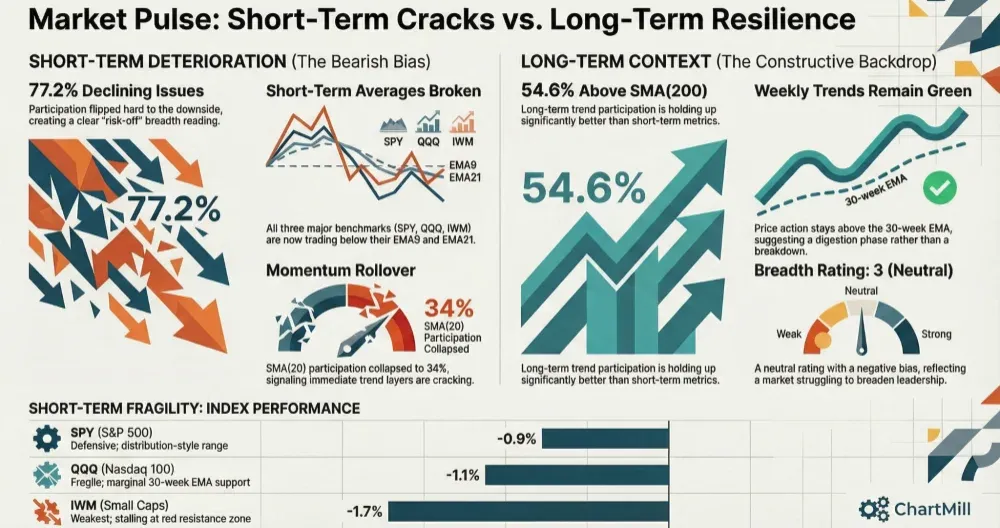
Daily Market Breadth Analysis – July 03, 2025 (After Market Close)
The markets may have taken a day off for the Fourth of July, but heading into the holiday, they were anything but sluggish. Between booming jobs data, Elon Musk launching a political party, and strong performances from names like Tripadvisor (TRIP | +16.7%) and Datadog (DDOG | +15.0%), the bulls were definitely in charge.
But below the surface, I’m watching something else - market breadth - and it’s telling me a slightly more nuanced story.
Market Breadth: Under the Hood, Signs of Strength (and a Few Cracks)
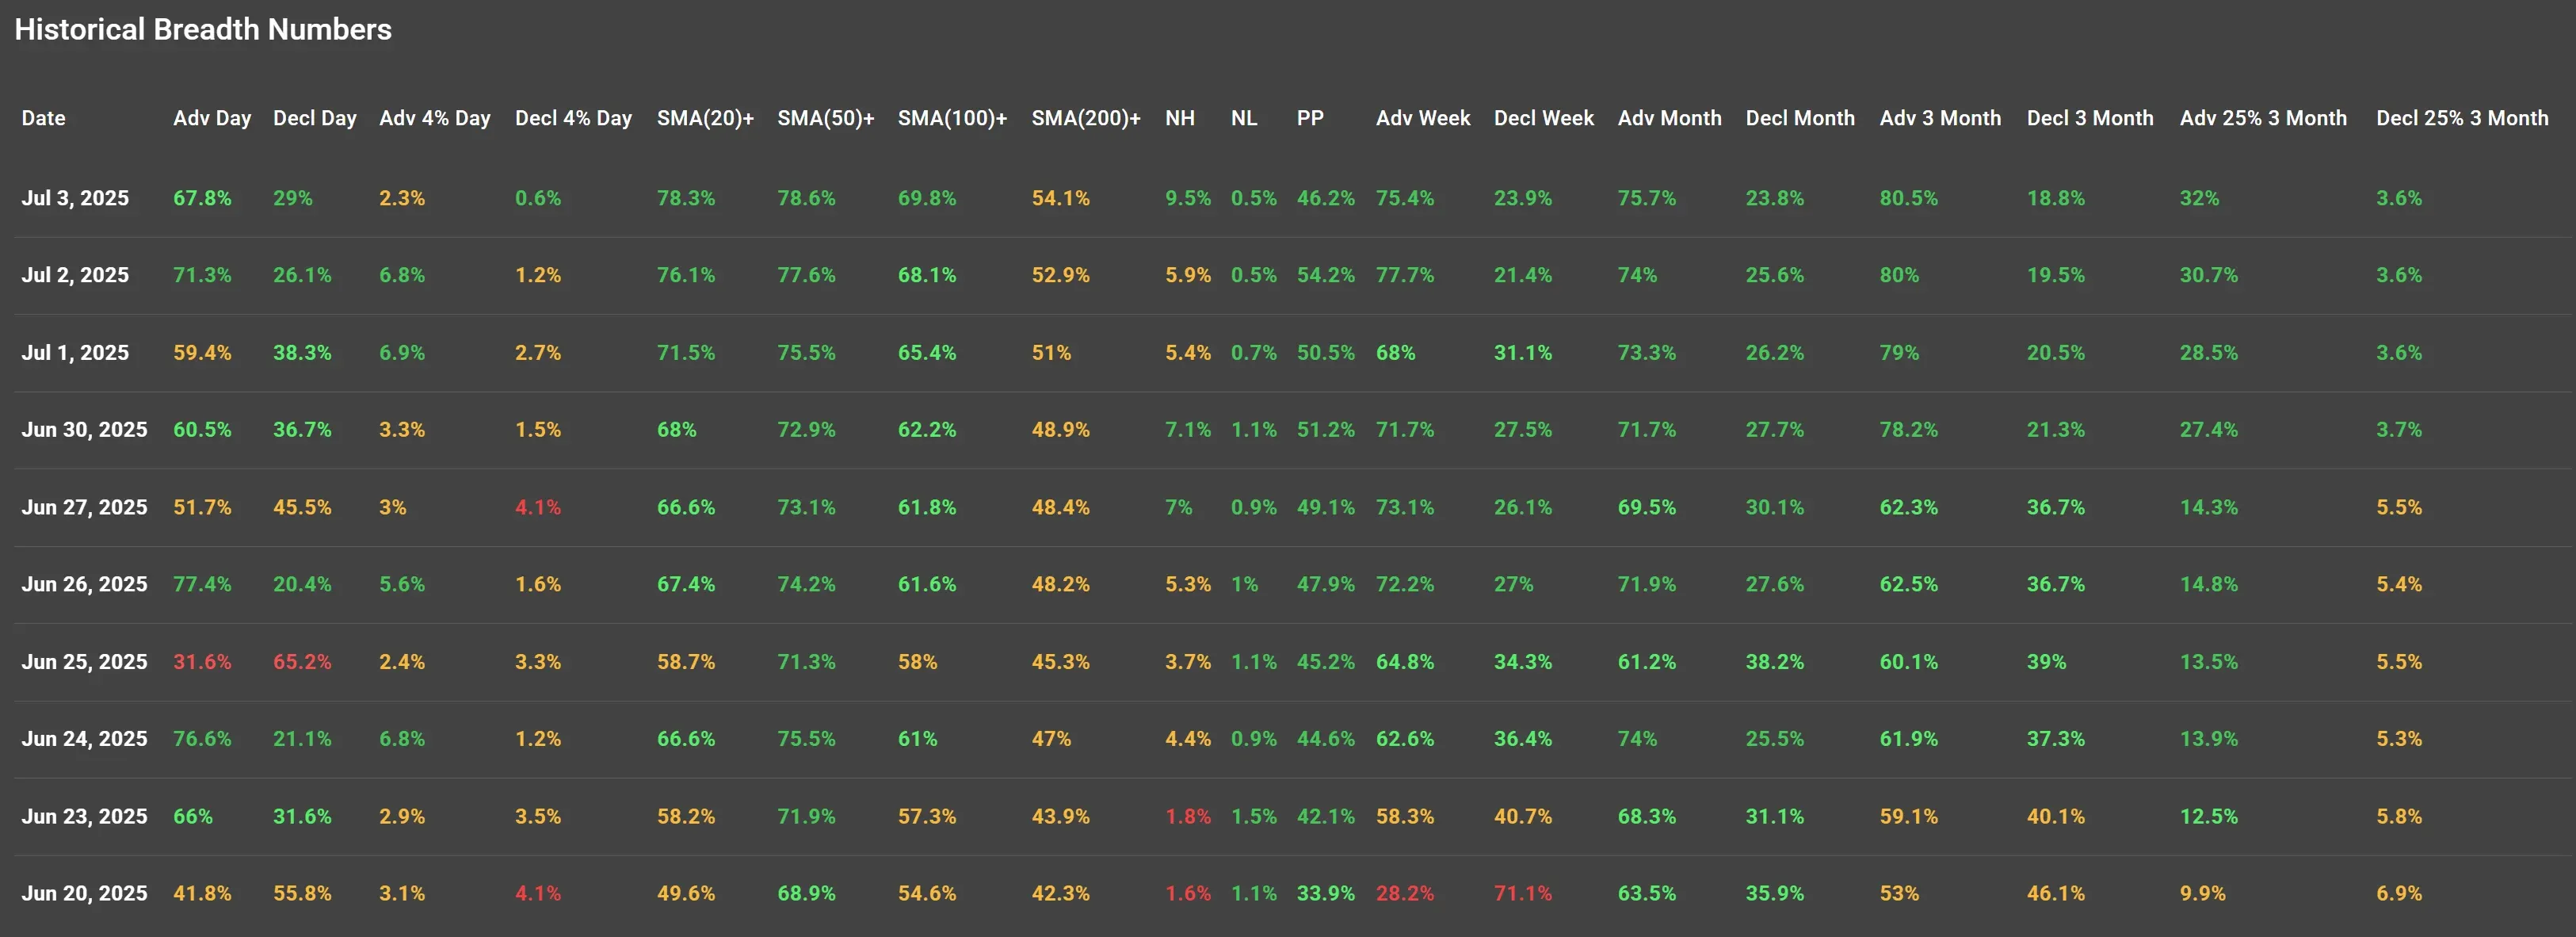
While the headlines screamed record highs, I dug into the historical breadth data through July 3, 2025, and it paints a picture of a market still very much in “uptrend” mode, but with some signals investors would do well to monitor closely.
Take July 3:
-
67.8% of stocks advanced — a solid showing, though down from the 71.3% on July 2.
-
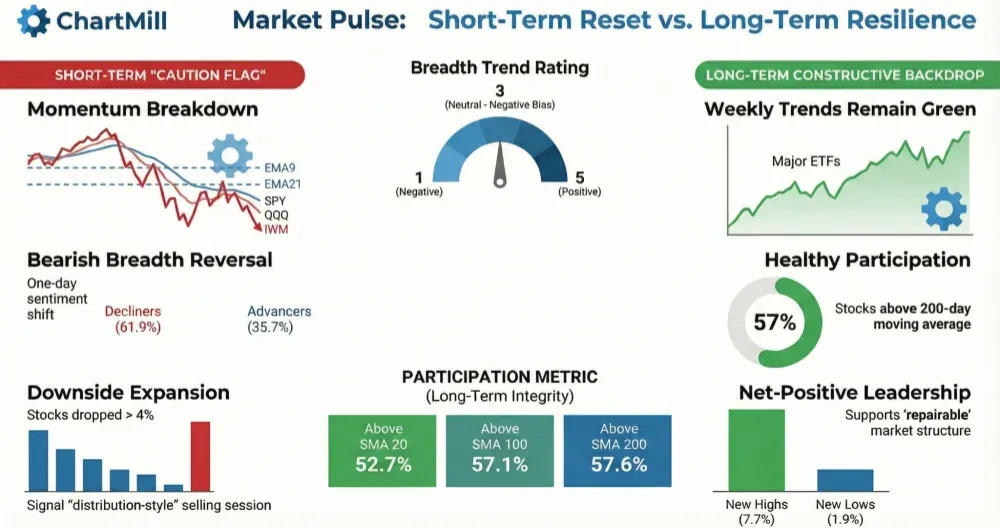
Just 2.3% of stocks gained more than 4%, suggesting this wasn’t a broad surge of momentum names breaking out.
-
Only 0.6% of stocks declined more than 4%, so selling pressure remains relatively muted.
Where things get more telling is in the longer-term metrics. As of the last session:
-
78.6% of stocks are trading above their 50-day simple moving average (SMA), and 69.8% are above the 100-day.
-
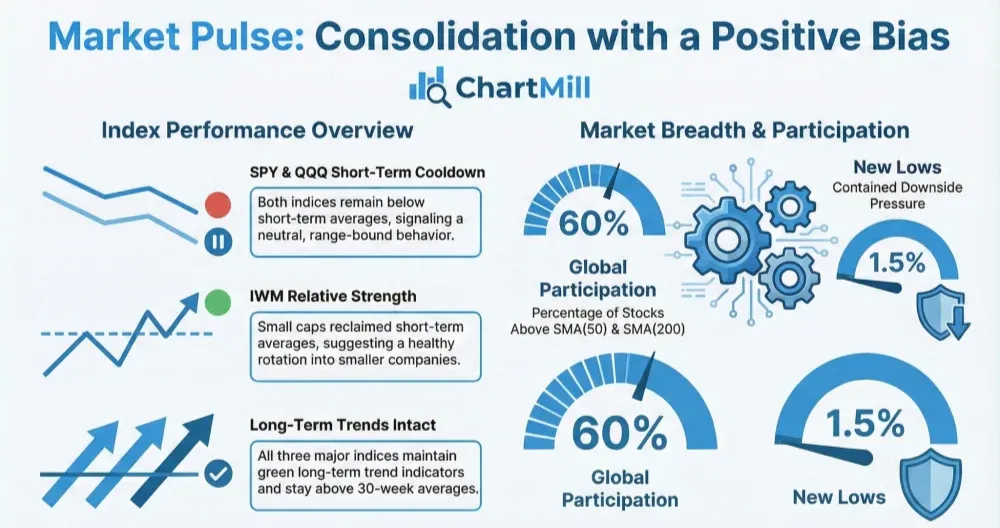
Even the 200-day SMA reading rose to 54.1%, up from sub-50% levels just a few sessions ago, another green flag.
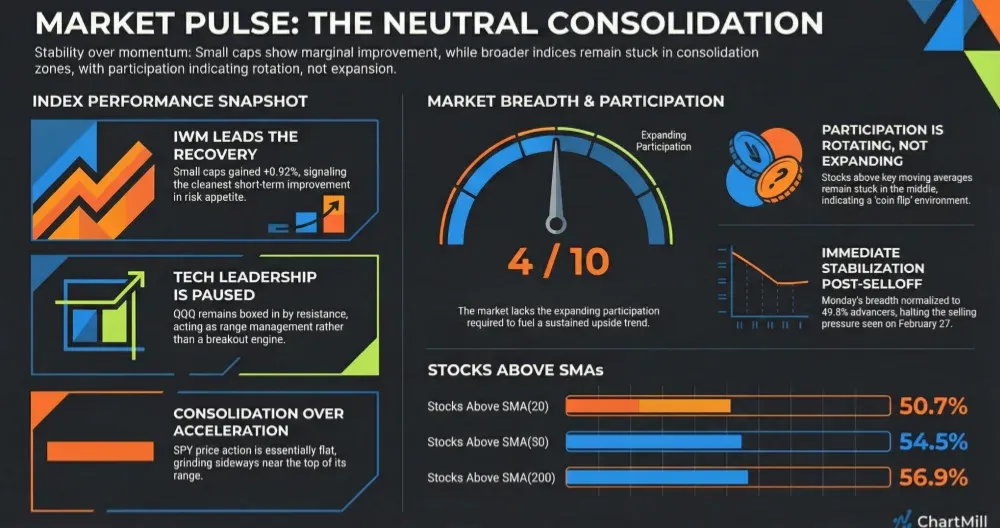
That said, participation is beginning to narrow at the extremes. The % of stocks 25%+ above their 3-month low is now at 32%, up from 14% last week, strong, but not euphoric.
Meanwhile, new highs (NH) are still relatively tame at 9.5%, and new lows (NL) remain suppressed at just 0.5%. For a market at record highs, I’d expect broader enthusiasm and this slight divergence is worth watching.
A Quick Glance Back at the Last Two Weeks
Here’s where the story gets interesting. Late June had a couple of shaky days. On June 25, for instance, only 31.6% of stocks advanced, and a whopping 65.2% declined. Breadth fell off a cliff, but rebounded quickly, a bullish sign. Still, that whipsaw action reflects a fragile confidence, easily spooked by macro news (remember: that was right before the Trump budget bill drama exploded).
Also noteworthy, the advance/decline (A/D) lines on a weekly and monthly basis remain tilted heavily positive:
-
75.7% of stocks are up over the past month, and
-
80.5% over the past three months.
Final Thought: Watch Participation, Not Just Price
While the S&P 500 sets record after record, it’s easy to get swept up in the euphoria. But smart investors know that what happens beneath the surface often tells you where things are heading next.
The current setup looks healthy; strong breadth, low volatility, solid economic data. But if participation continues to narrow (i.e., if fewer and fewer stocks are leading the charge), expect turbulence. Breadth doesn’t lie, it just whispers before it yells.
"Breadth doesn’t lie, it just whispers before it yells"
For now, the trend is our friend. But if the Fed holds back longer than expected or earnings disappoint, don’t be surprised if this party gets a little choppy.
Happy (belated) Fourth and buckle up for earnings season. It’s going to be loud.
Kristoff - Co-founder, ChartMill
Next to read: Market Monitor News, July 07