Market Monitor Trends (SPY, QQQ, IWM) and Breadth May 23
By Kristoff De Turck - reviewed by Aldwin Keppens
Last update: May 23, 2025

(All data & visualisations by ChartMill.com)
Daily Market Trend Analysis – May 22, 2025 (After Market Close)
The broader market is showing mixed signals across key indices.
QQQ is holding near recent highs after a strong recovery, though it faces overhead resistance just above current levels. SPY also remains in an uptrend but is struggling to push through previous highs.
Meanwhile, IWM (Russell 2000) lags behind, facing firm resistance and failing to reclaim its February/March breakdown levels, indicating relative weakness in small caps.
Short Term Trend
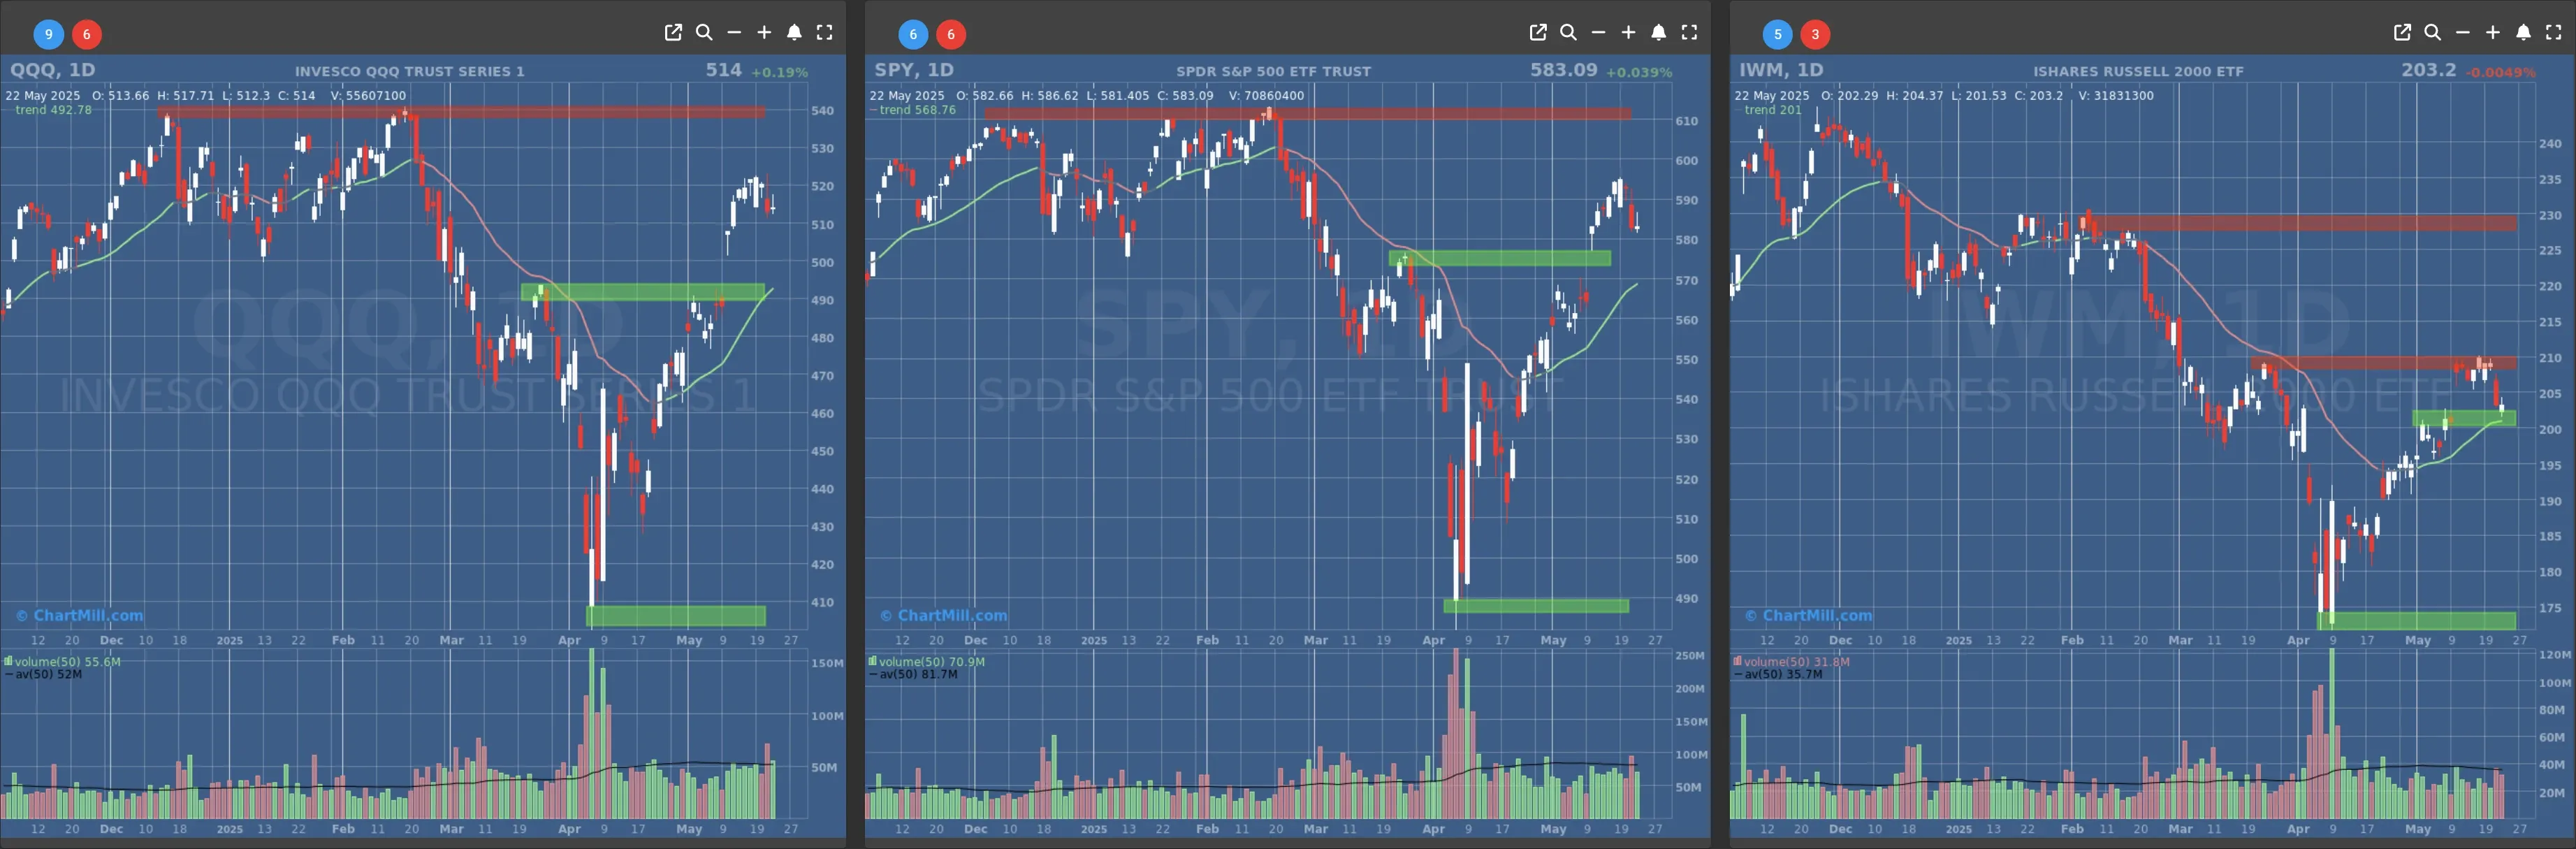
- Short-Term Trend: Bullish (no change)
- Next Support at $570
- Next Resistance at $595
- Volume: At Average (50)
- Pattern: Doji Candle
- Short-Term Trend: Bullish (no change)
- Next Support at $490
- Next Resistance at $520
- Volume: At Average (50)
- Pattern: Doji Candle
- Short-Term Trend: Bullish (no change)
- Next Support at $200
- Next Resistance at $205 & $210
- Volume: At Average (50)
- Pattern: Doji Candle
Long Term Trend
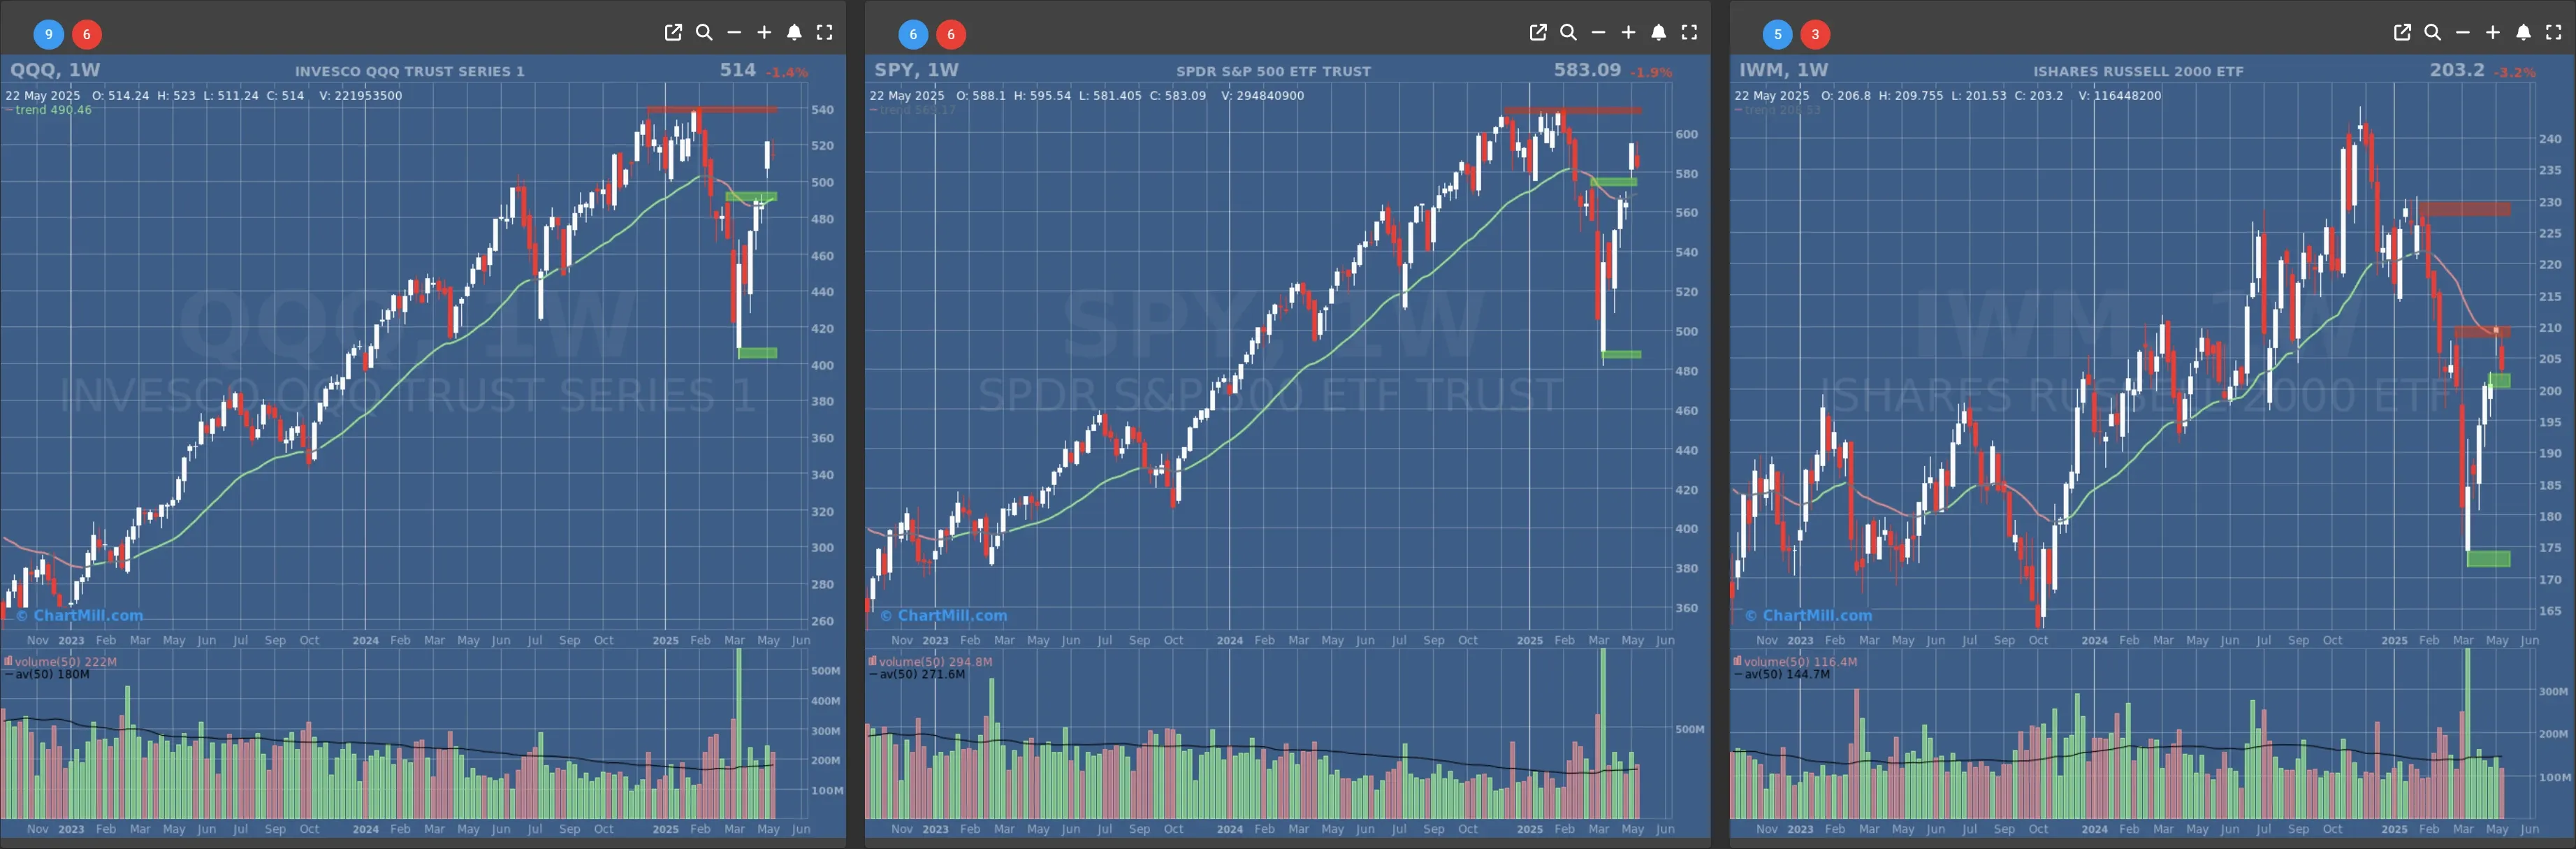
- Long-Term Trend: Neutral (no change)
- Long-Term Trend: Positive (no change)
- Long-Term Trend: Neutral (no change)
Daily Market Breadth Analysis – May 22, 2025 (After Market Close)
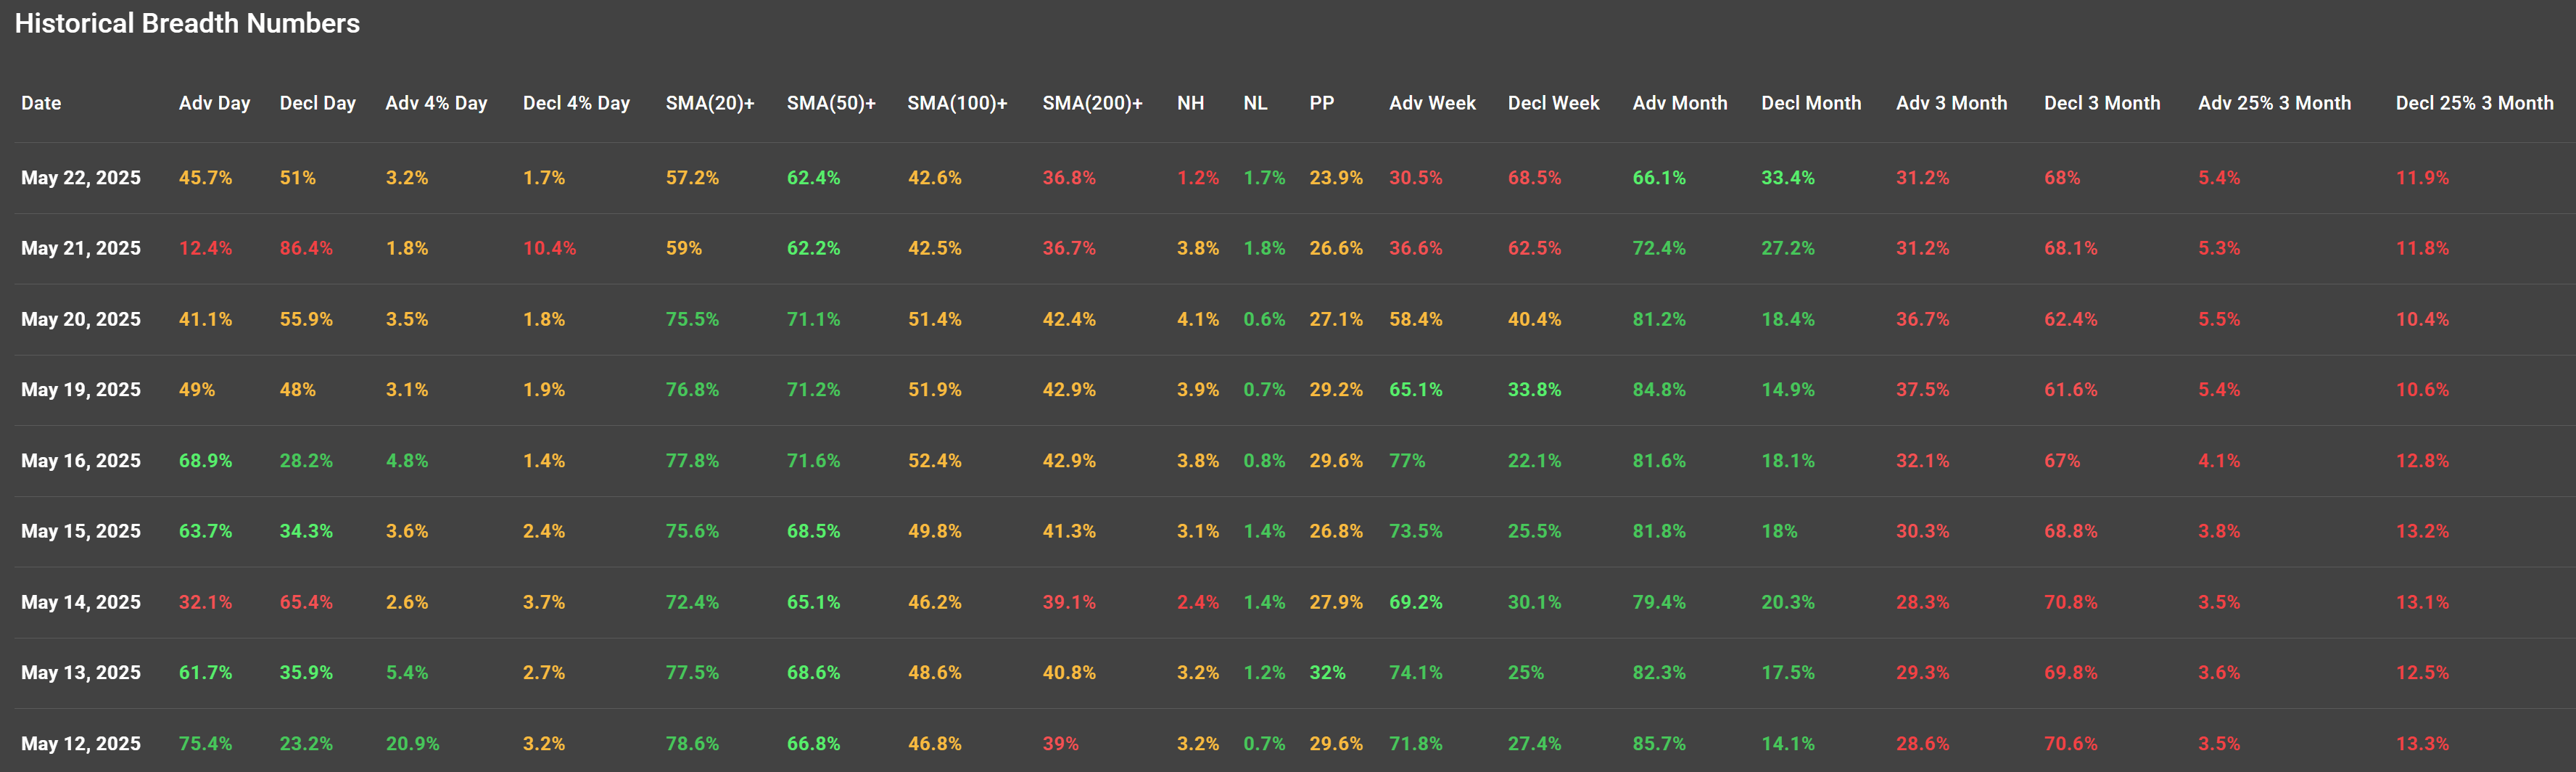
Advancing vs. Declining Stocks
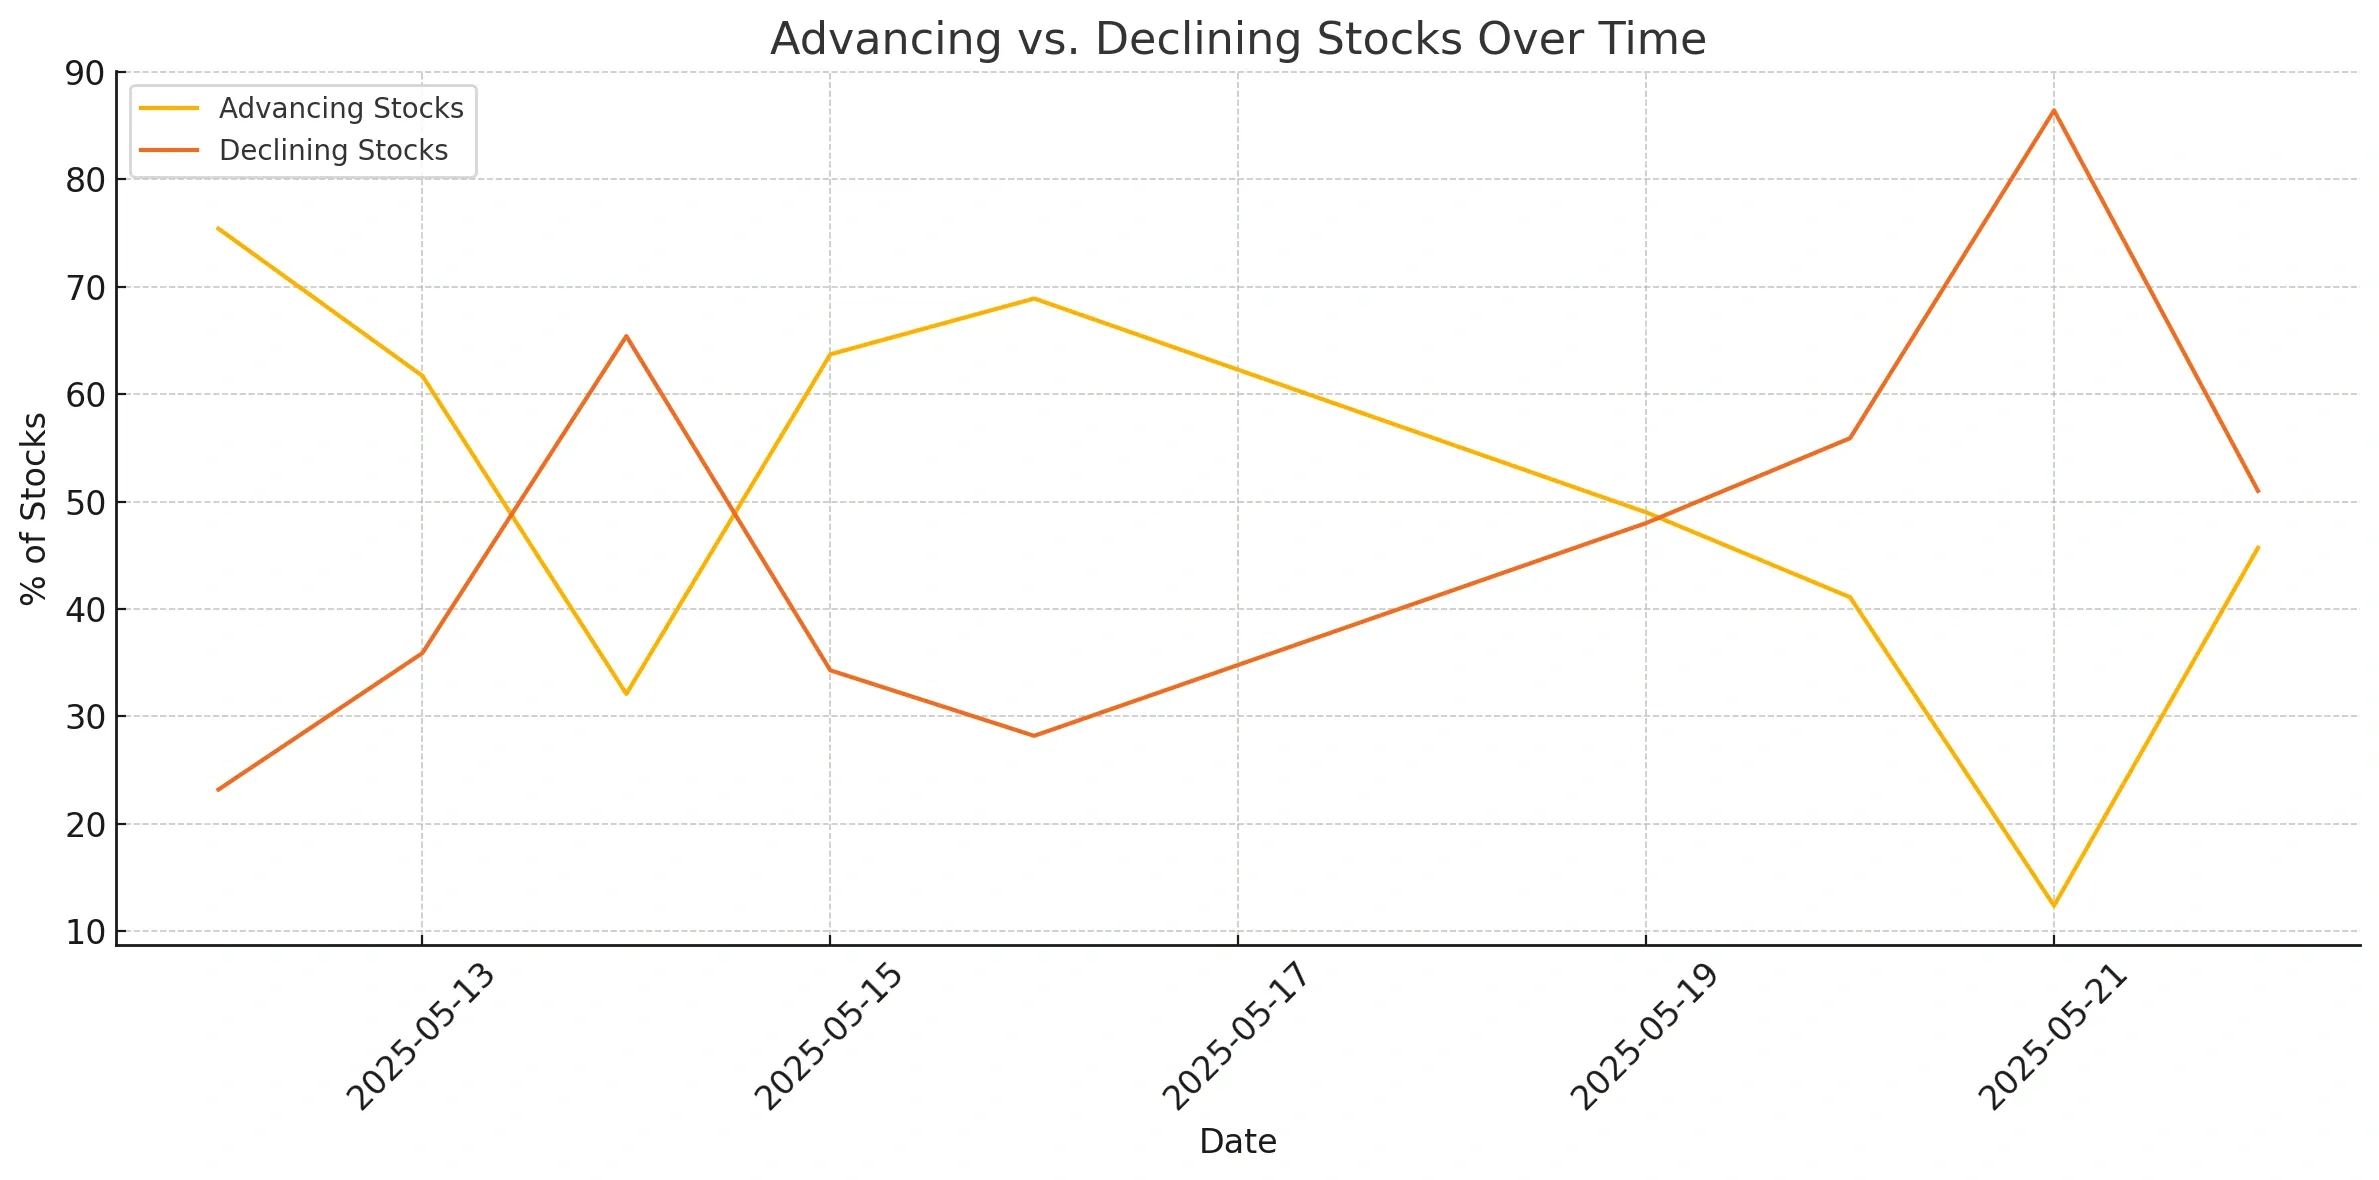
The percentage of advancing stocks fluctuated considerably over the past week. On May 21, breadth turned extremely bearish with only 12.4% of stocks advancing and a massive 86.4% declining? the worst reading in this period.
This aligns with broad market weakness amid fiscal uncertainty.
market sentiment partially recovered on May 22, with advances rebounding to 45.7%, suggesting a temporary stabilization after the sharp sell-off.
The chart below shows this visually: the steep drop and rebound in the orange "Advancing Stocks" line clearly indicate a volatile market climate.
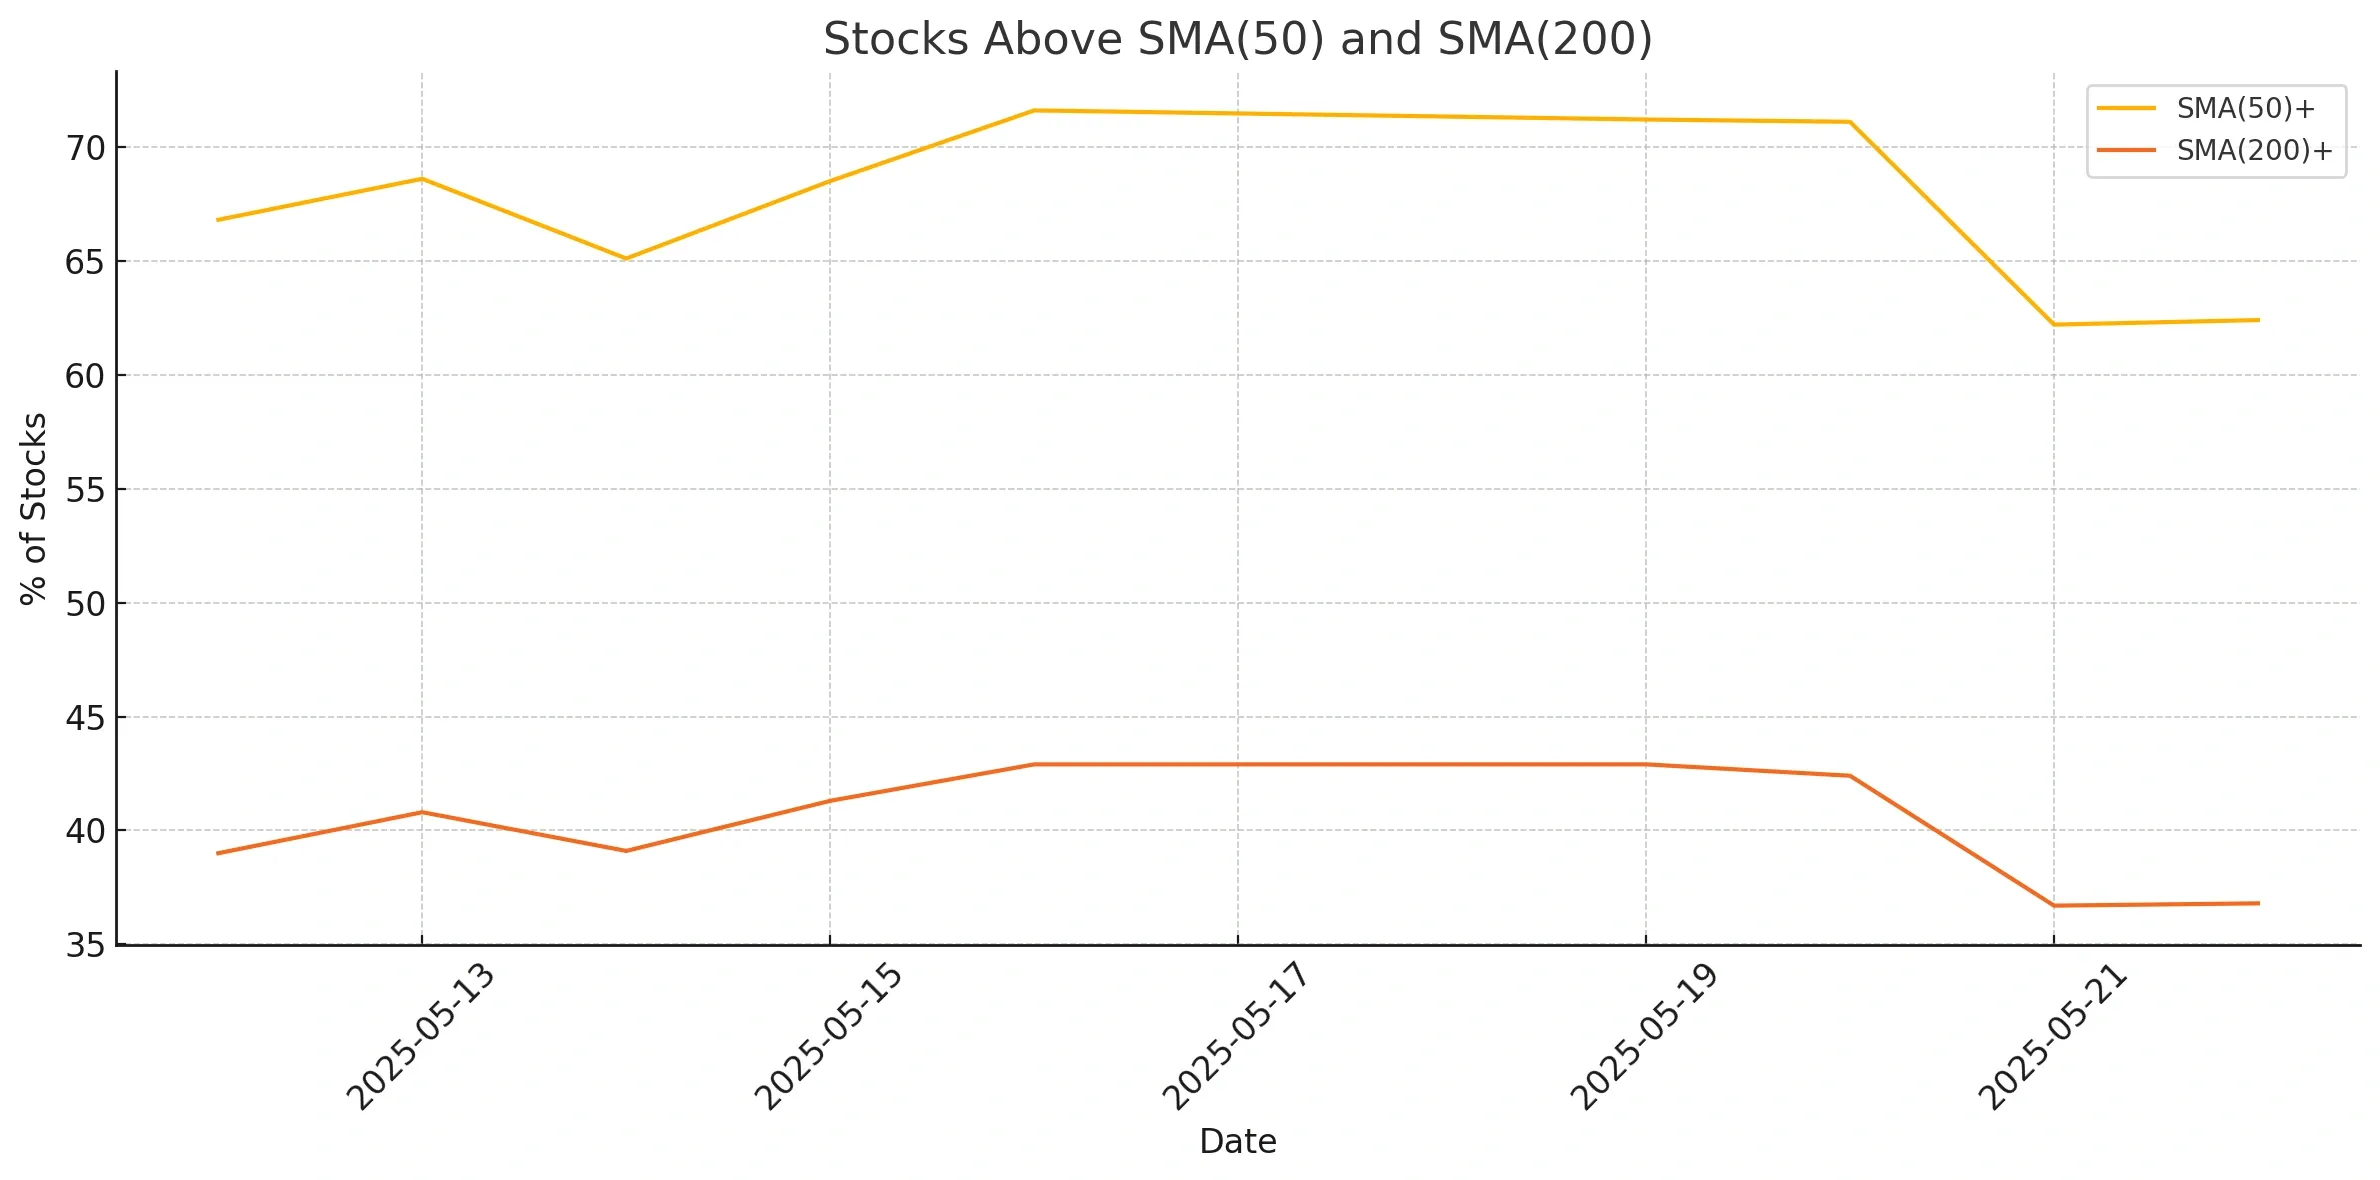
Moving Average Participation (SMA Breadth)
The percentage of stocks trading above key moving averages (SMA50 and SMA200) gives insight into medium- and long-term trend health.
-
SMA(50)+ has been in a slow decline since May 16, dropping from 71.6% to 62.4% by May 22, showing weakening intermediate-term momentum.
-
SMA(200)+ remains relatively stable but low, sitting at 36.8% on May 22, indicating that fewer than 4 in 10 stocks remain in long-term uptrends.
The second chart illustrates this trend degradation clearly, especially in SMA(50), which is more sensitive to recent market conditions.
Short-Term Momentum
Advance 4% Day and Decline 4% Day reveal strong individual stock moves. These readings remained low except on May 12 (20.9% advancing 4%+), suggesting limited participation in powerful breakouts.
The lack of widespread 4%+ gainers despite rebounds hints that the recovery lacks conviction.
New Highs vs. New Lows (NH/NL)
-
New highs (NH) have mostly stayed below 5% of stocks, with a low of 1.2% on May 22.
-
New lows (NL) remain subdued as well, suggesting the broader market isn't in full breakdown mode, despite recent selling pressure.
Longer-Term Breadth (Weekly & Monthly)
Advancing Week and Advancing Month metrics remain mostly strong, especially into May 20–21, suggesting that despite the volatility, broader longer-term trends are still intact for many stocks.
However, Declining Month and Declining 3-Month readings are climbing slightly, and the percentage of stocks declining >25% over 3 months remains stubbornly high (above 10% in every session), indicating underlying weakness.
Summary
-
Short-Term: Market showed extreme weakness on May 21 but rebounded partially the following day.
-
Medium-Term: Fewer stocks remain above key moving averages, especially the 50-day SMA.
-
Long-Term: Conditions are mixed, some strength remains, but an increasing number of stocks are down significantly from their 3-month highs.
Outlook:
The market is in a cautious phase with waning momentum. Sustained strength in breadth indicators—especially SMA(50)+ and New Highs—will be needed to confirm any bullish reversal. Conversely, rising declines and weak participation in rallies may lead to renewed selling pressure.
Next to read: ChartMill Monitor News, May 23
208.44
-0.59 (-0.28%)
528.77
+1.47 (+0.28%)
595.93
-0.16 (-0.03%)
Find more stocks in the Stock Screener
IWM Latest News and Analysis
 6 hours ago - ChartmillMarket Monitor Trends (SPY, QQQ, IWM) and Breadth June 05
Breadth readings remain firm for now, this appears to be a healthy pause, not a reversal.
 2 days ago - ChartmillMarket Monitor Trends (SPY, QQQ, IWM) and Breadth June 04
Both the QQQ and the SPY broke out above their main resistance levels today.
 3 days ago - ChartmillMarket Monitor Trends (SPY, QQQ, IWM) and Breadth June 02
The indices continue to quote close to their next resistance. While headline indices may show only minor daily fluctuations, the underlying breadth data paints a more fragile picture.
 6 days ago - ChartmillMarket Monitor Trends (SPY, QQQ, IWM) and Breadth May 30
The data from May 29, 2025, confirms that market breadth has rebounded significantly, with strong participation and improving technical metrics across shorter moving averages.
 7 days ago - ChartmillMarket Monitor Trends (SPY, QQQ, IWM) and Breadth May 29
The breadth indicators signal a fragile and reactive market environment, prone to sharp swings and lacking sustained leadership. Bullish momentum may struggle to gain lasting traction.
 8 days ago - ChartmillMarket Monitor Trends (SPY, QQQ, IWM) and Breadth May 28
The May 27 surge in breadth confirms the bullish price action observed across major indices on that day, reinforcing the move’s credibility.
 10 days ago - ChartmillMarket Monitor Trends (SPY, QQQ, IWM) and Breadth May 26
The latest data show a market that is weakening internally, with fewer stocks supporting any upside and an increasing tilt toward broad-based selling.
 13 days ago - ChartmillMarket Monitor Trends (SPY, QQQ, IWM) and Breadth May 23
The market is in a cautious phase with waning momentum.
 14 days ago - ChartmillMarket Monitor Trends (SPY, QQQ, IWM) and Breadth May 22
The broad-based selling on May 21 wasn't a surprise, it was preceded by several days of narrowing breadth.
 15 days ago - ChartmillMarket Monitor Trends (SPY, QQQ, IWM) and Breadth May 21
While the major indices are holding up, breadth is beginning to diverge and fewer stocks are driving the rally, market participation is waning.
 16 days ago - ChartmillMarket Monitor Trends (SPY, QQQ, IWM) and Breadth May 20
Markets continued to show resilience at the start of the week, with all major indices maintaining their short-term bullish trends.
 17 days ago - ChartmillMarket Monitor Trends (SPY, QQQ, IWM) and Breadth May 19
The short-term trend remains bullish across all major indices, supported by strong market breadth and price action.
