(All data & visualisations by ChartMill.com)
Daily Market Trend Analysis – May 29, 2025 (After Market Close)
Another boring day for US financial markets.
Initially QQQ gapped up, but during the day the price fell back below resistance, confirming the current double top.
Short Term Trend
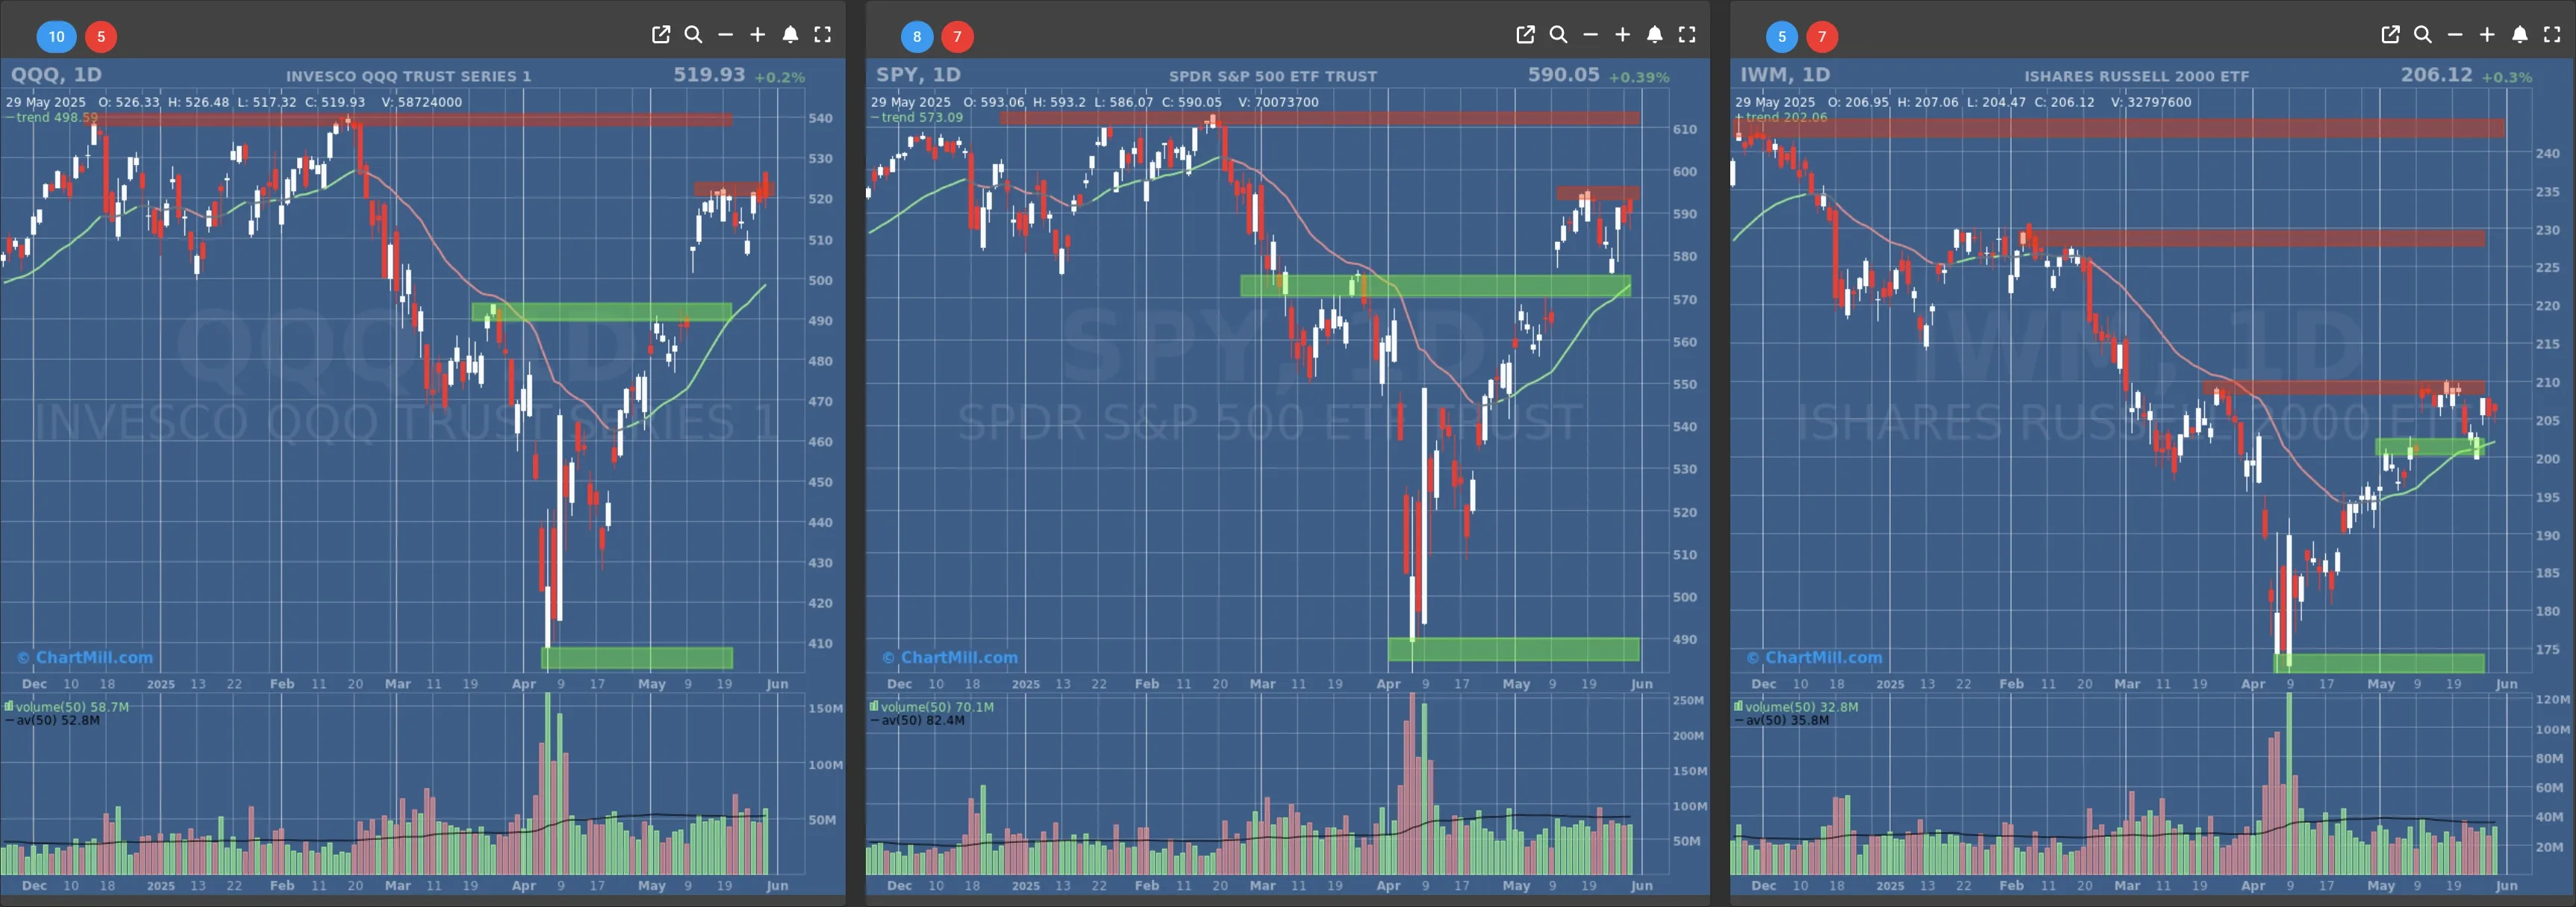
- Short-Term Trend: Bullish (no change)
- Next Support at $570
- Next Resistance at $595
- Volume: Slightly Below Average (50)
- Pattern: Double Top, Down Day
- Short-Term Trend: Bullish (no change)
- Next Support at $490
- Next Resistance at $520
- Volume: Slightly Above Average (50)
- Pattern: Double Top, Down Day
- Short-Term Trend: Bullish (no change)
- Next Support at $200
- Next Resistance at $205 & $210
- Volume: A Average (50)
- Pattern: Doji Candle, Down Day
Long Term Trend
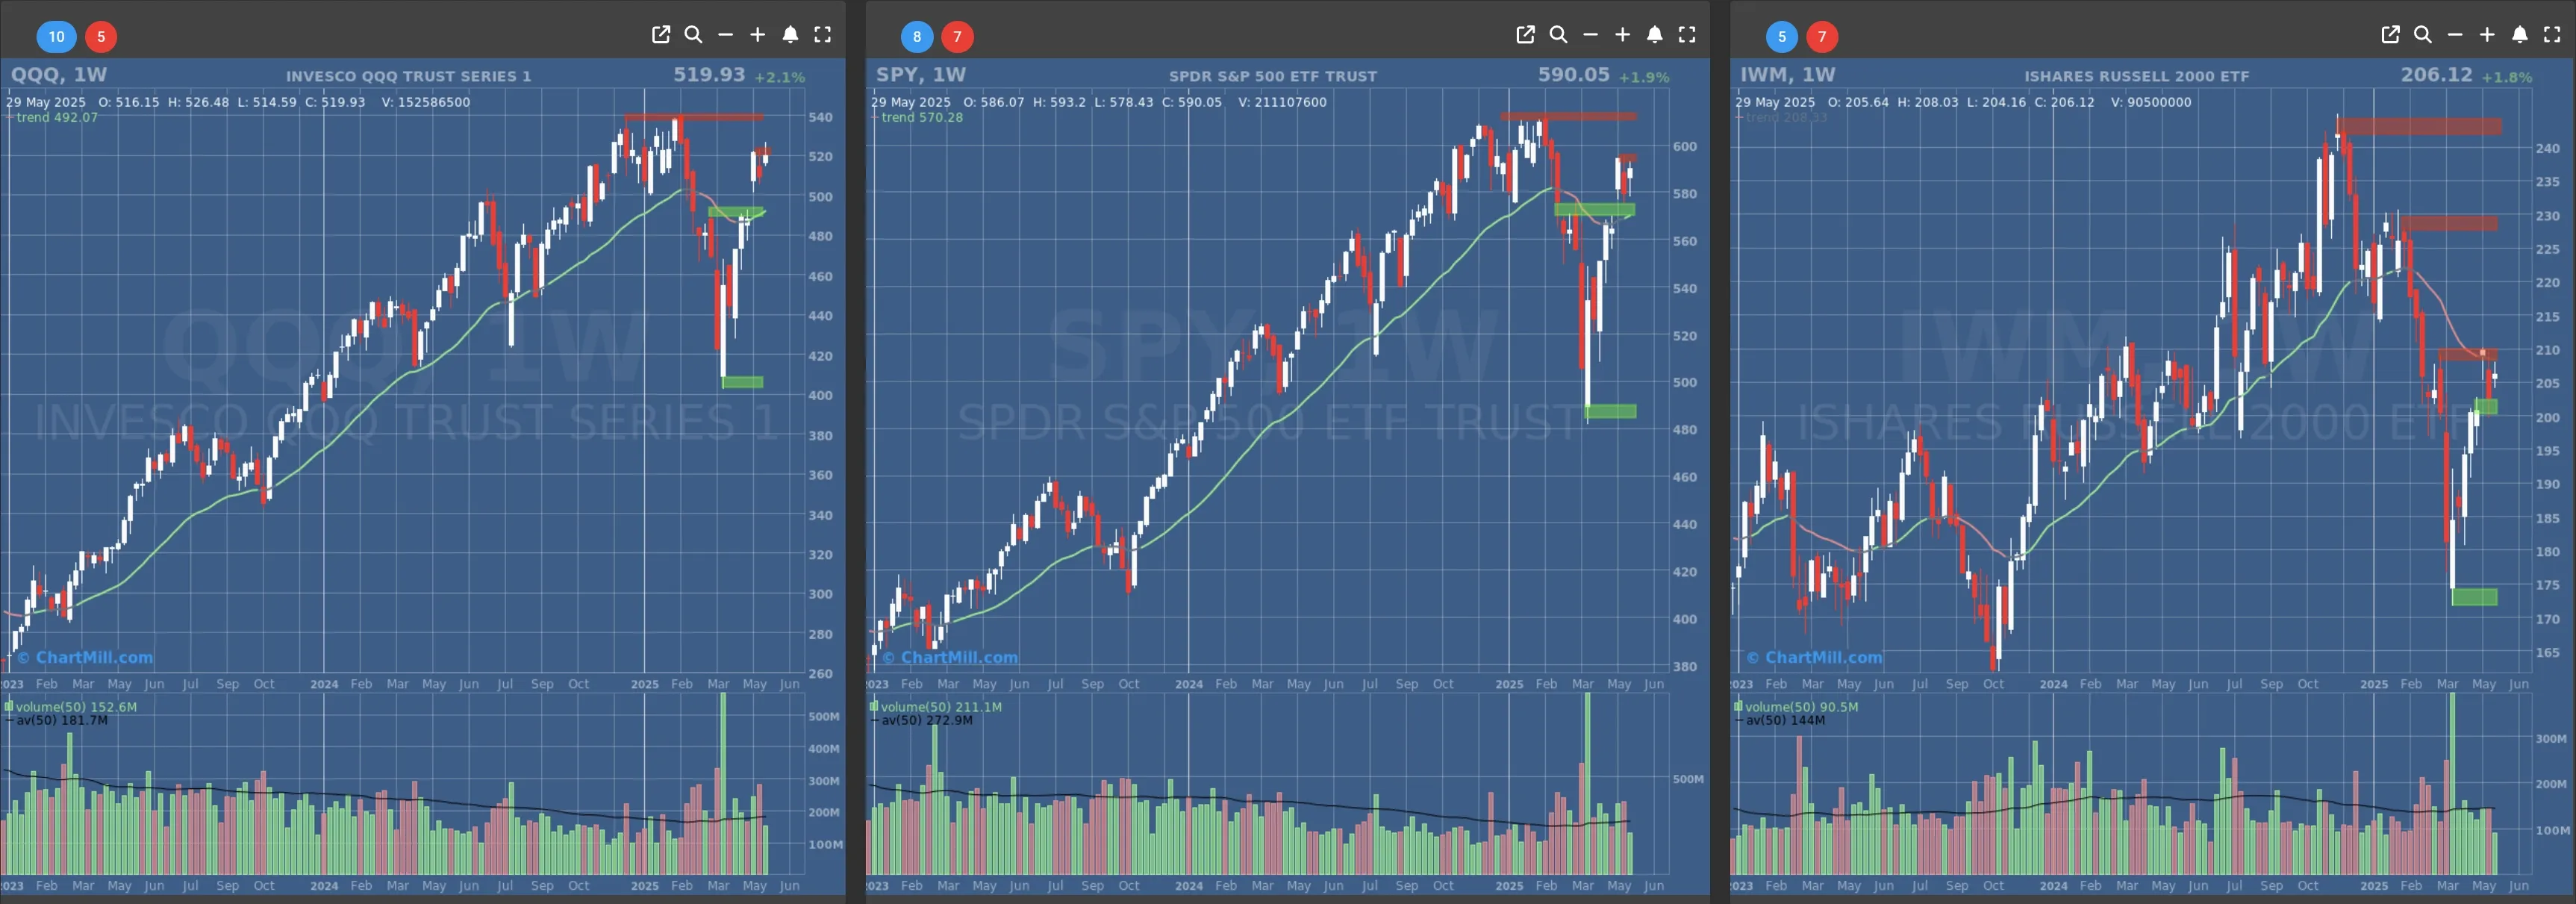
- Long-Term Trend: Preliminary Positive (weekly candle), final result on Friday after market close. (from neutral)
- Long-Term Trend: Positive (no change)
- Long-Term Trend: Neutral (no change)
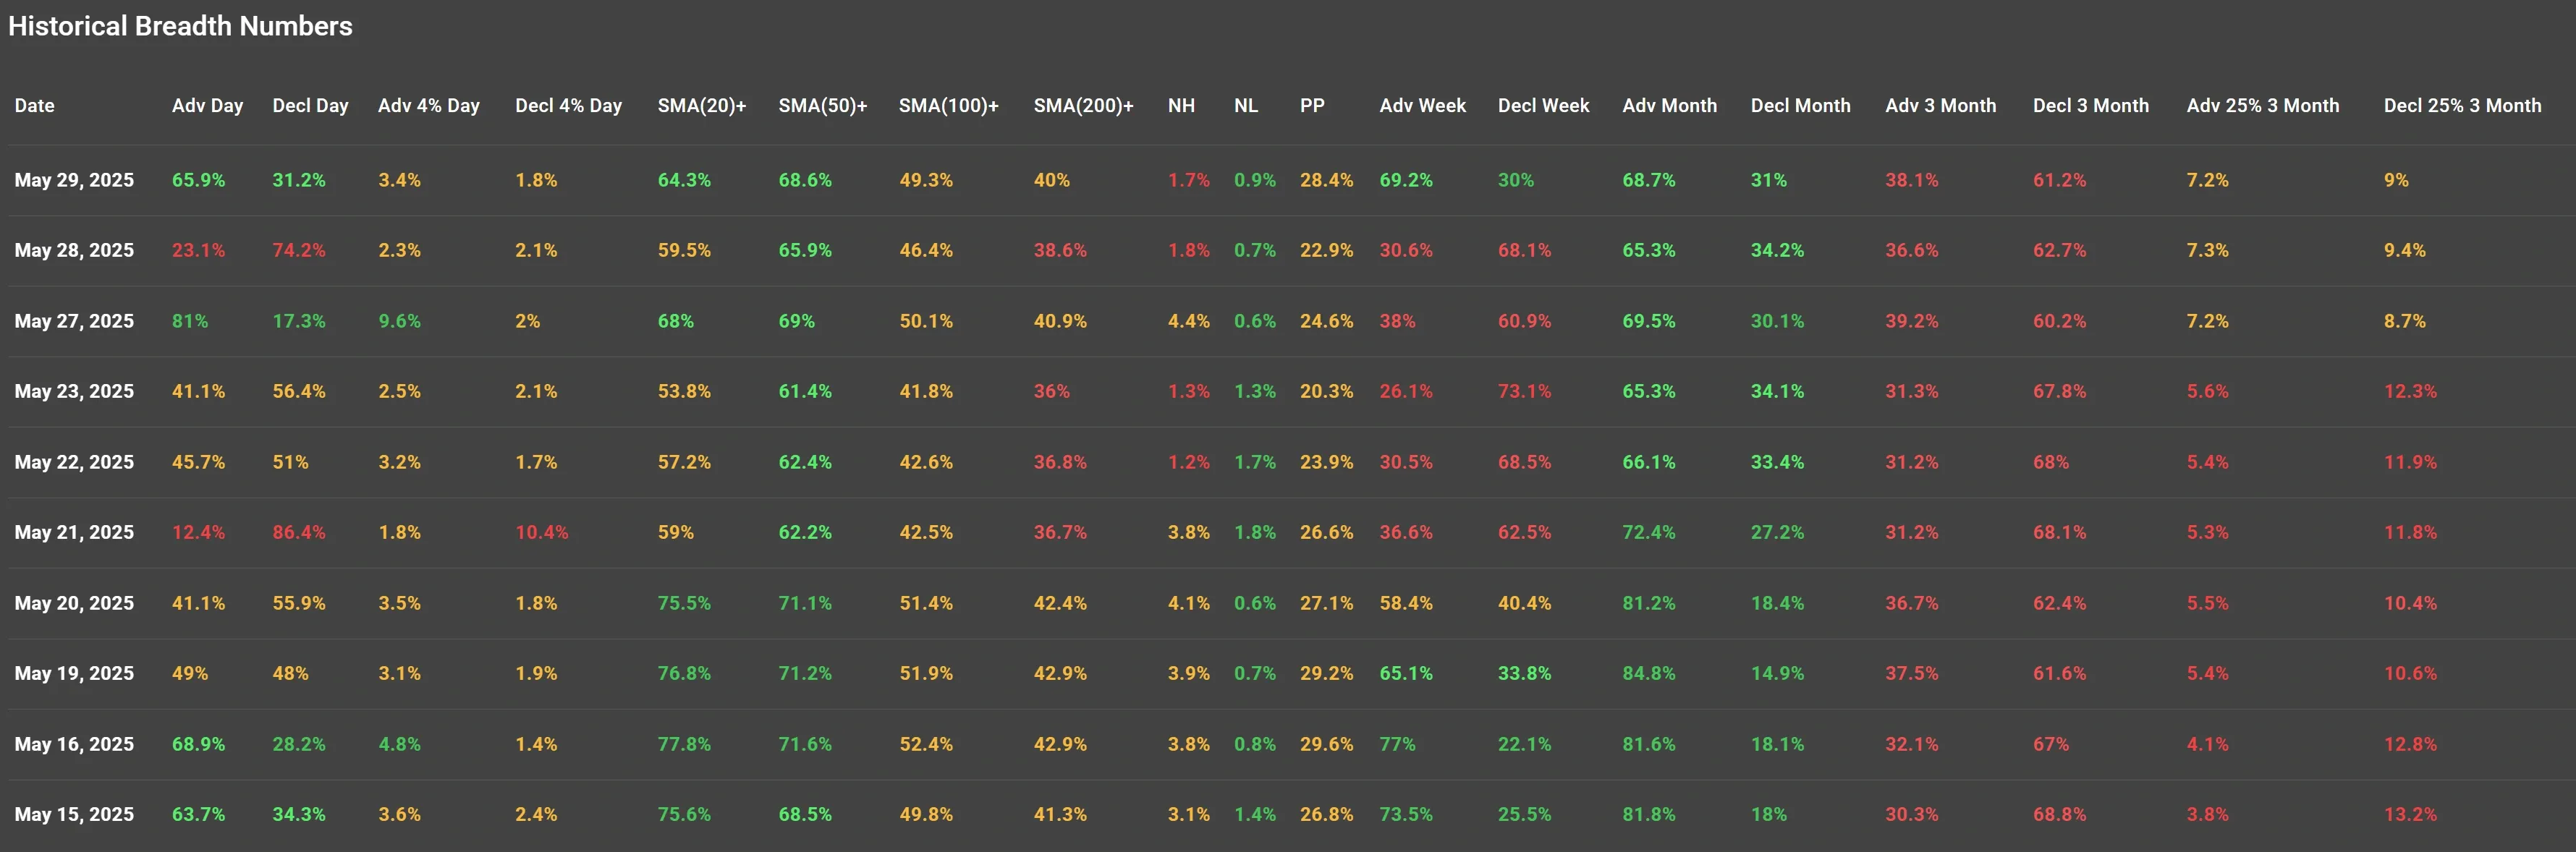
Daily Market Breadth Analysis – May 29, 2025 (After Market Close)
Strong Bullish Turnaround
The market showed significant improvement in breadth on May 29, 2025, reflecting a broad-based rebound after a rough session on May 28:
-
Advancing Stocks (Adv Day): 65.9%
-
Declining Stocks (Decl Day): 31.2%
-
Stocks Advancing >4%: 3.4%
-
Stocks Declining >4%: 1.8%
This bounce from just 23.1% advancers on May 28 highlights a sharp reversal in sentiment, likely driven by investor optimism around earnings (especially Nvidia) and temporary stabilization in tariff-related news.
Short-Term Trend Indicators
The percentage of stocks trading above key moving averages improved on May 29:
-
Above 20-day SMA: 64.3%
-
Above 50-day SMA: 68.6%
-
Above 100-day SMA: 49.3%
-
Above 200-day SMA: 40%
The strong readings for the SMA(20) and SMA(50) show that a majority of stocks are regaining short- and mid-term technical strength, though longer-term (200-day) positioning remains weaker, signaling room for broader recovery.
New Highs vs. New Lows
-
New Highs (NH): 1.7%
-
New Lows (NL): 0.9%
These figures are relatively muted, suggesting that while breadth improved, the move lacked strong leadership from breakout names hitting fresh highs. This reflects tentative buying, possibly driven by short-covering rather than strong conviction.
%Pocket Pivots (PP) and Weekly Breadth
-
%Pocket Pivots: 28.4% (an uptick from 22.9% on May 28)
-
Advancing Stocks (Week): 69.2%
-
Declining Stocks (Week): 30%
This weekly data reinforces the daily trend—bullish momentum is building, with nearly 70% of stocks showing gains over the past 5 sessions.
Monthly Breadth and 3-Month Outlook
Monthly Trends
-
Advancing Stocks (Month): 68.7%
-
Declining Stocks (Month): 31%
The month-to-date strength is decisively positive, indicating sustained accumulation despite short bursts of selling like on May 28.
Three-Month Breadth
-
Adv 3 Month: 38.1%
-
Decl 3 Month: 61.2%
-
Advancing >25% (3M): 7.2%
-
Declining >25% (3M): 9%
The longer-term picture remains less favorable, with more stocks having declined significantly over the last 3 months than those that gained.
This implies that the market may still be in a broader consolidation phase, and recent gains are part of a recovery within a range rather than a confirmed bull trend.
Comparative Highlights – Previous Sessions
May 27, 2025: Market breadth was extremely bullish with 81% advancers and 9.6% of stocks up more than 4%, but this was followed by a sharp pullback on May 28.
May 21, 2025: One of the weakest breadth days, with just 12.4% advancers and 86.4% decliners. Notably, 10.4% of stocks dropped over 4%, marking a capitulation-type day.
These fluctuations underline the fragile and reactive nature of current market sentiment, which continues to be influenced by external macro factors like tariff policy and inflation expectations.
Conclusion: Breadth Suggests Cautious Optimism
The data from May 29, 2025, confirms that market breadth has rebounded significantly, with strong participation and improving technical metrics across shorter moving averages.
Keep it mind that longer-term indicators and muted new highs point to a market still healing from recent selloffs and geopolitical disruptions.
If breadth metrics like SMA(100)+ and SMA(200)+ continue to rise, this could signal the start of a sustained upward trend.
For now, investors may view this rebound as a potential turning point, but confirmation is needed via improved long-term breadth and stronger breakout participation.
- Next to read: Market Monitor News, May 30