(All data & visualisations by ChartMill.com)
Daily Market Trend Analysis – May 16, 2025 (After Market Close)
The short-term trend remains bullish across all major indices, supported by strong market breadth and price action.
Short Term Trend
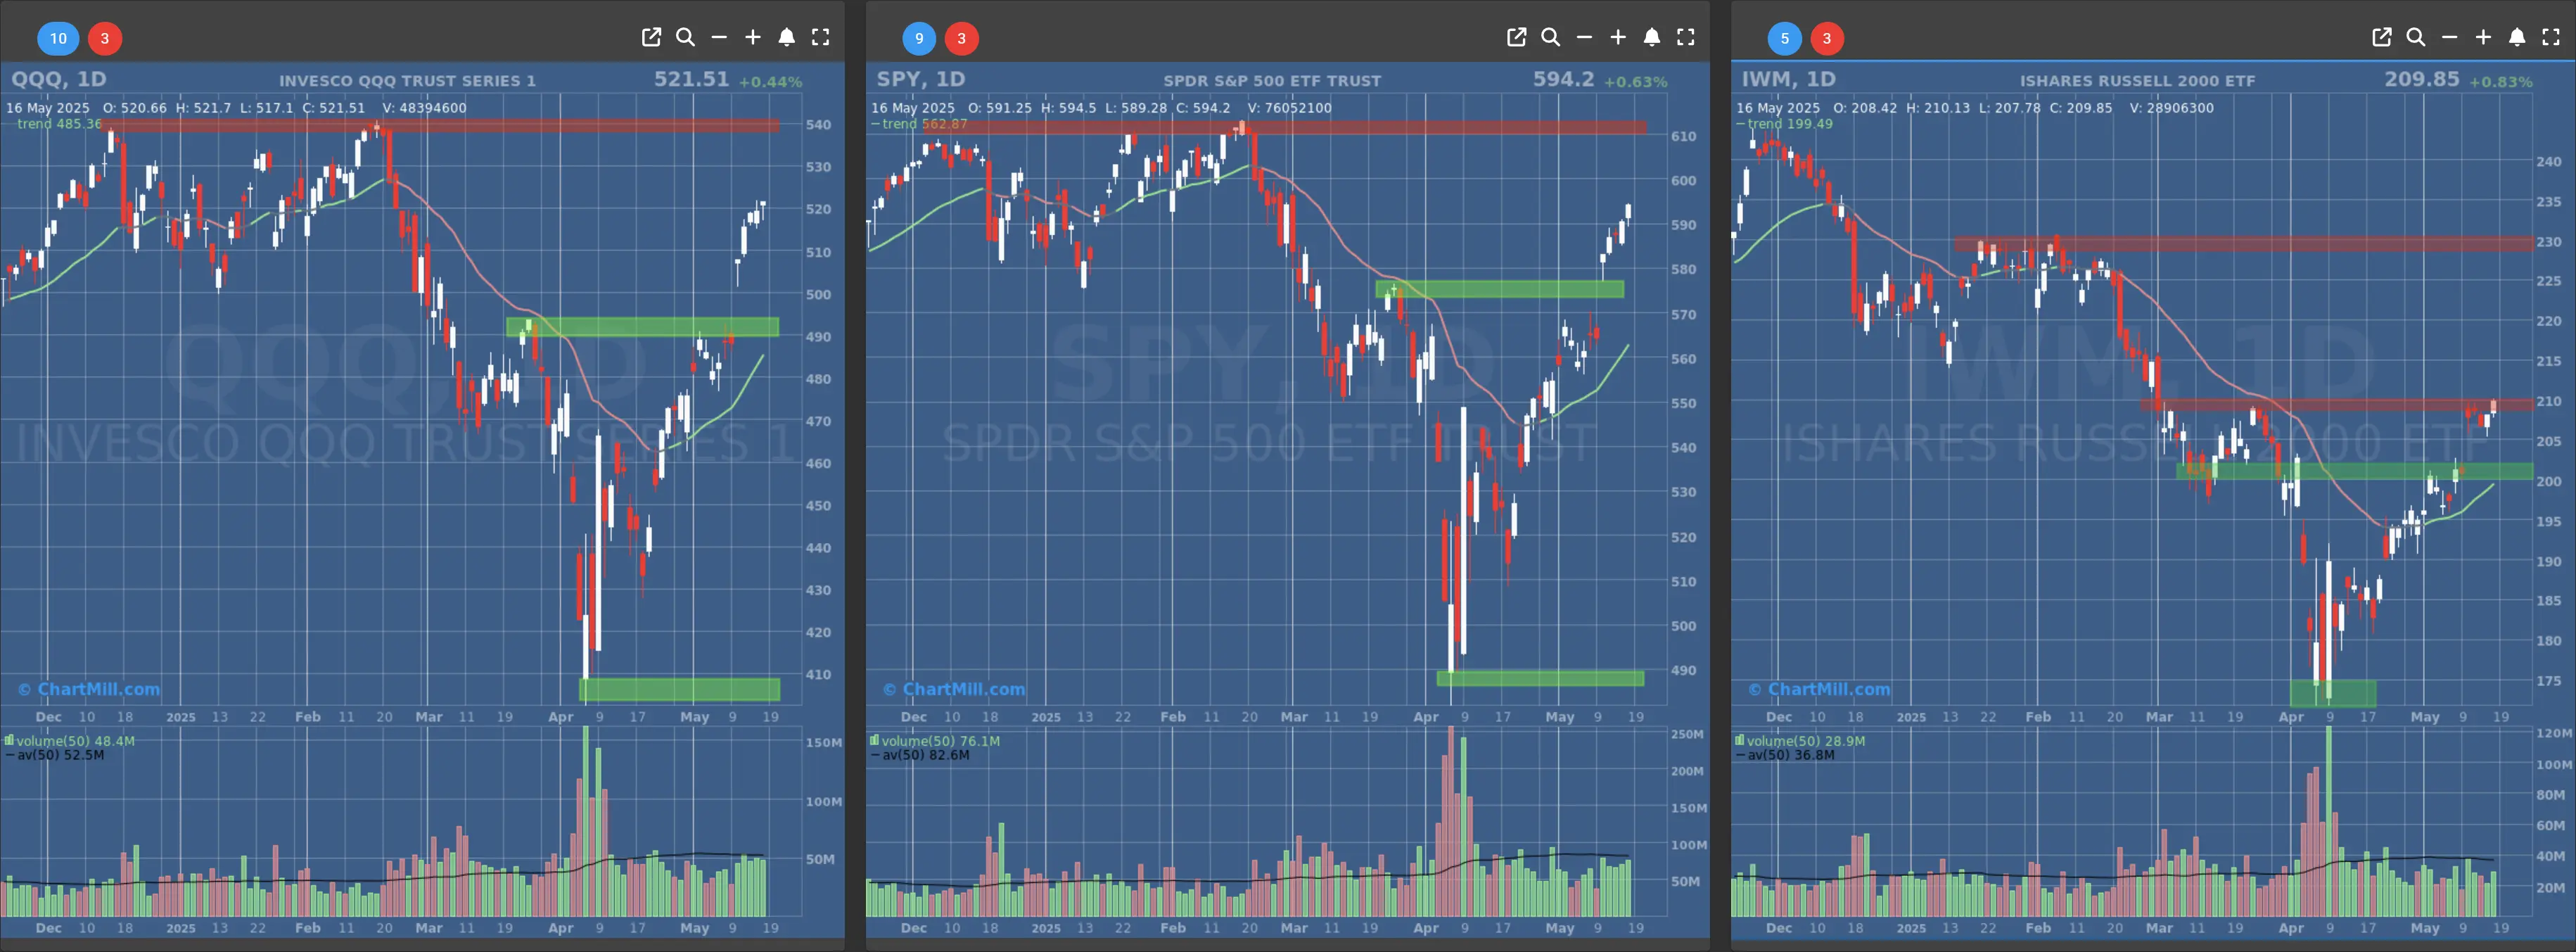
- Short-Term Trend: Bullish (no change)
- Support at $560 - $570
- Resistance at $610
- Volume: At average (50)
- Pattern: Up day
- Short-Term Trend: Bullish (no change)
- Support at $490 - $500
- Resistance at $540
- Volume: At average (50)
- Pattern: Hanging Man Candle
- Short-Term Trend: Bullish (no change)
- Support at $200
- Resistance at $210-215
- Volume: Below average (50)
- Pattern: Up day
Long Term Trend
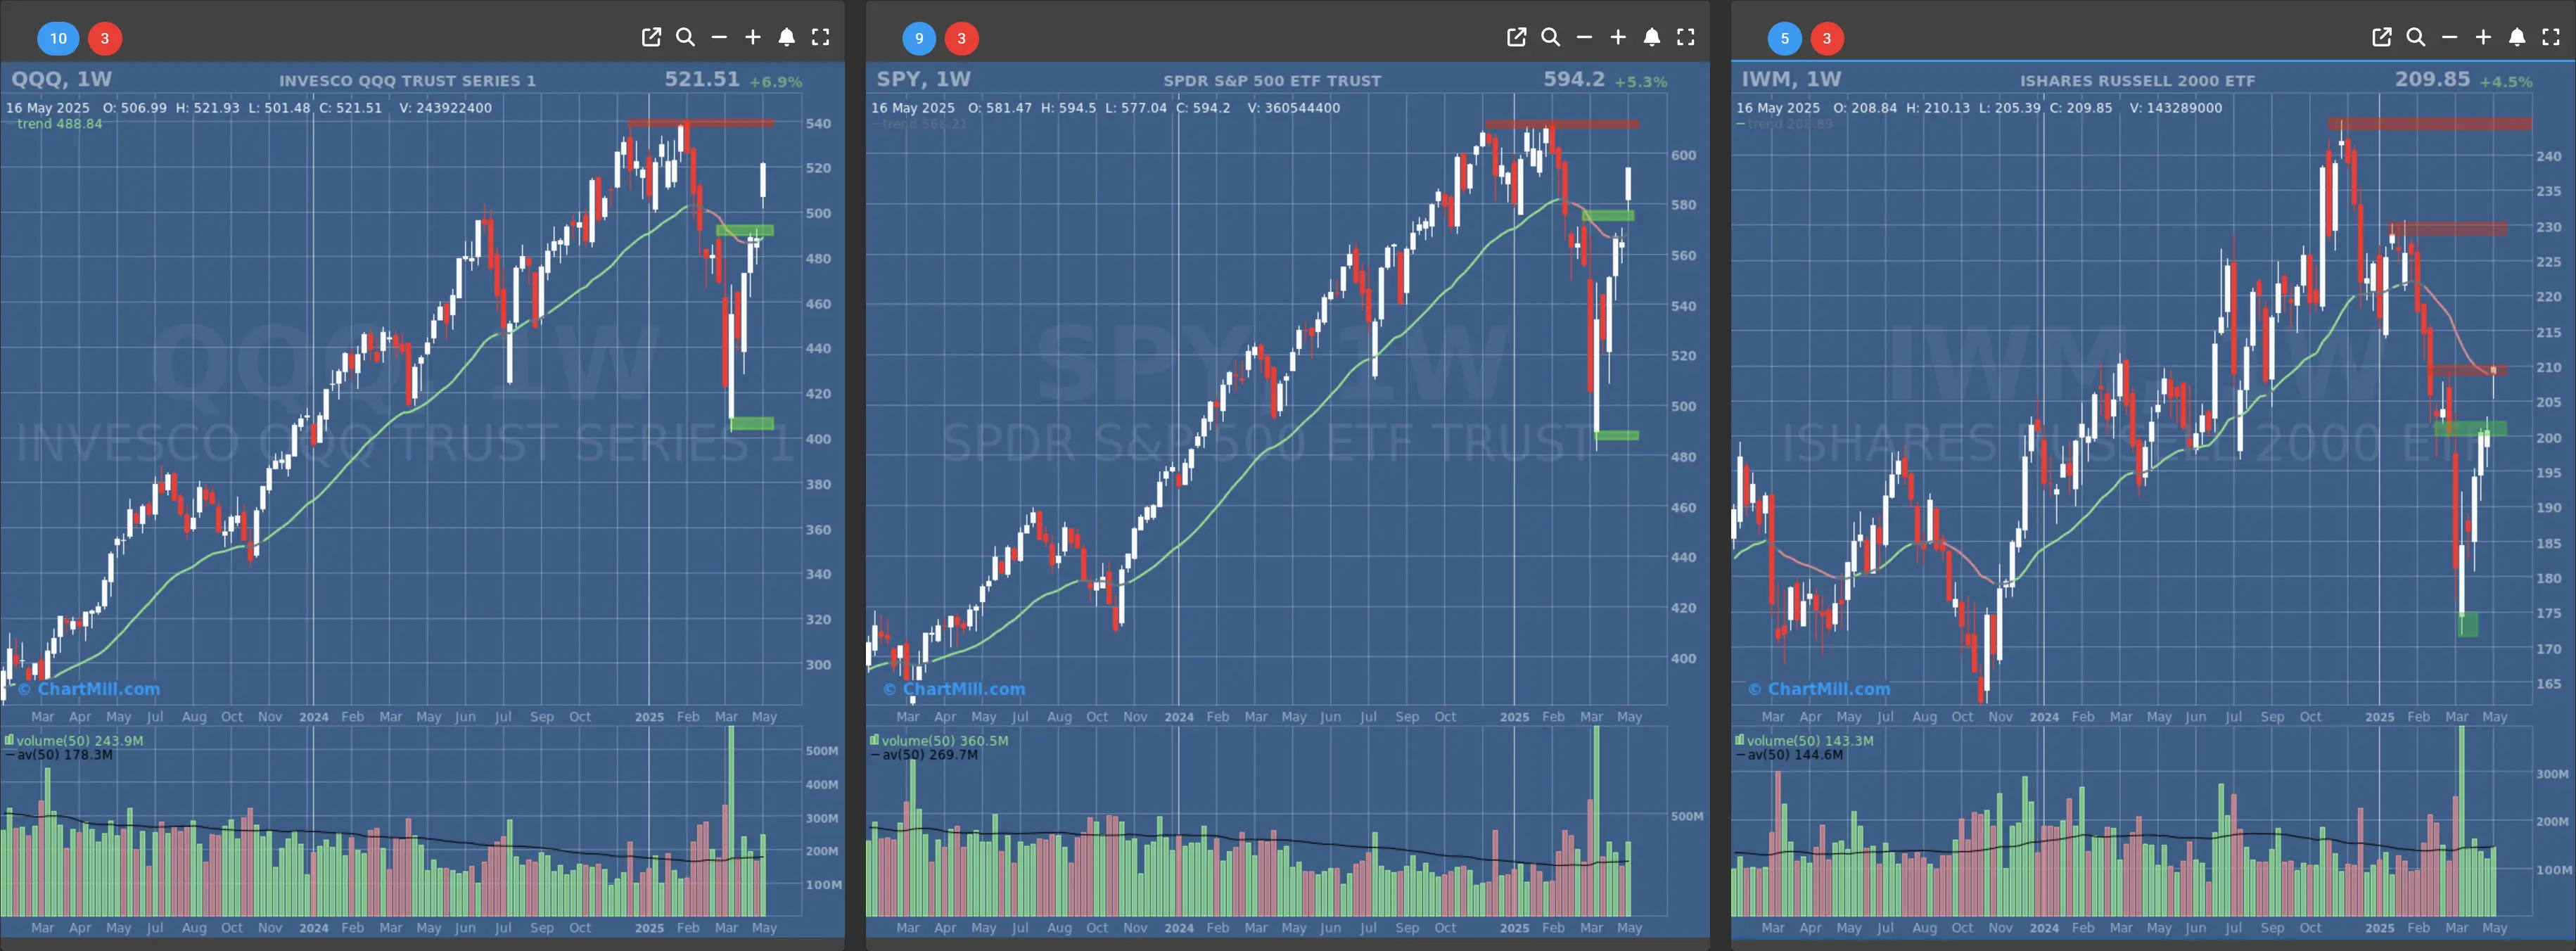
- Long-Term Trend: Neutral (no change)
- Long-Term Trend: Positive (no change)
- Long-Term Trend: Neutral (no change)
Daily Market Breadth Analysis – May 16, 2025 (After Market Close)
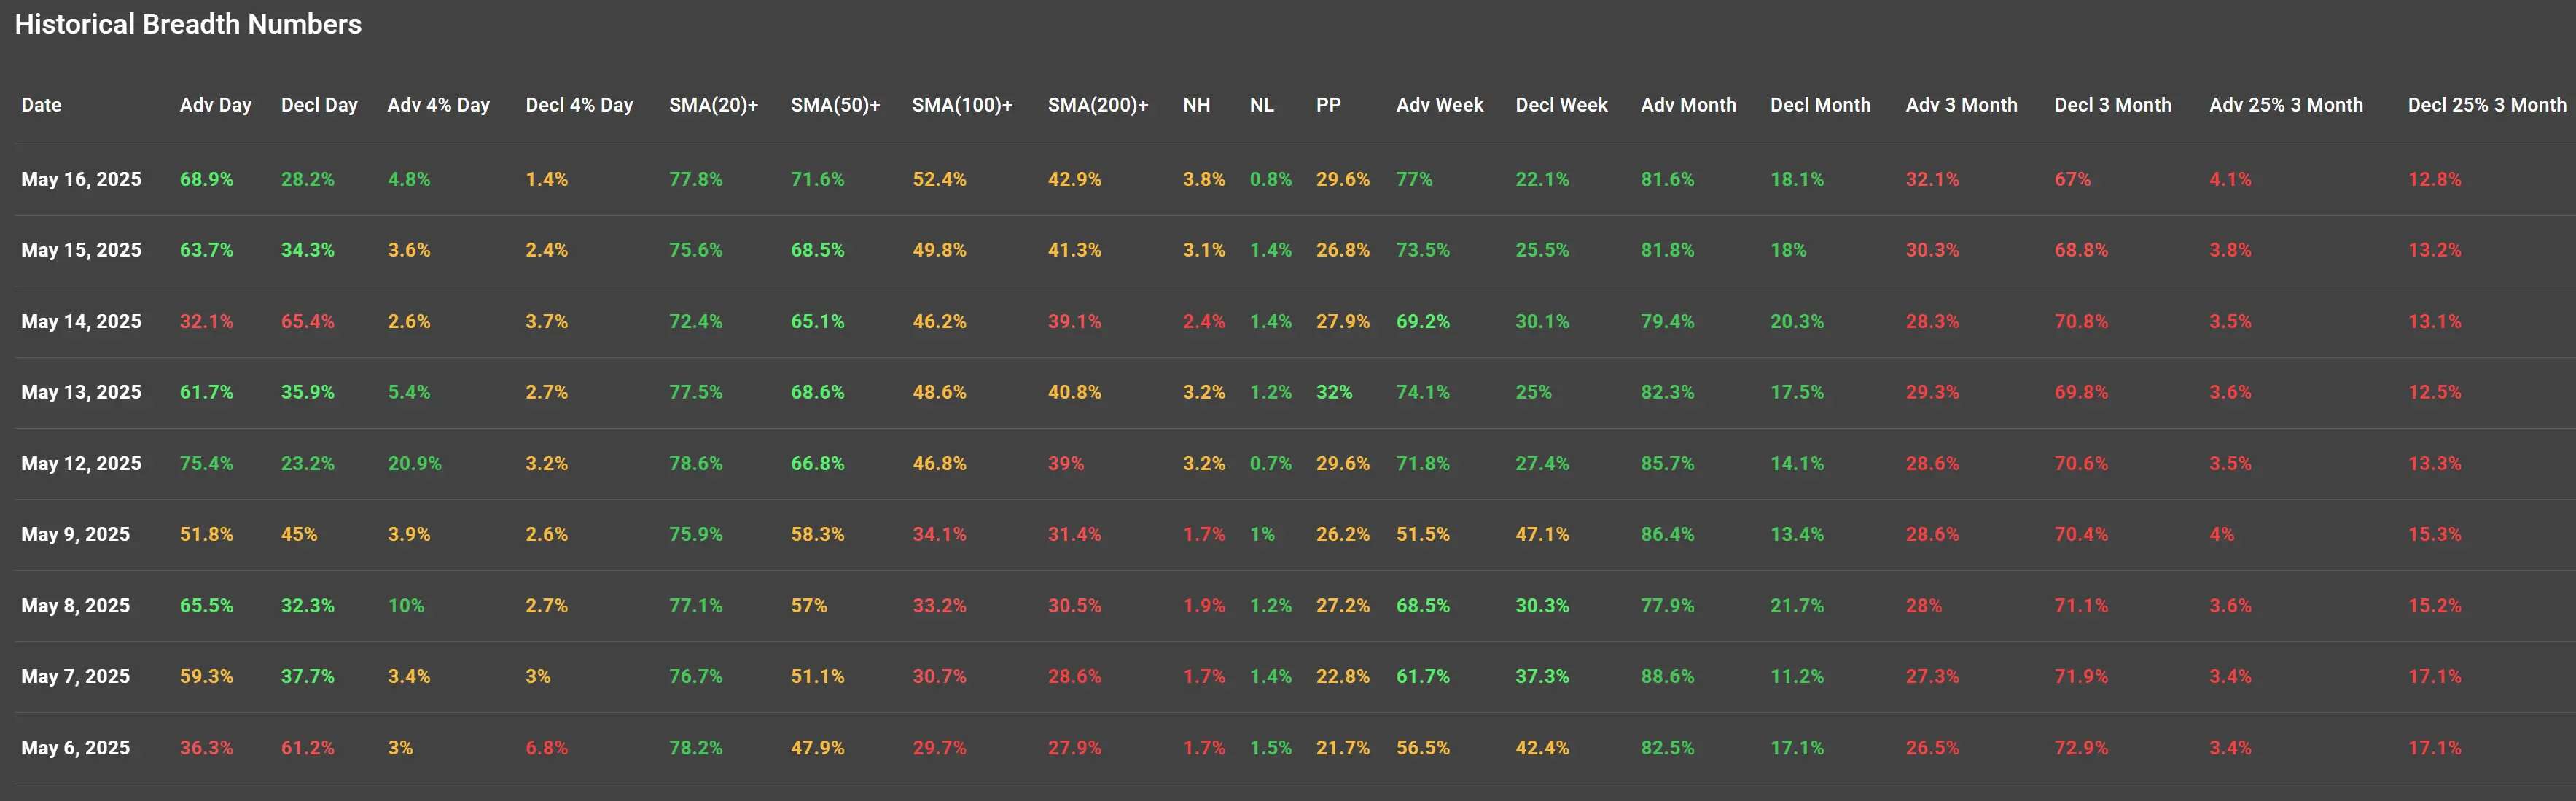
May 12 marked a powerful bullish breadth day with 75.4% advancing stocks, of which 20.9% advanced over 4%, indicating strong upward momentum.
The trend continued through May 16, where 68.9% of stocks advanced, far outweighing the 28.2% declining.
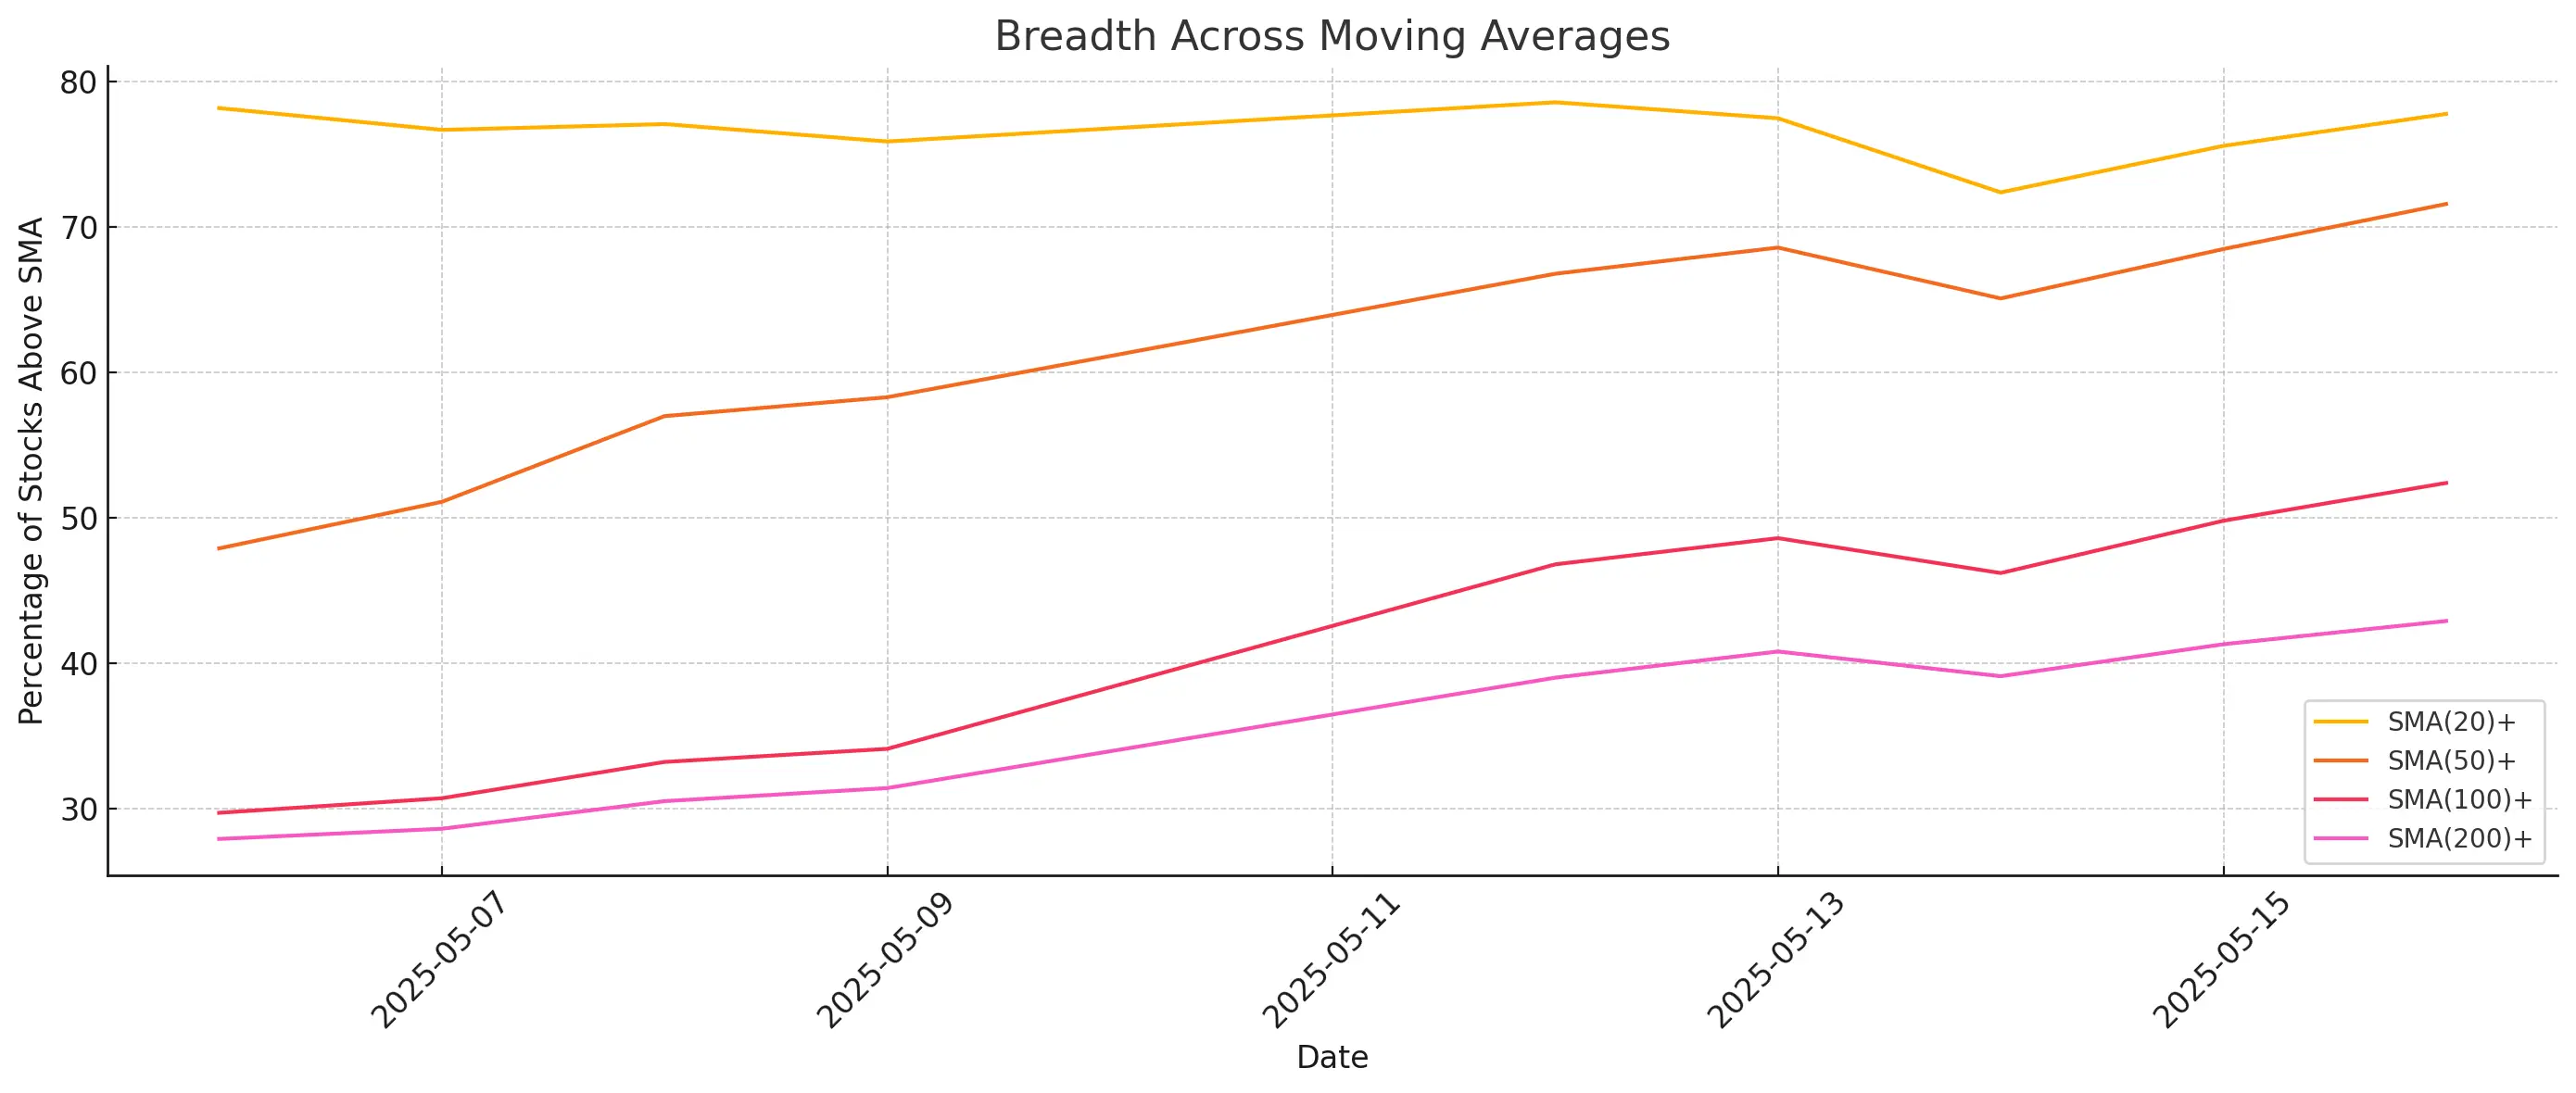
The breadth is confirmed by a consistent rise in stocks above key moving averages:
-
SMA(20): 77.8%
-
SMA(50): 71.6%
-
SMA(100): 52.4%
-
SMA(200): 42.9%
Intermediate Trends:
The weekly advance-decline trend shows that advancing stocks have reclaimed control:
-
From May 6–9, advancers hovered near 50–60%.
-
From May 12 onwards, weekly advancers surged above 70%.
New Highs vs. New Lows (NH/NL):
-
A subtle but steady increase in New Highs (NH) from 1.7% (May 6) to 3.8% (May 16).
-
New Lows (NL) remain minimal, dropping to 0.8% on May 16.
Market Interpretation
The market breadth data from May 6 to May 16, 2025, reflects a clear shift toward bullish momentum.
After brief weakness around May 6 and May 14, the majority of stocks have resumed upward movement with strong participation across multiple timeframes. The increasing number of stocks above key moving averages, rising new highs, and solid weekly breadth figures all confirm broad internal market strength.
The rally is not just driven by a few large caps—it is broad-based and gaining momentum, this is a constructive environment for short- to mid-term traders and trend followers.