
(All data & visualisations by ChartMill.com)
Daily Market Trend Analysis – May 23, 2025 (After Market Close)
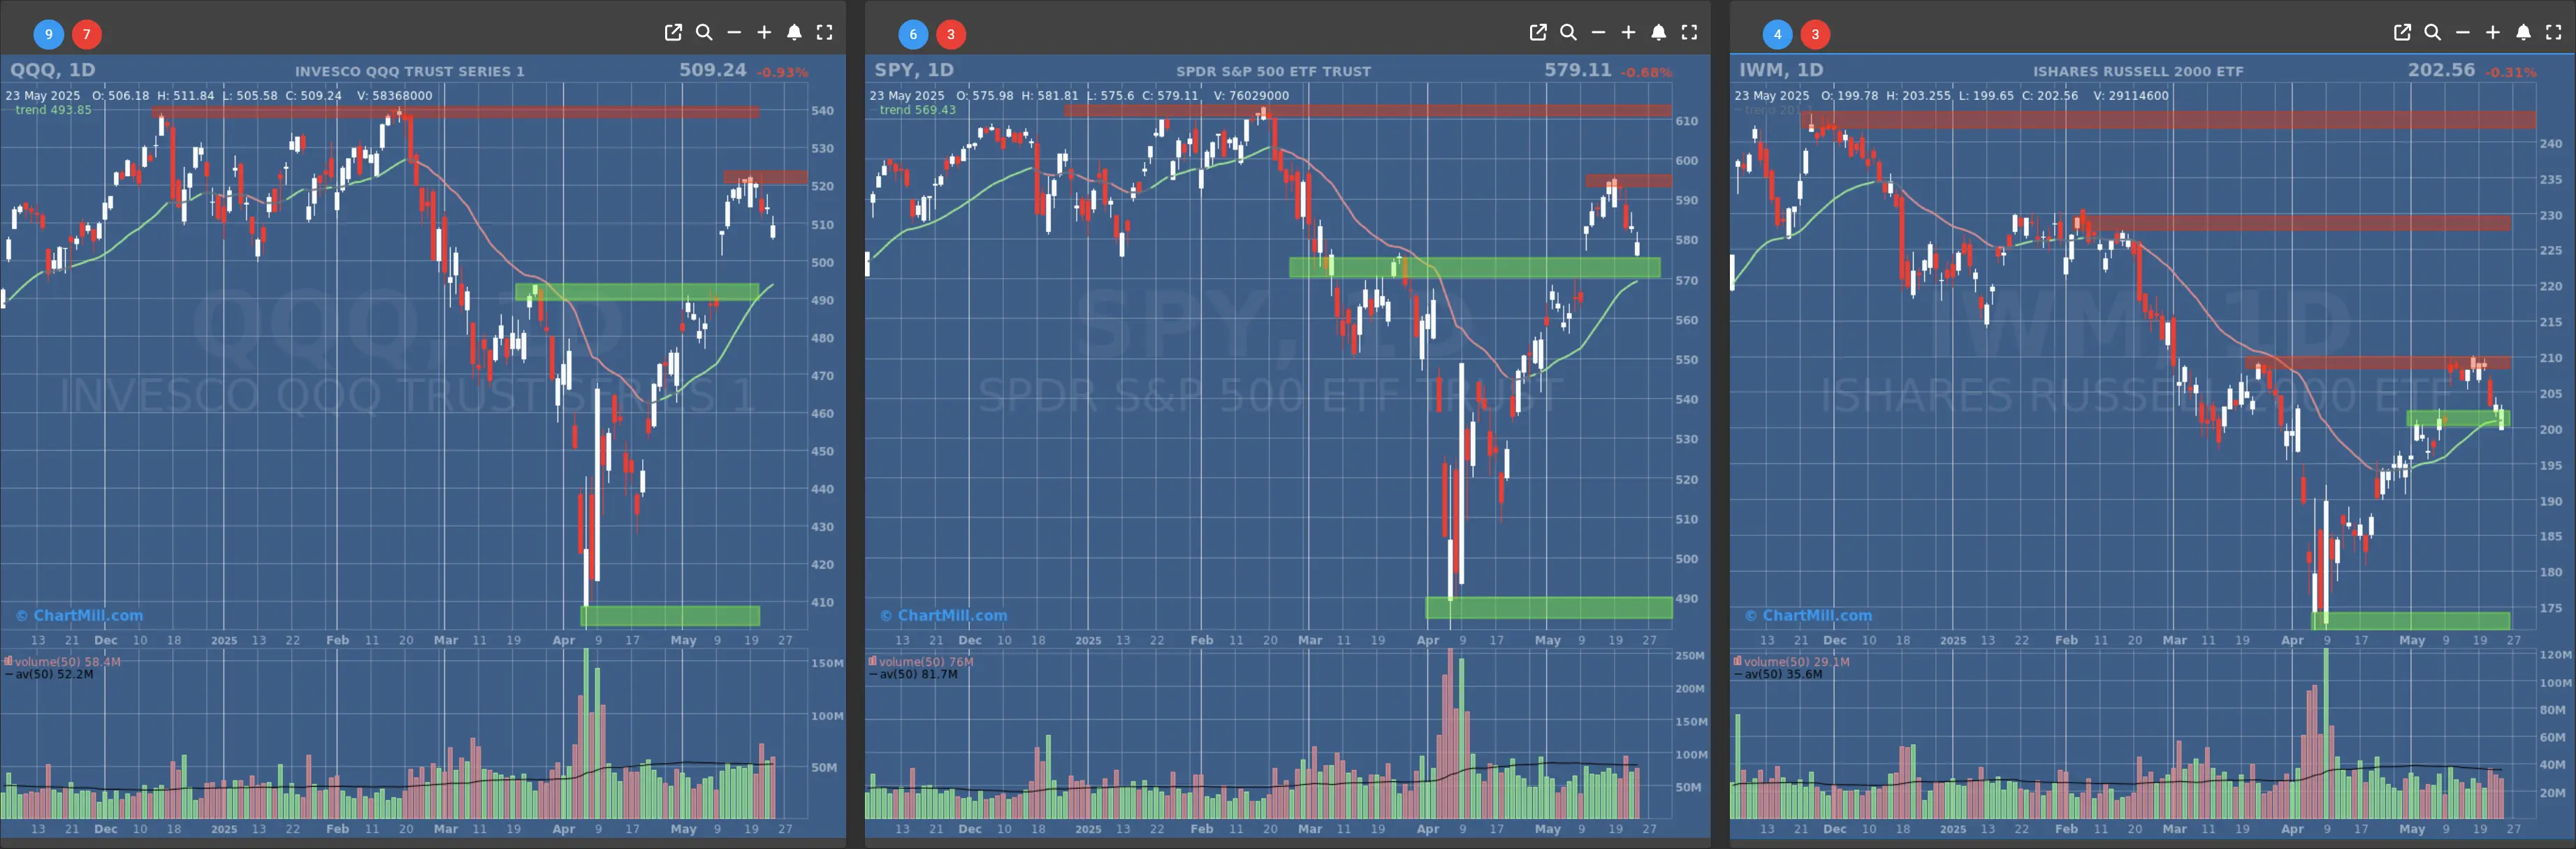
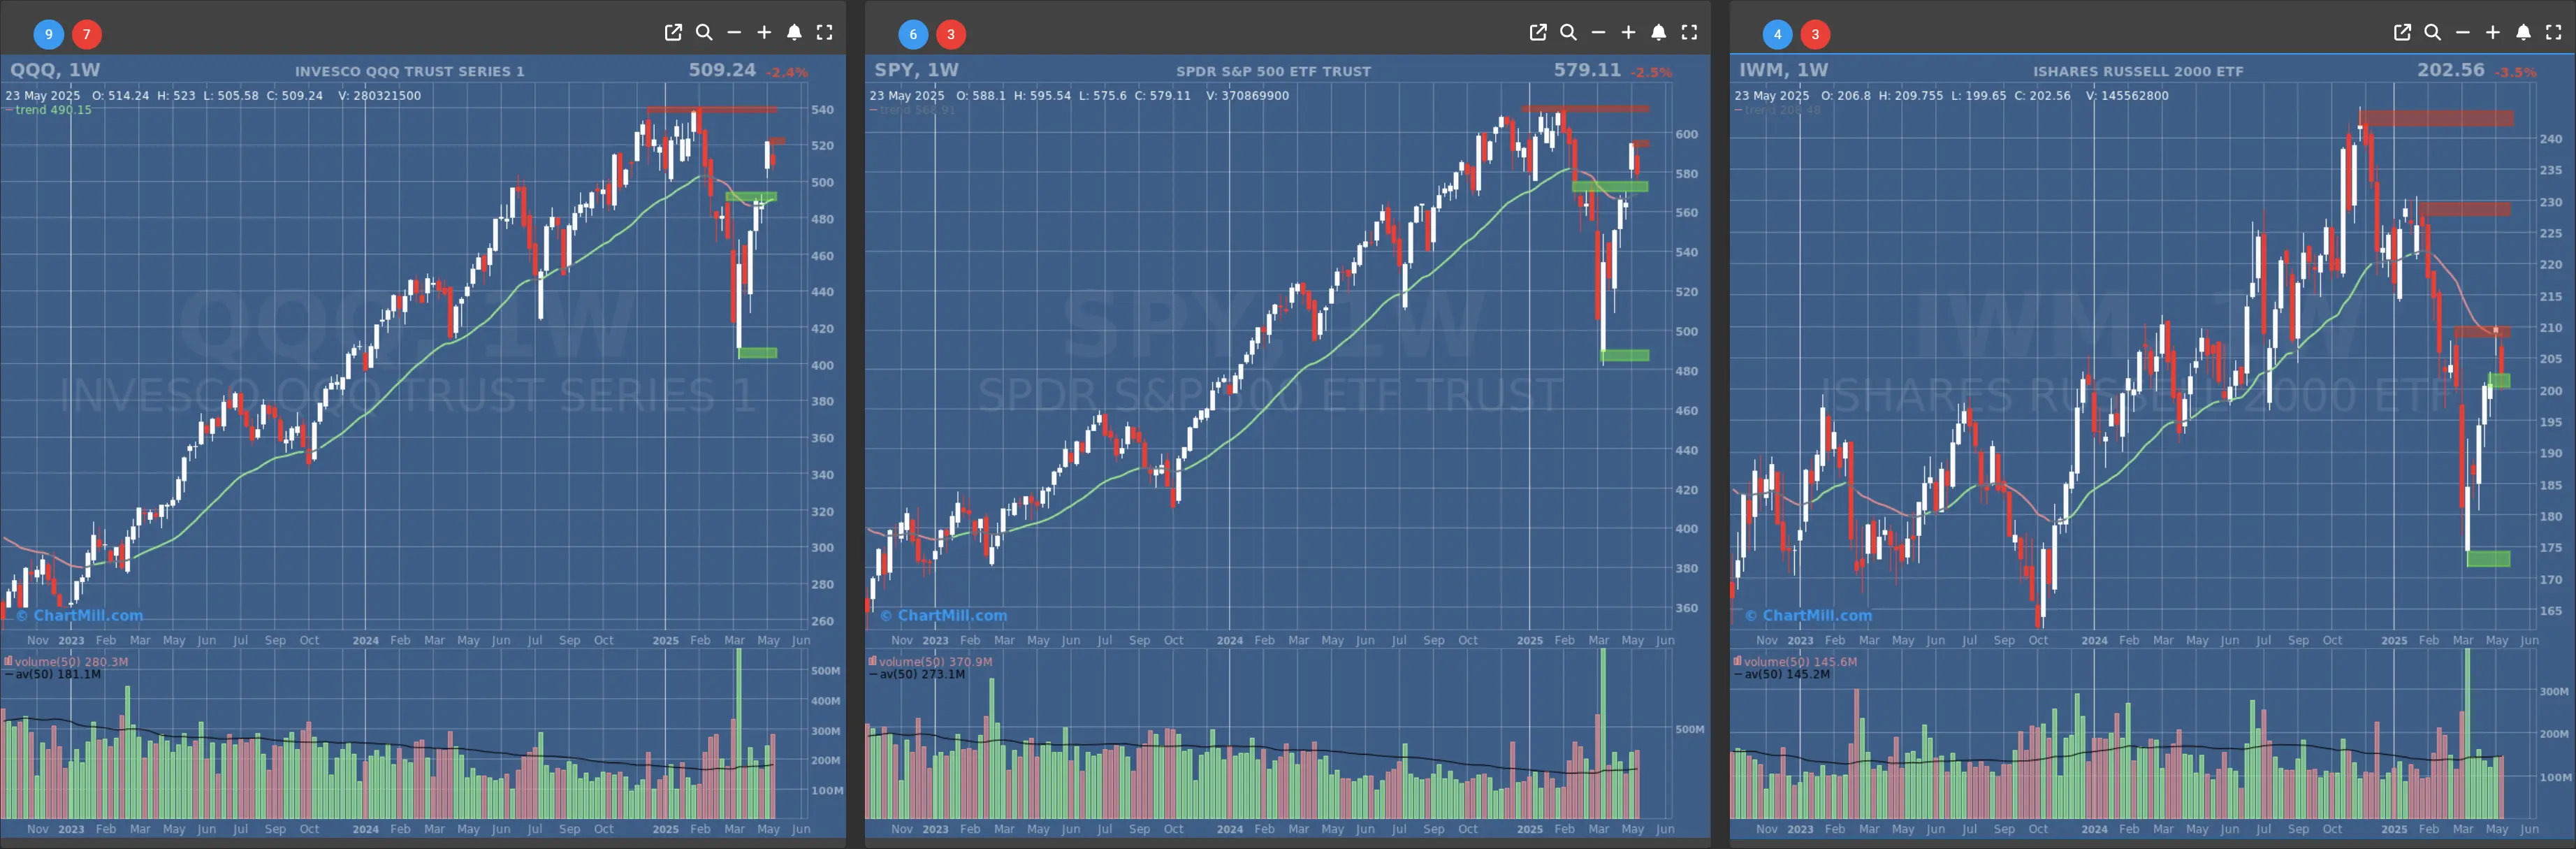
All three indices are facing resistance zones and showing short-term weakness, but key support levels are nearby. A hold at support could set the stage for another attempt higher.
Short Term Trend
- Short-Term Trend: Bullish (no change)
- Next Support at $570
- Next Resistance at $595
- Volume: At Average (50)
- Pattern: /
- Short-Term Trend: Bullish (no change)
- Next Support at $490
- Next Resistance at $520
- Volume: Slightly Above Average (50)
- Pattern: /
- Short-Term Trend: Bullish (no change)
- Next Support at $200
- Next Resistance at $205 & $210
- Volume: Slightly Below Average (50)
- Pattern: /
Long Term Trend
- Long-Term Trend: Neutral (no change)
- Long-Term Trend: Positive (no change)
- Long-Term Trend: Neutral (no change)
Daily Market Breadth Analysis – May 23, 2025 (After Market Close)

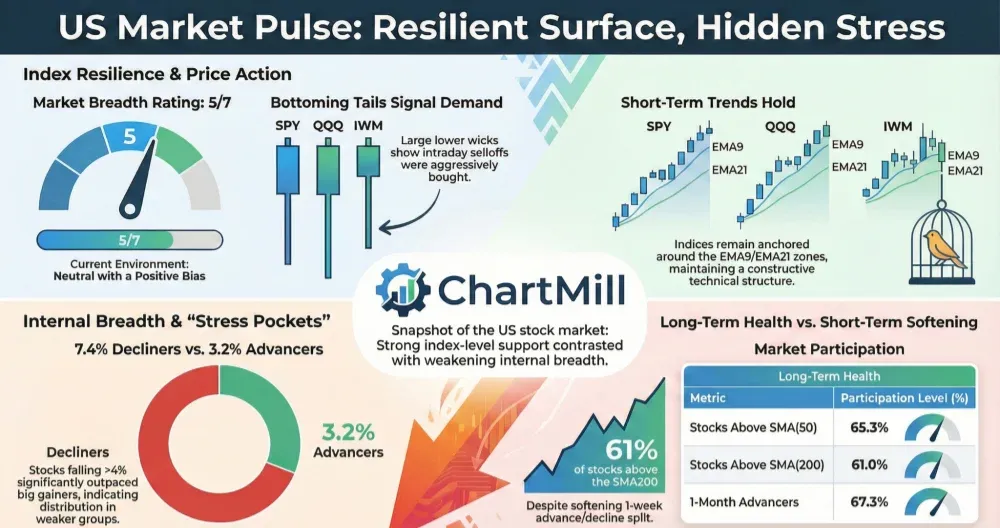
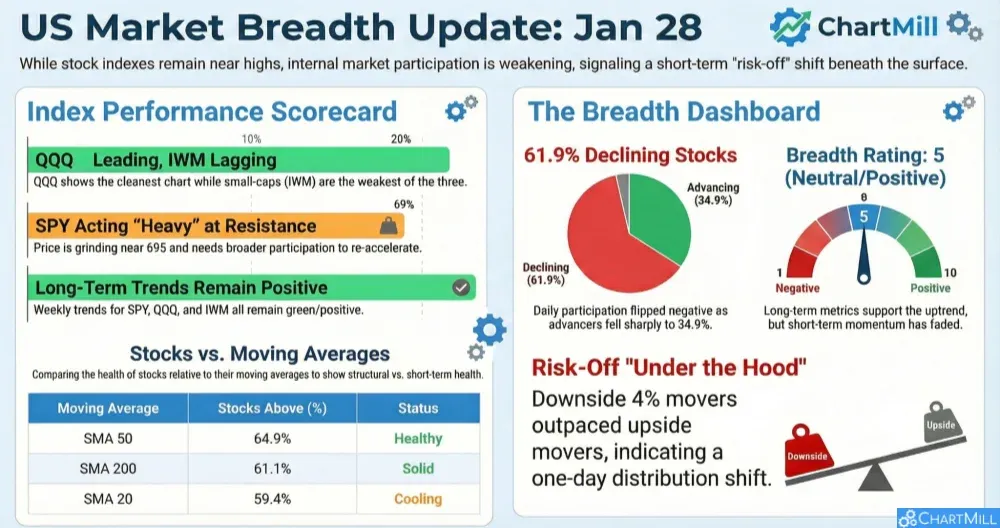
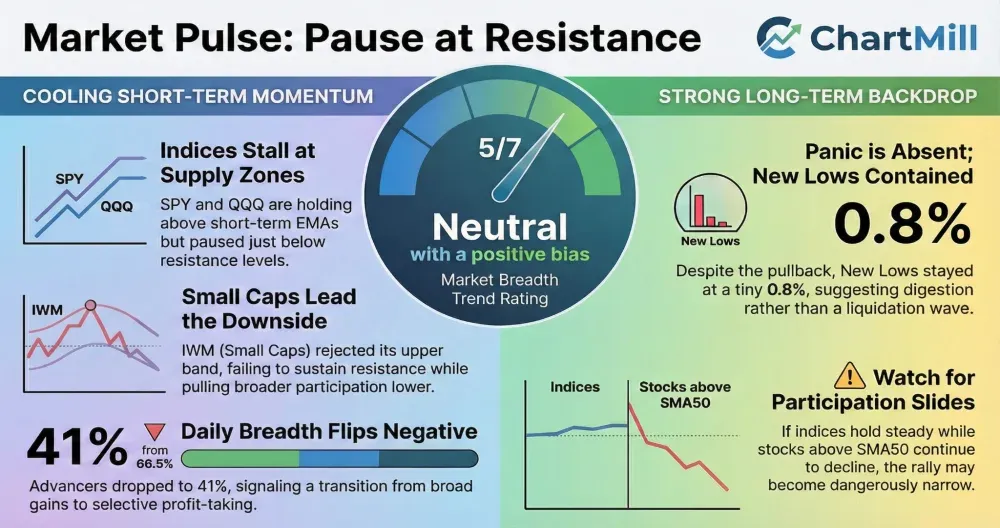
Short-Term Weakness Intensifies
Market breadth has shown a notable deterioration over the past week. On May 21, just 12.4% of stocks had an up day, while a staggering 86.4% declined.
This marks the weakest single-day breadth in this two-week period. Though breadth slightly recovered afterward, the final trading day (May 23) still showed 56.4% declining versus 41.1% advancing—indicating that sellers remain in control.
Underlying Strength Is Slipping
While daily moves offer insight into short-term sentiment, the percentage of stocks above their 50-day and 200-day SMAs offers a look under the hood:
-
The number of stocks above their 50-day SMA has fallen from 71.6% on May 16 to 61.4% on May 23.
-
Similarly, stocks above their 200-day SMA dropped from 42.9% to 36% in that same period.
This divergence suggests internal market weakness is growing, even if headline indices might not fully reflect it yet.
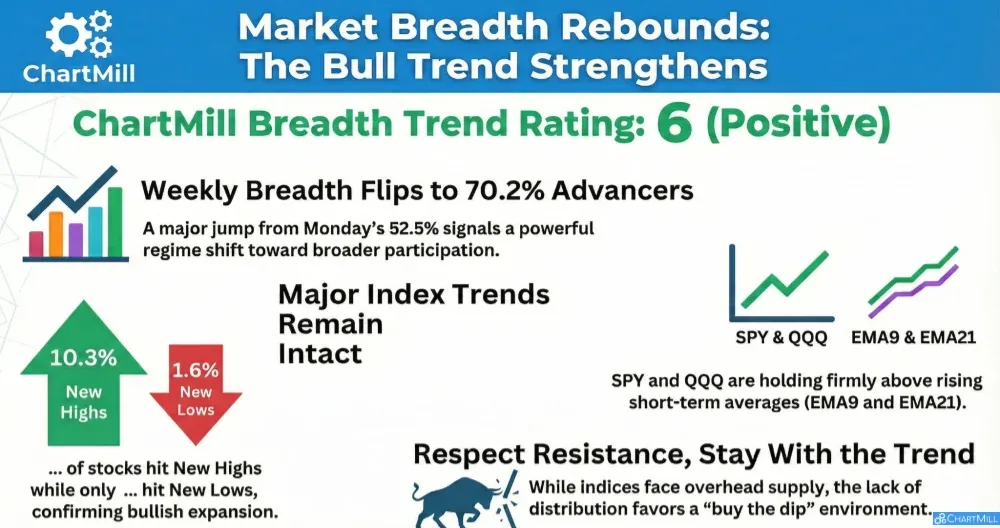
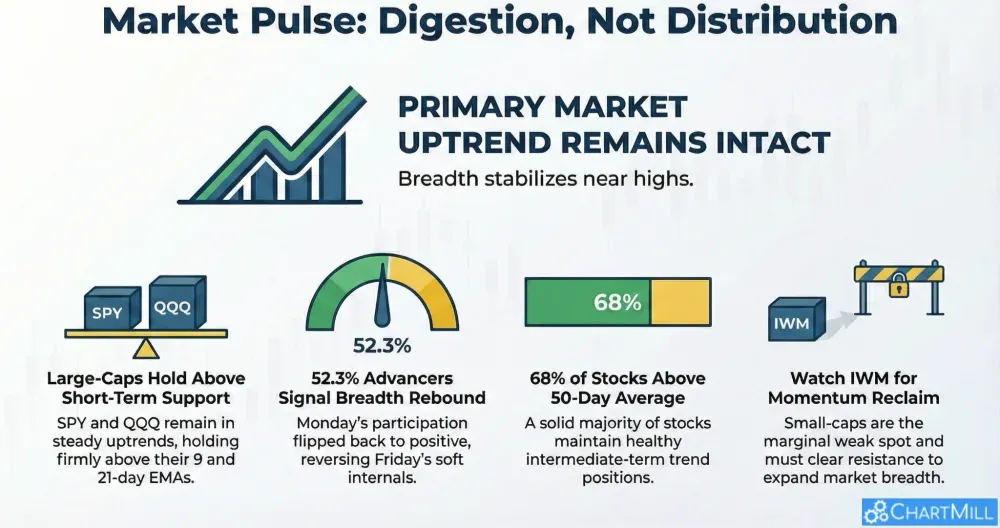
Broader Trend Metrics Still Resilient (For Now)
Despite the daily selling pressure, longer-term breadth metrics haven’t collapsed:
-
The monthly advancing average remains strong at 65.3% but keep in mind that this number is down from 85.7% on May 12, hinting at a slow rollover in longer-term momentum.
-
On a three-month scale, the number of stocks that are up 25% or more is just 5.6%, while 12.3% are down 25% or more, indicating that downside outliers are more common right now.
Conclusion: Watch for a Breadth-Driven Breakdown
The data show a market that is weakening internally, with fewer stocks supporting any upside and an increasing tilt toward broad-based selling.
Unless we see a sharp reversal in participation (i.e., more stocks reclaiming their 50- and 200-day SMAs), risks remain skewed to the downside.
Key Takeaways:
-
Market breadth collapsed mid-week (especially May 21), fewer stocks are trading above key moving averages.
-
Short-term pressure is evident; medium-term trend is beginning to erode.
Next to read: Market Monitor News, May 26