News Image

Market Monitor Trends (SPY, QQQ, IWM) and Breadth May 28

By Kristoff De Turck - reviewed by Aldwin Keppens

Last update: May 28, 2025

ChartMill Market Monitor Report Trends and Breadth

(All data & visualisations by ChartMill.com)

Daily Market Trend Analysis – May 27, 2025 (After Market Close)

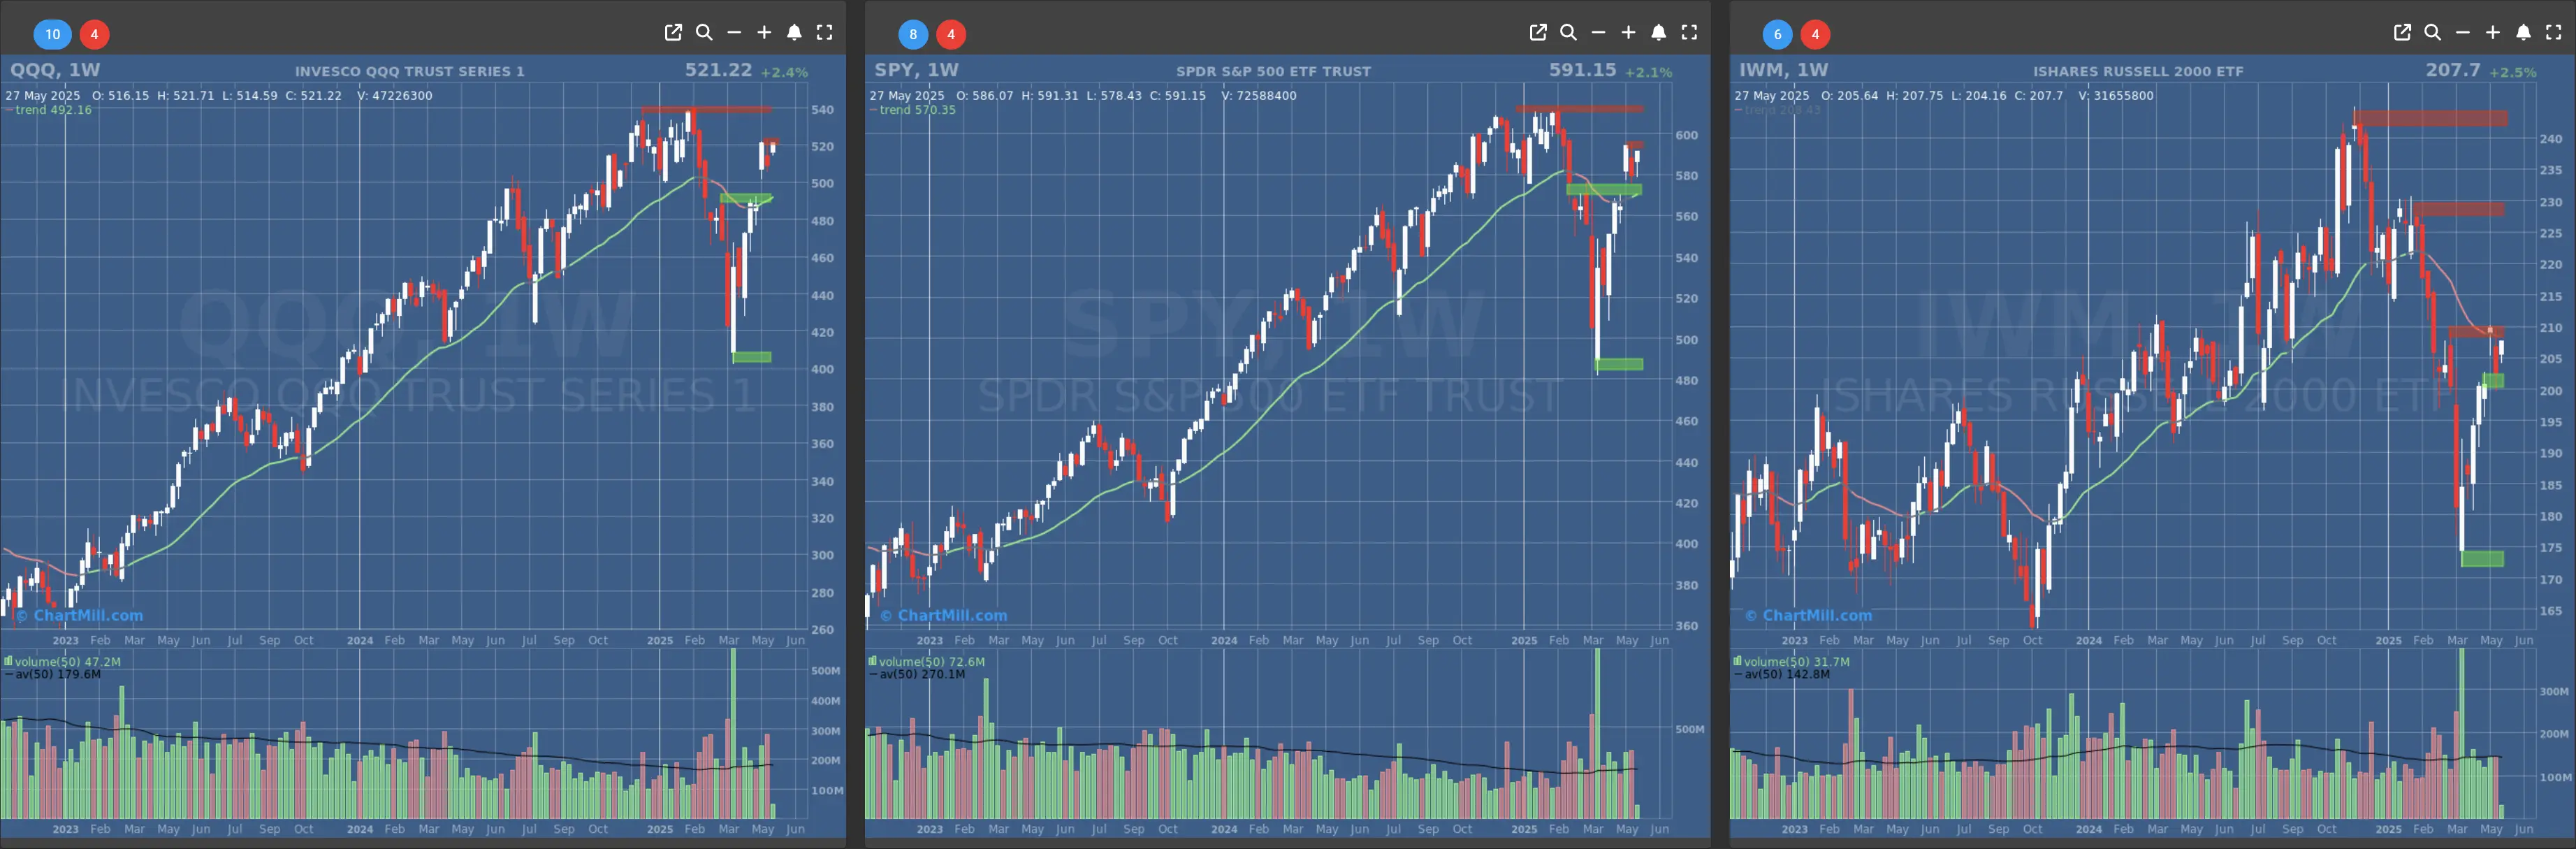
Strong recovery for the three US index ETFs after the extended Memorial Day weekend. All three are now quoting close to their next major resistance.

Once that hurdle is cleared, the all time high is in sight for the $SPY and $QQQ.

Short Term Trend

ChartMill US Indices Performance daily

SPY (S&P 500 ETF)

  • Short-Term Trend: Bullish (no change)
  • Next Support at $570
  • Next Resistance at $595
  • Volume: At Average (50)
  • Pattern: Gap Up

QQQ (Nasdaq-100 ETF)

  • Short-Term Trend: Bullish (no change)
  • Next Support at $490
  • Next Resistance at $520
  • Volume: At Average (50)
  • Pattern: Gap Up

IWM (Russell 2000 ETF)

  • Short-Term Trend: Bullish (no change)
  • Next Support at $200
  • Next Resistance at $205 & $210
  • Volume: At Average (50)
  • Pattern: Gap Up

Long Term Trend

ChartMill US Indices Performance weekly

SPY (S&P 500 ETF)

  • Long-Term Trend: Preliminary Positive (weekly candle), final result on Friday after market close. (from neutral)

QQQ (Nasdaq-100 ETF)

  • Long-Term Trend: Positive (no change)

IWM (Russell 2000 ETF)

  • Long-Term Trend: Neutral (no change)

Daily Market Breadth Analysis – May 27, 2025 (After Market Close)

ChartMill US Indices Performance weekly

Signs of Strength Return to the Market

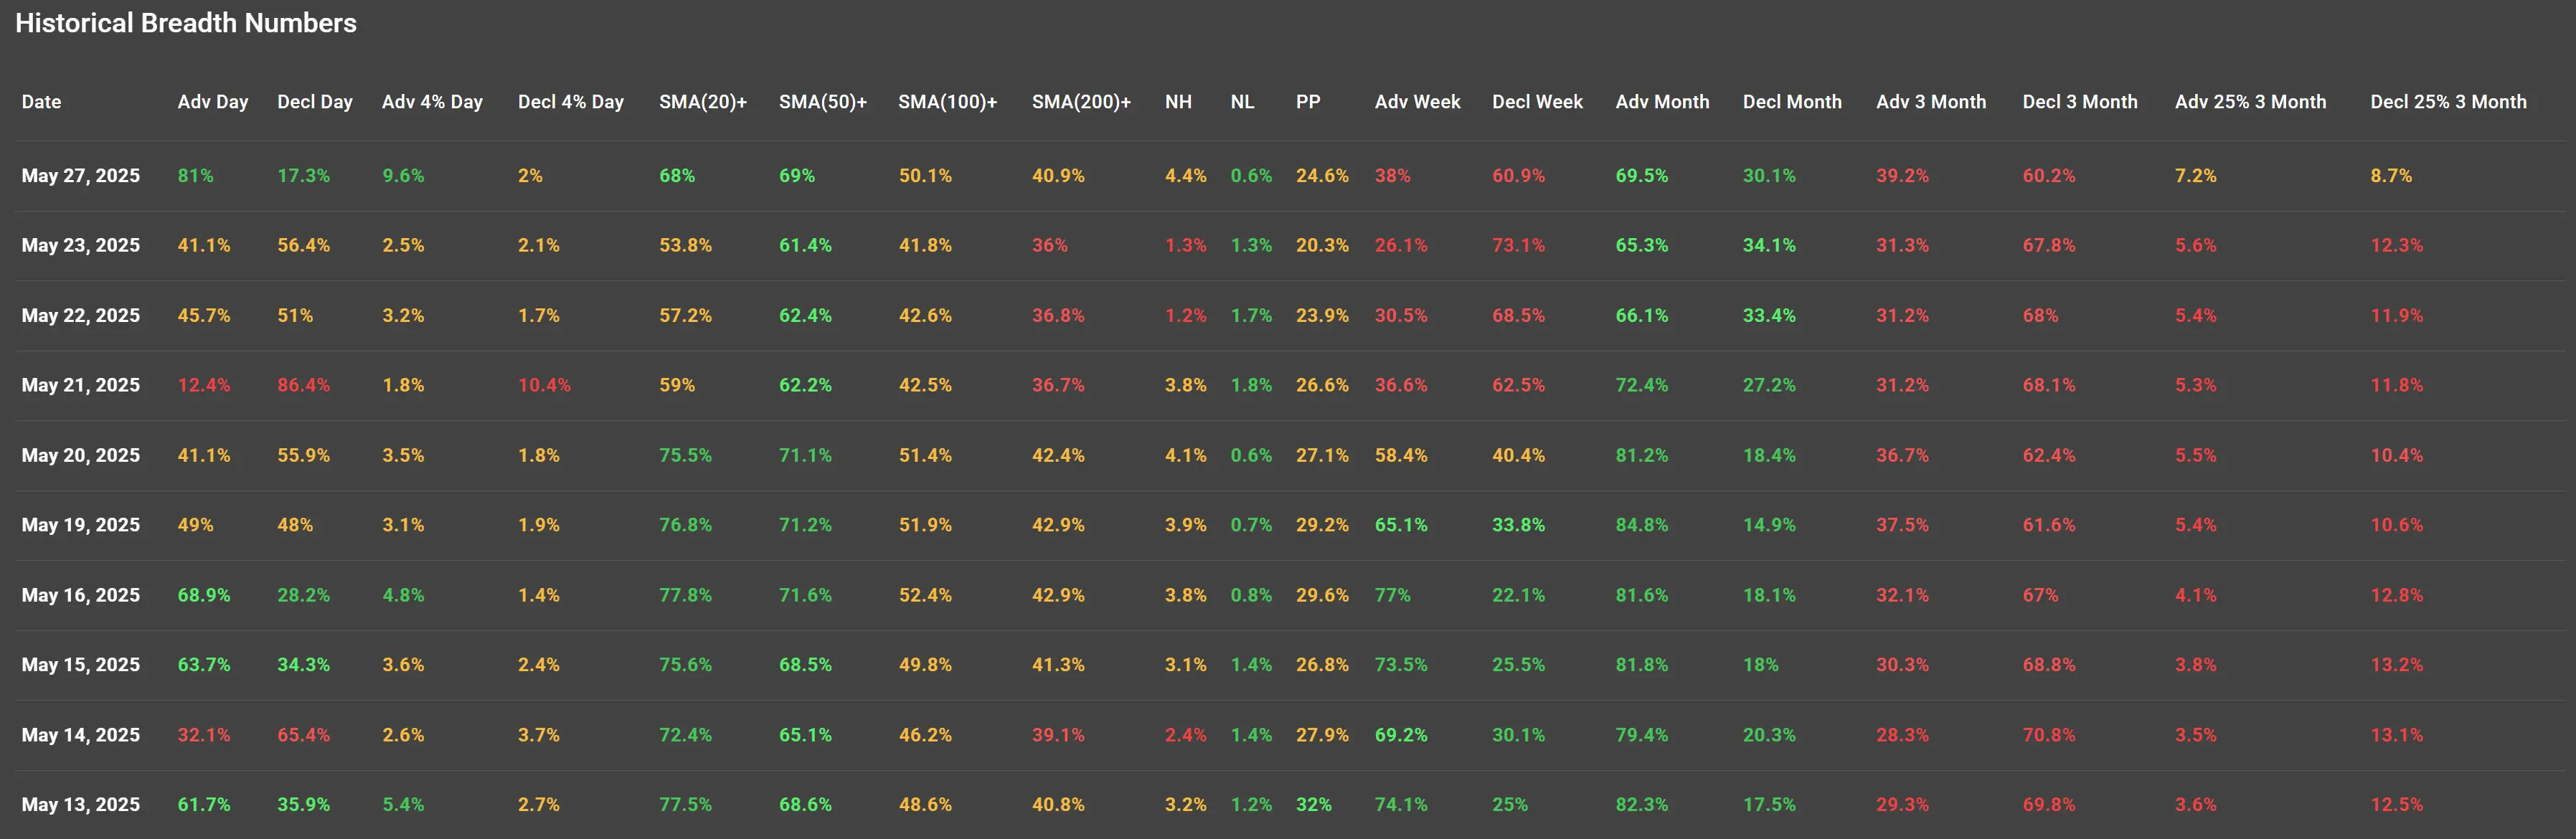
Market breadth indicators over the last two weeks suggest a notable shift in sentiment, particularly on May 27, 2025. After a mid-month period marked by weakness and broad-based declines (most notably May 21), the latest data points to improved internal strength.

Daily Advances vs Declines

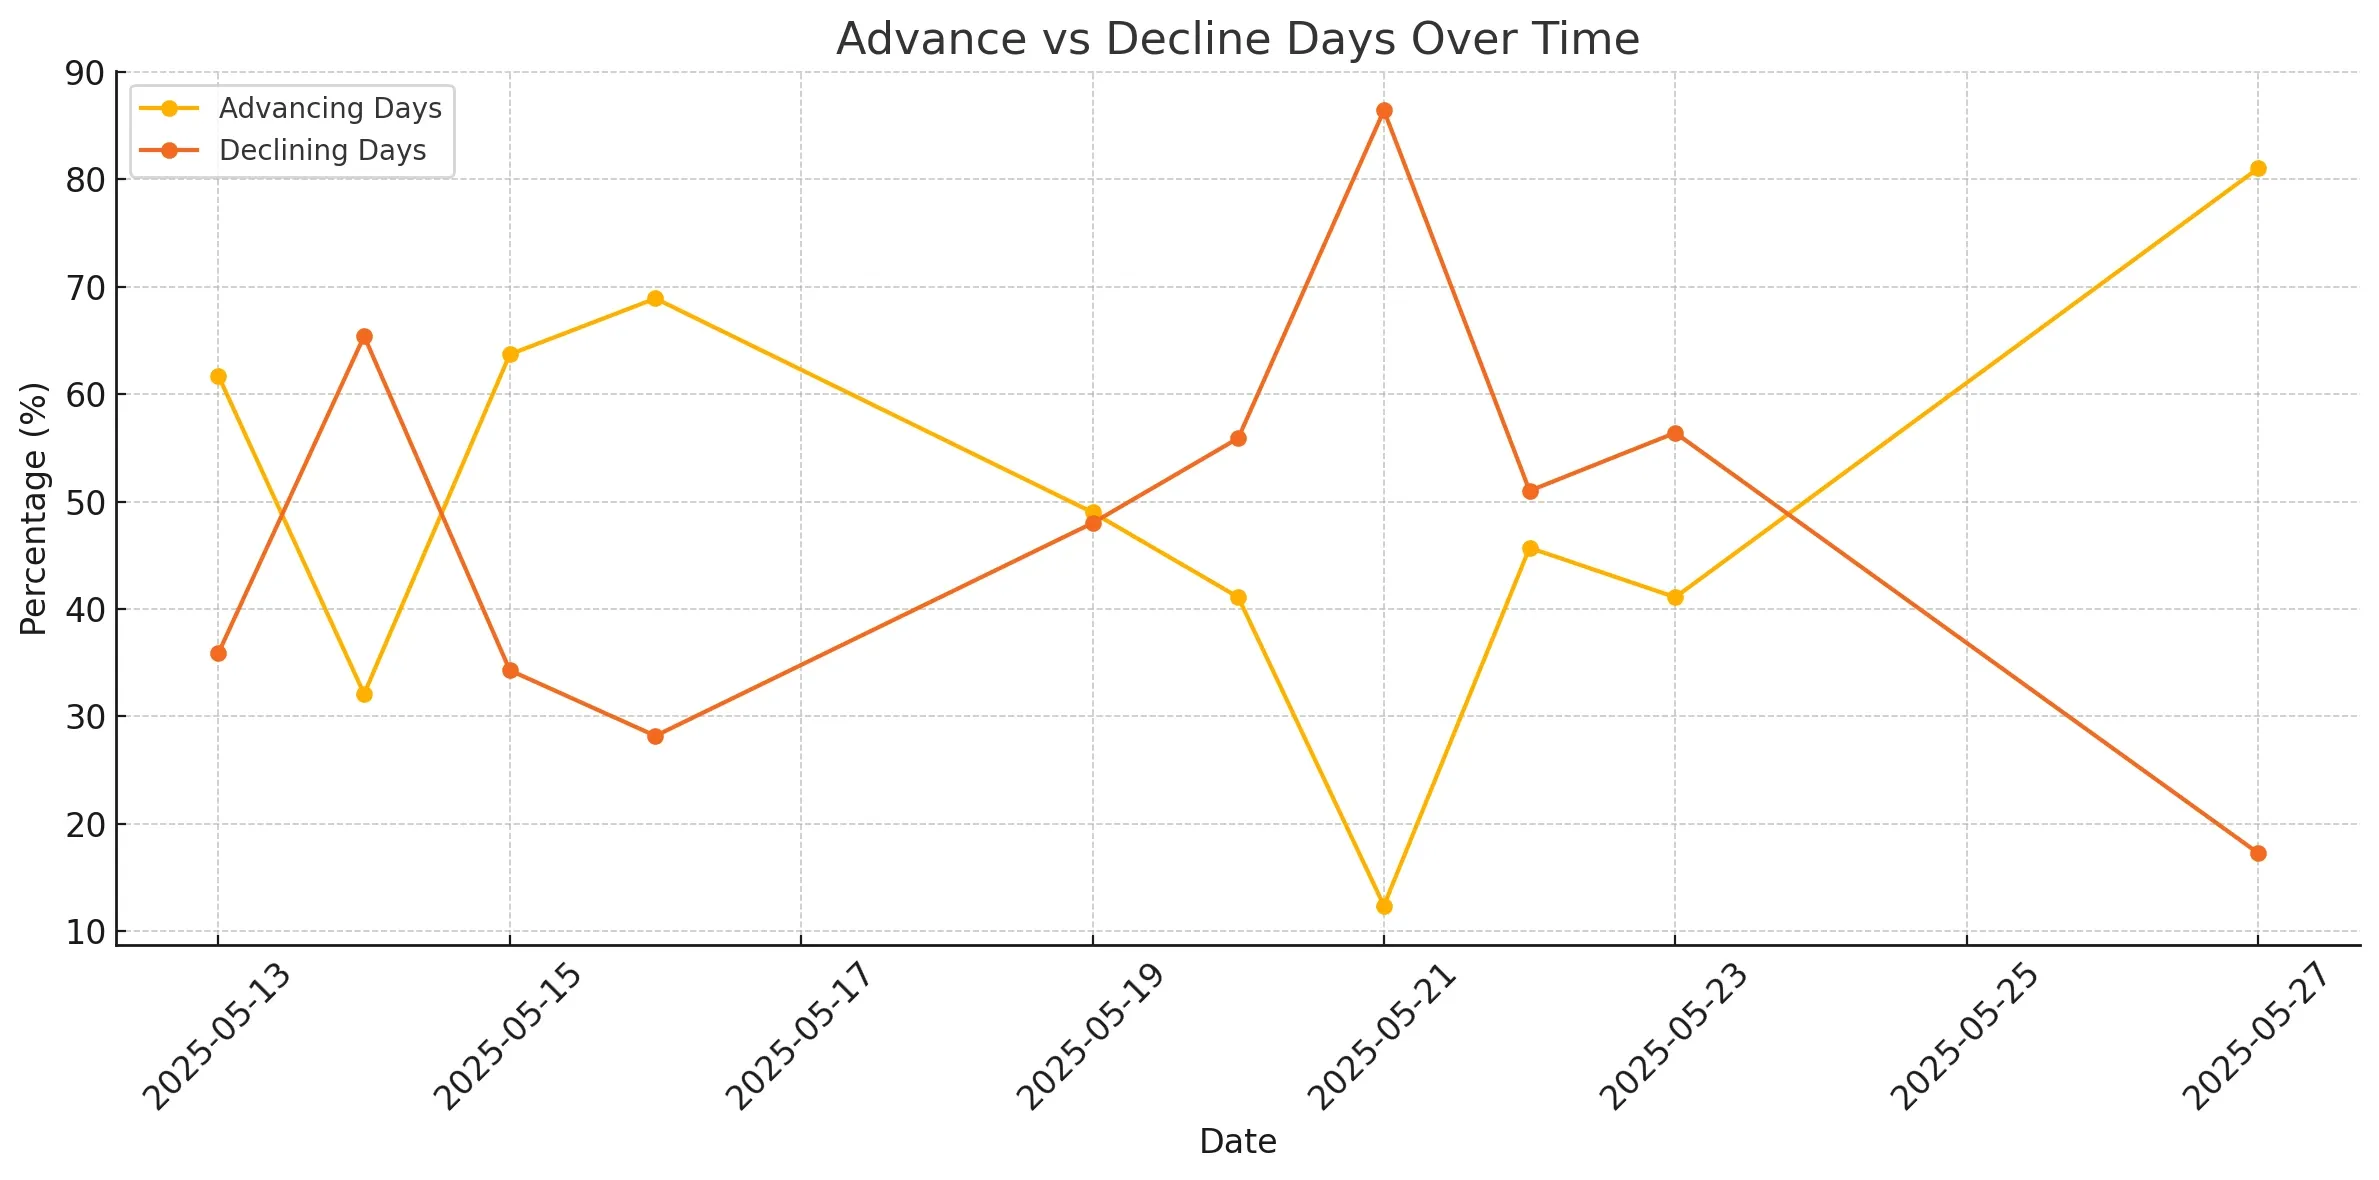
The first chart shows the percentage of advancing vs. declining stocks per day.

Market Breadth Advances vs Declines

Highlights include:

  • May 27: A strong bullish signal with 81% of stocks advancing and only 17.3% declining.

  • May 21: A significant down day, with only 12.4% of stocks advancing and 86.4% declining—a clear washout and potential capitulation signal.

  • Recent Rebound: Since the May 21 low, advancing breadth has steadily recovered, culminating in the breakout move on May 27.

Market Breadth via Moving Averages

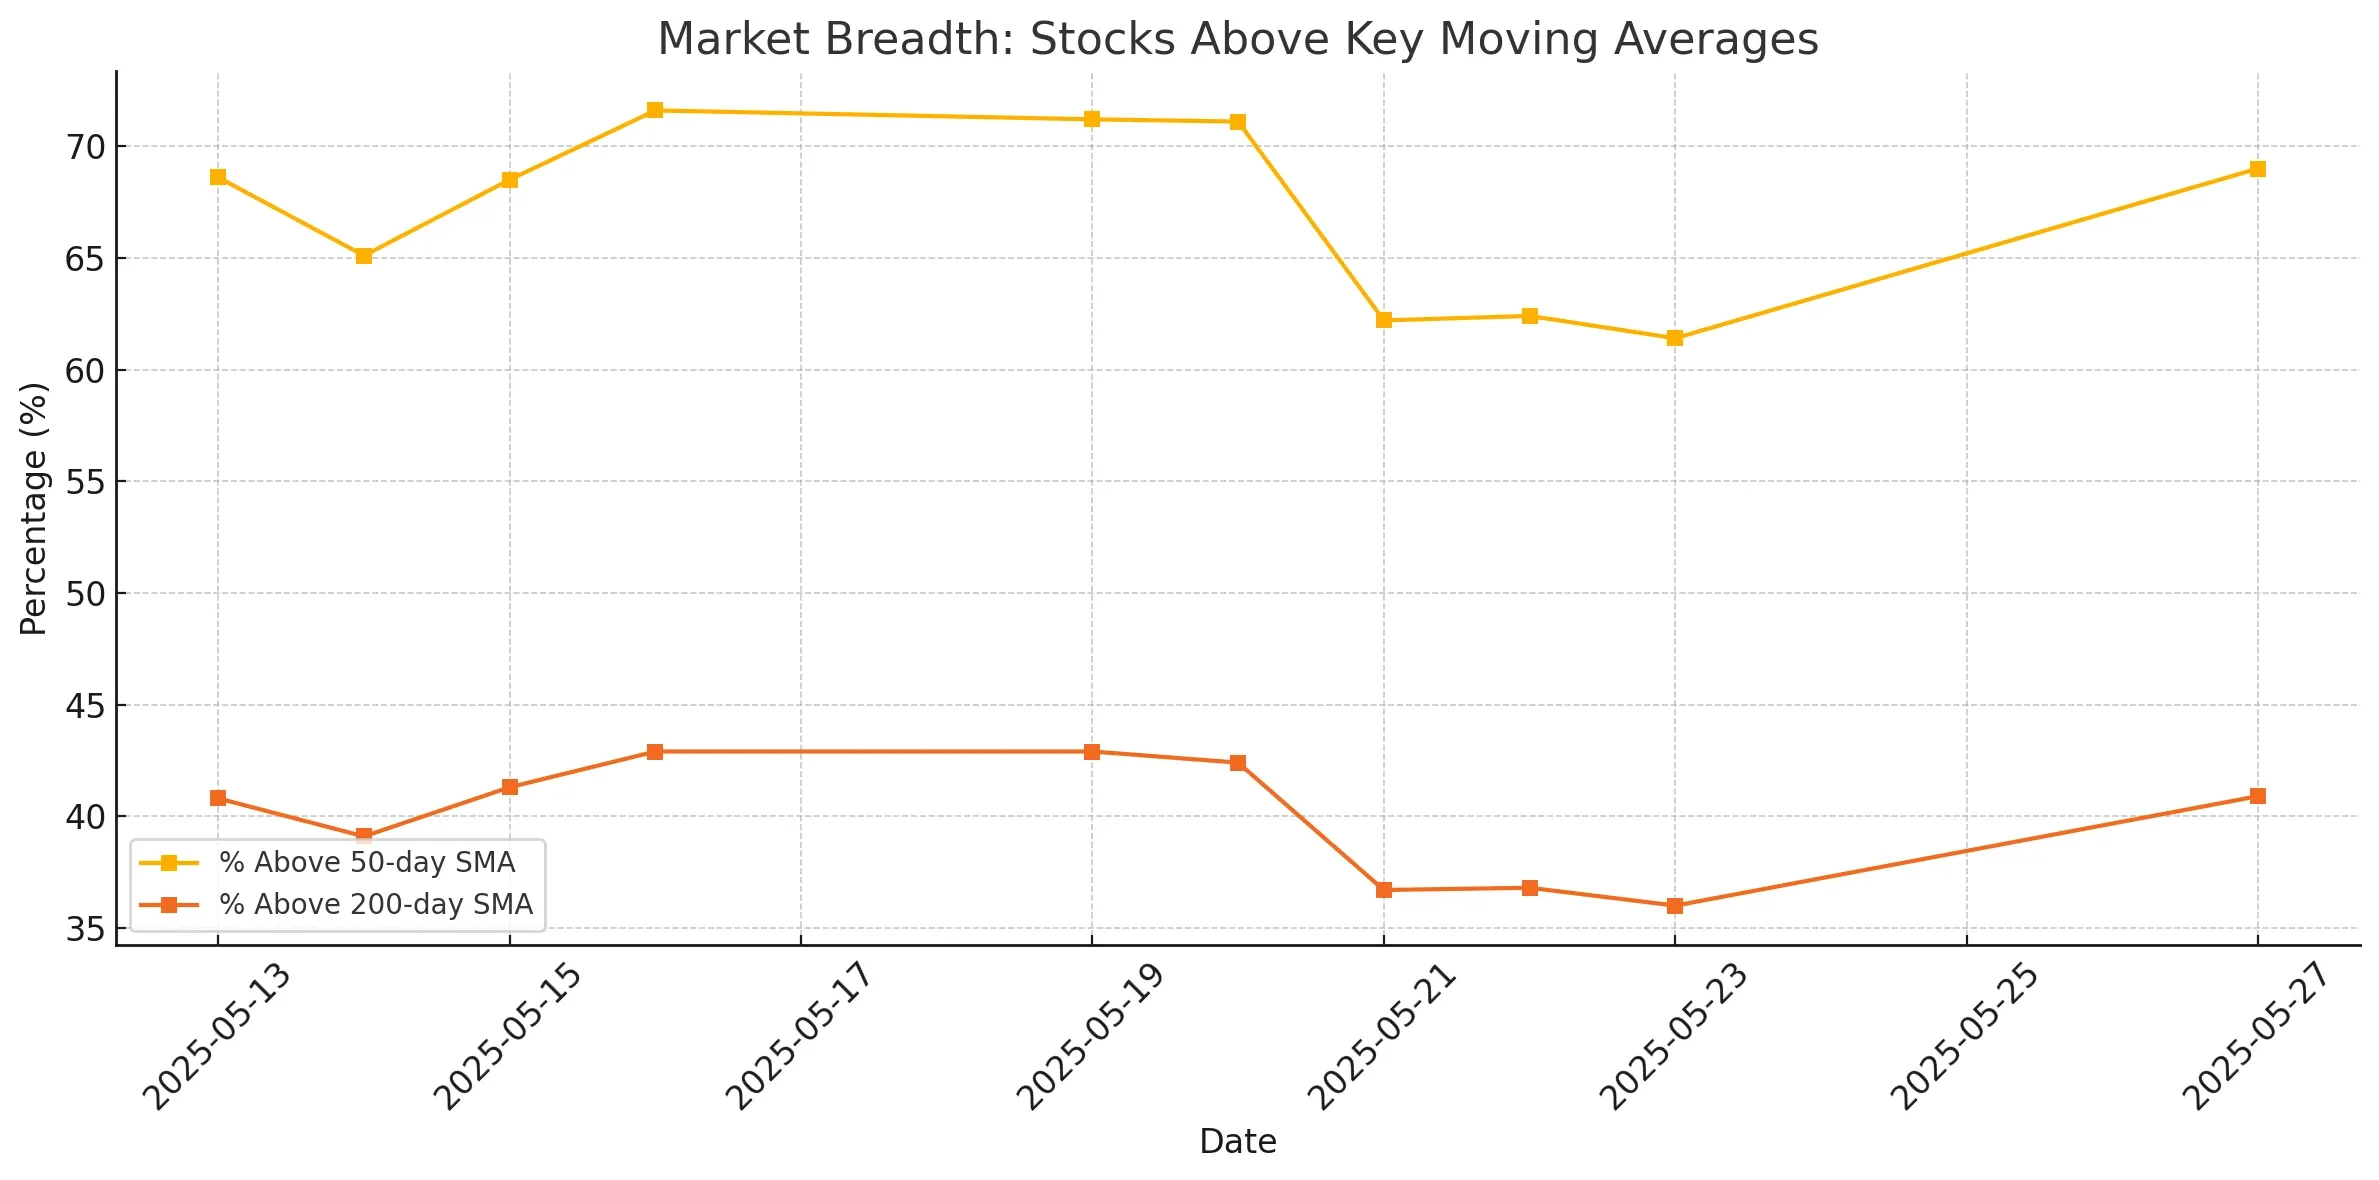
The second chart plots the percentage of stocks trading above their 50-day and 200-day simple moving averages (SMA):

Market Breadth Stocks vs Moving Averages
  • SMA(50): Rebounded from a mid-month dip (62% on May 23) to 69% by May 27, showing improved short- to mid-term momentum.

  • SMA(200): Long-term breadth remains below 50%, but improved from 36% on May 23 to 40.9% on May 27.

Interpretation: The rising percentage of stocks above both moving averages supports the case for a broad-based rally rather than a narrow leadership move.

Weekly Breadth Momentum

The third chart analyzes weekly advancing and declining breadth:

Market Breadth Weekly Breadth Momentum
  • A bearish shift occurred between May 19–23, with declining stocks outpacing advancers by a wide margin.

  • May 27 shows a positive turn: 38% of stocks advancing vs. 60.9% declining for the week. While not yet fully reversed, the improvement from recent lows is evident.

Key Takeaways

Short-Term Bullish Reversal: After severe selling pressure mid-month, breadth indicators show a notable reversal toward strength.

Watch the 200-Day SMA: While near-term participation has improved, only ~41% of stocks are trading above their 200-day SMAs. A sustainable rally will need this to climb toward 50%+.

Breadth Confirms Price: The May 27 surge in breadth confirms the bullish price action observed across major indices on that day, reinforcing the move’s credibility.

Next to read: Market Monitor News, May 28

ISHARES RUSSELL 2000 ETF

NYSEARCA:IWM (6/18/2025, 8:04:00 PM)

After market: 209.81 +0.16 (+0.08%)

209.65

+1.1 (+0.53%)


INVESCO QQQ TRUST SERIES 1

NASDAQ:QQQ (6/18/2025, 8:21:25 PM)

After market: 528.96 -0.03 (-0.01%)

528.99

-0.09 (-0.02%)


SPDR S&P 500 ETF TRUST

NYSEARCA:SPY (6/18/2025, 8:04:00 PM)

After market: 597.29 -0.15 (-0.03%)

597.44

-0.09 (-0.02%)


Find more stocks in the Stock Screener

IWM Latest News and Analysis

ChartMill News Imagea day ago - ChartmillMarket Monitor Trends (SPY, QQQ, IWM) and Breadth June 18

The Market Breathes Out Again – But It’s a Nervous Exhale

Mentions: QQQ SPY

ChartMill News Image2 days ago - ChartmillMarket Monitor Trends (SPY, QQQ, IWM) and Breadth June 17

Friday’s breadth collapse raised some eyebrows, but Monday erased a lot of that doubt.

Mentions: QQQ SPY

ChartMill News Image3 days ago - ChartmillMarket Monitor Trends (SPY, QQQ, IWM) and Breadth June 16

Sharp Reversal as Breadth Collapses

Mentions: QQQ SPY

ChartMill News Image6 days ago - ChartmillMarket Monitor Trends (SPY, QQQ, IWM) and Breadth June 13

Bulls still have the ball, but they’re no longer sprinting. They’re looking over their shoulder.

Mentions: QQQ SPY

ChartMill News Image8 days ago - ChartmillMarket Monitor Trends (SPY, QQQ, IWM) and Breadth June 12

While fewer stocks participated in gains today, most remain above key moving averages, and longer-term momentum is holding.

Mentions: QQQ SPY

ChartMill News Image9 days ago - ChartmillMarket Monitor Trends (SPY, QQQ, IWM) and Breadth June 11

The market breadth on June 10, 2025, points to a strengthening bullish undercurrent, especially after the volatility of early June. Breadth metrics now show consistency across daily, weekly, and medium-term indicators.

Mentions: QQQ SPY

ChartMill News Image9 days ago - ChartmillMarket Monitor Trends (SPY, QQQ, IWM) and Breadth June 10

Breadth metrics for June 9 confirm that last week’s sharp selloff on June 5 was likely a short-lived pullback rather than the start of a new bearish phase.

Mentions: QQQ SPY

ChartMill News Image11 days ago - ChartmillMarket Monitor Trends (SPY, QQQ, IWM) and Breadth June 09

The June 6 session confirms that breadth is not only improving but now supporting the index-level gains we’ve seen in the major averages.

Mentions: QQQ SPY

ChartMill News Image14 days ago - ChartmillMarket Monitor Trends (SPY, QQQ, IWM) and Breadth June 06

SPY, QQQ both showing a distribution day after yesterday's session (down on above-average volume near the high).

Mentions: QQQ SPY

ChartMill News Image15 days ago - ChartmillMarket Monitor Trends (SPY, QQQ, IWM) and Breadth June 05

Breadth readings remain firm for now, this appears to be a healthy pause, not a reversal.

Mentions: QQQ SPY

ChartMill News Image16 days ago - ChartmillMarket Monitor Trends (SPY, QQQ, IWM) and Breadth June 04

Both the QQQ and the SPY broke out above their main resistance levels today.

Mentions: QQQ SPY

ChartMill News Image18 days ago - ChartmillMarket Monitor Trends (SPY, QQQ, IWM) and Breadth June 02

The indices continue to quote close to their next resistance. While headline indices may show only minor daily fluctuations, the underlying breadth data paints a more fragile picture.

Mentions: QQQ SPY

Follow ChartMill for more