Market Monitor Trends (SPY, QQQ, IWM) and Breadth May 21
By Kristoff De Turck - reviewed by Aldwin Keppens
Last update: May 21, 2025

(All data & visualisations by ChartMill.com)
Daily Market Trend Analysis – May 20, 2025 (After Market Close)
U.S. equities paused after a strong rally, with all major indices showing modest pullbacks on the day — a potential breather as they approach key resistance levels.
Short Term Trend
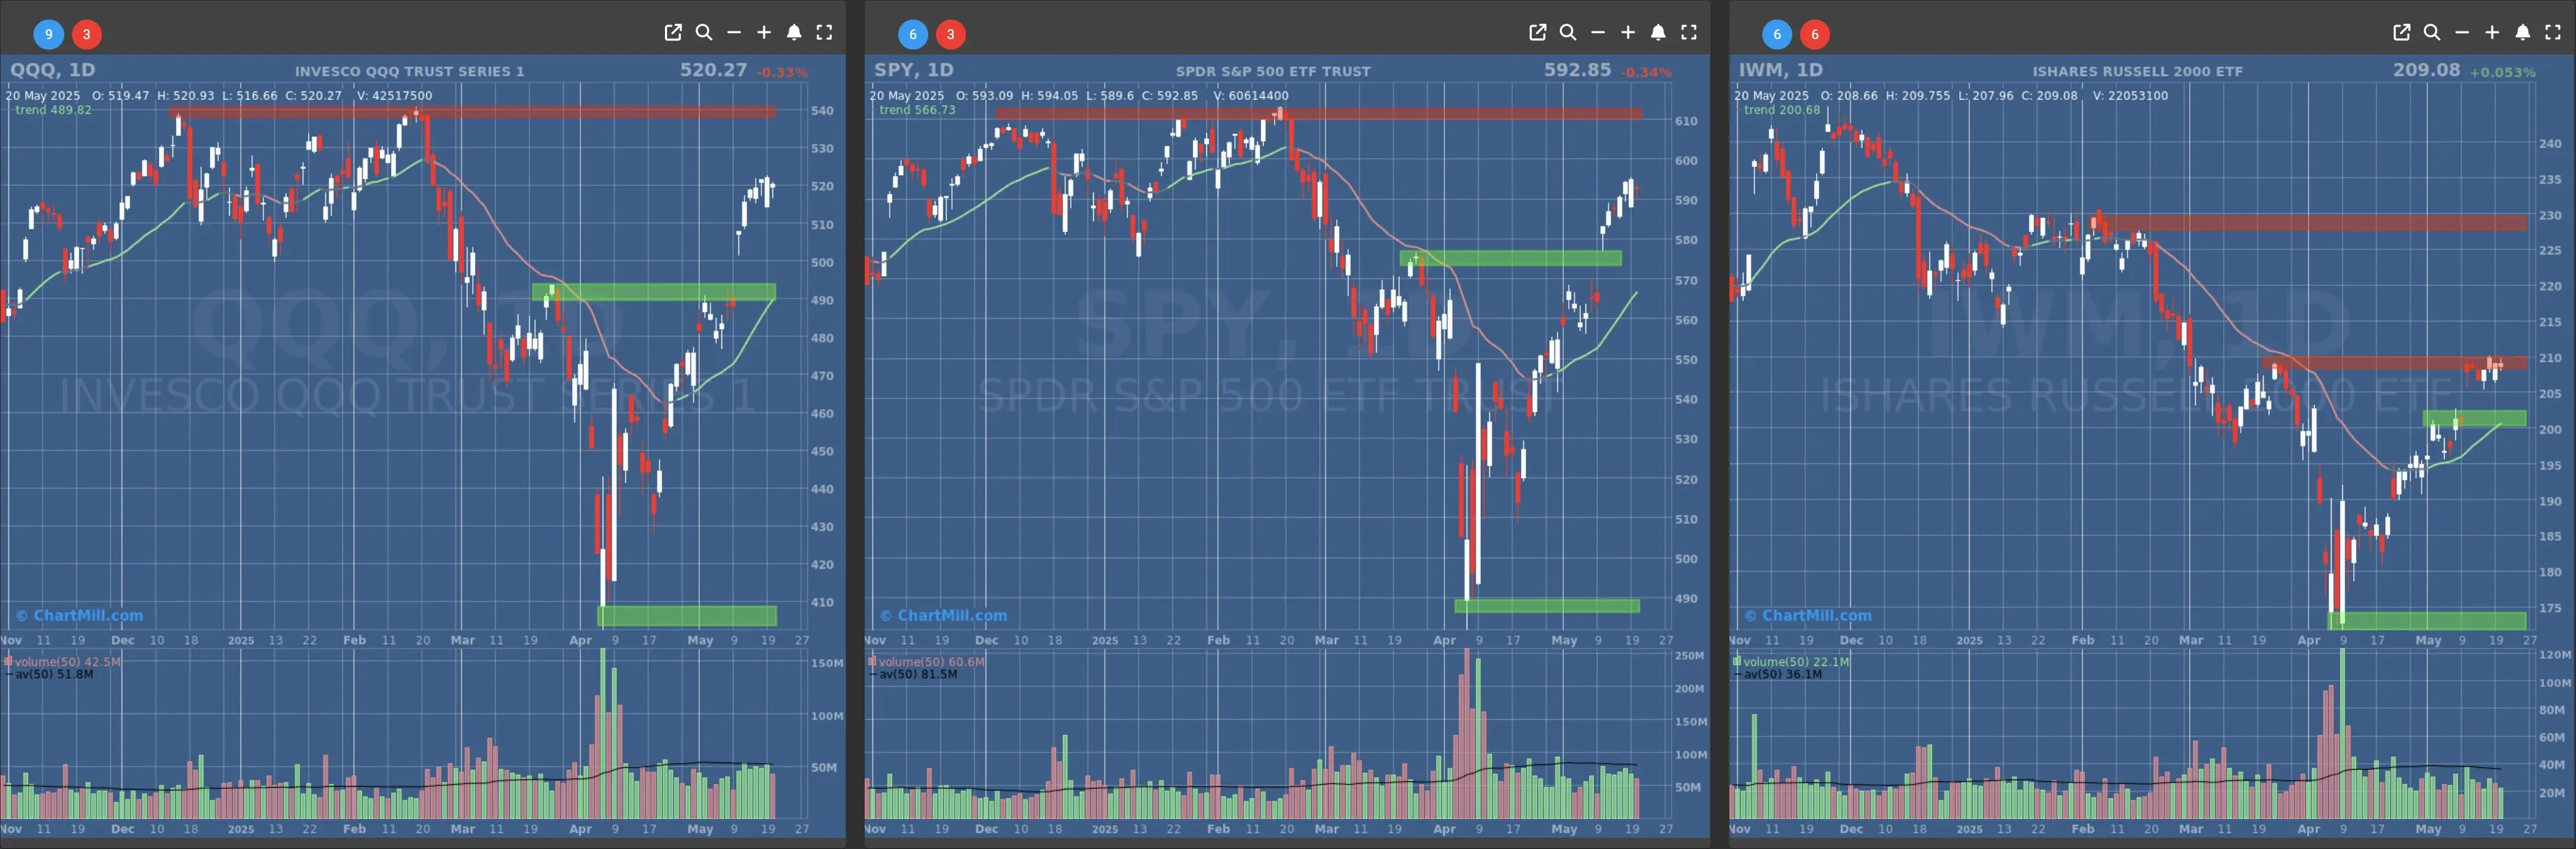
- Short-Term Trend: Bullish (no change)
- Support at $560 - $570
- Resistance at $610
- Volume: Slightly below average (50)
- Pattern: Hanging Man candle, Inside Day
- Short-Term Trend: Bullish (no change)
- Support at $490 - $500
- Resistance at $540
- Volume: Slightly below average (50)
- Pattern: Hanging Man candle, Inside Day
- Short-Term Trend: Bullish (no change)
- Support at $200
- Resistance at $210-215
- Volume: Below average (50)
- Pattern: At resistance
Long Term Trend
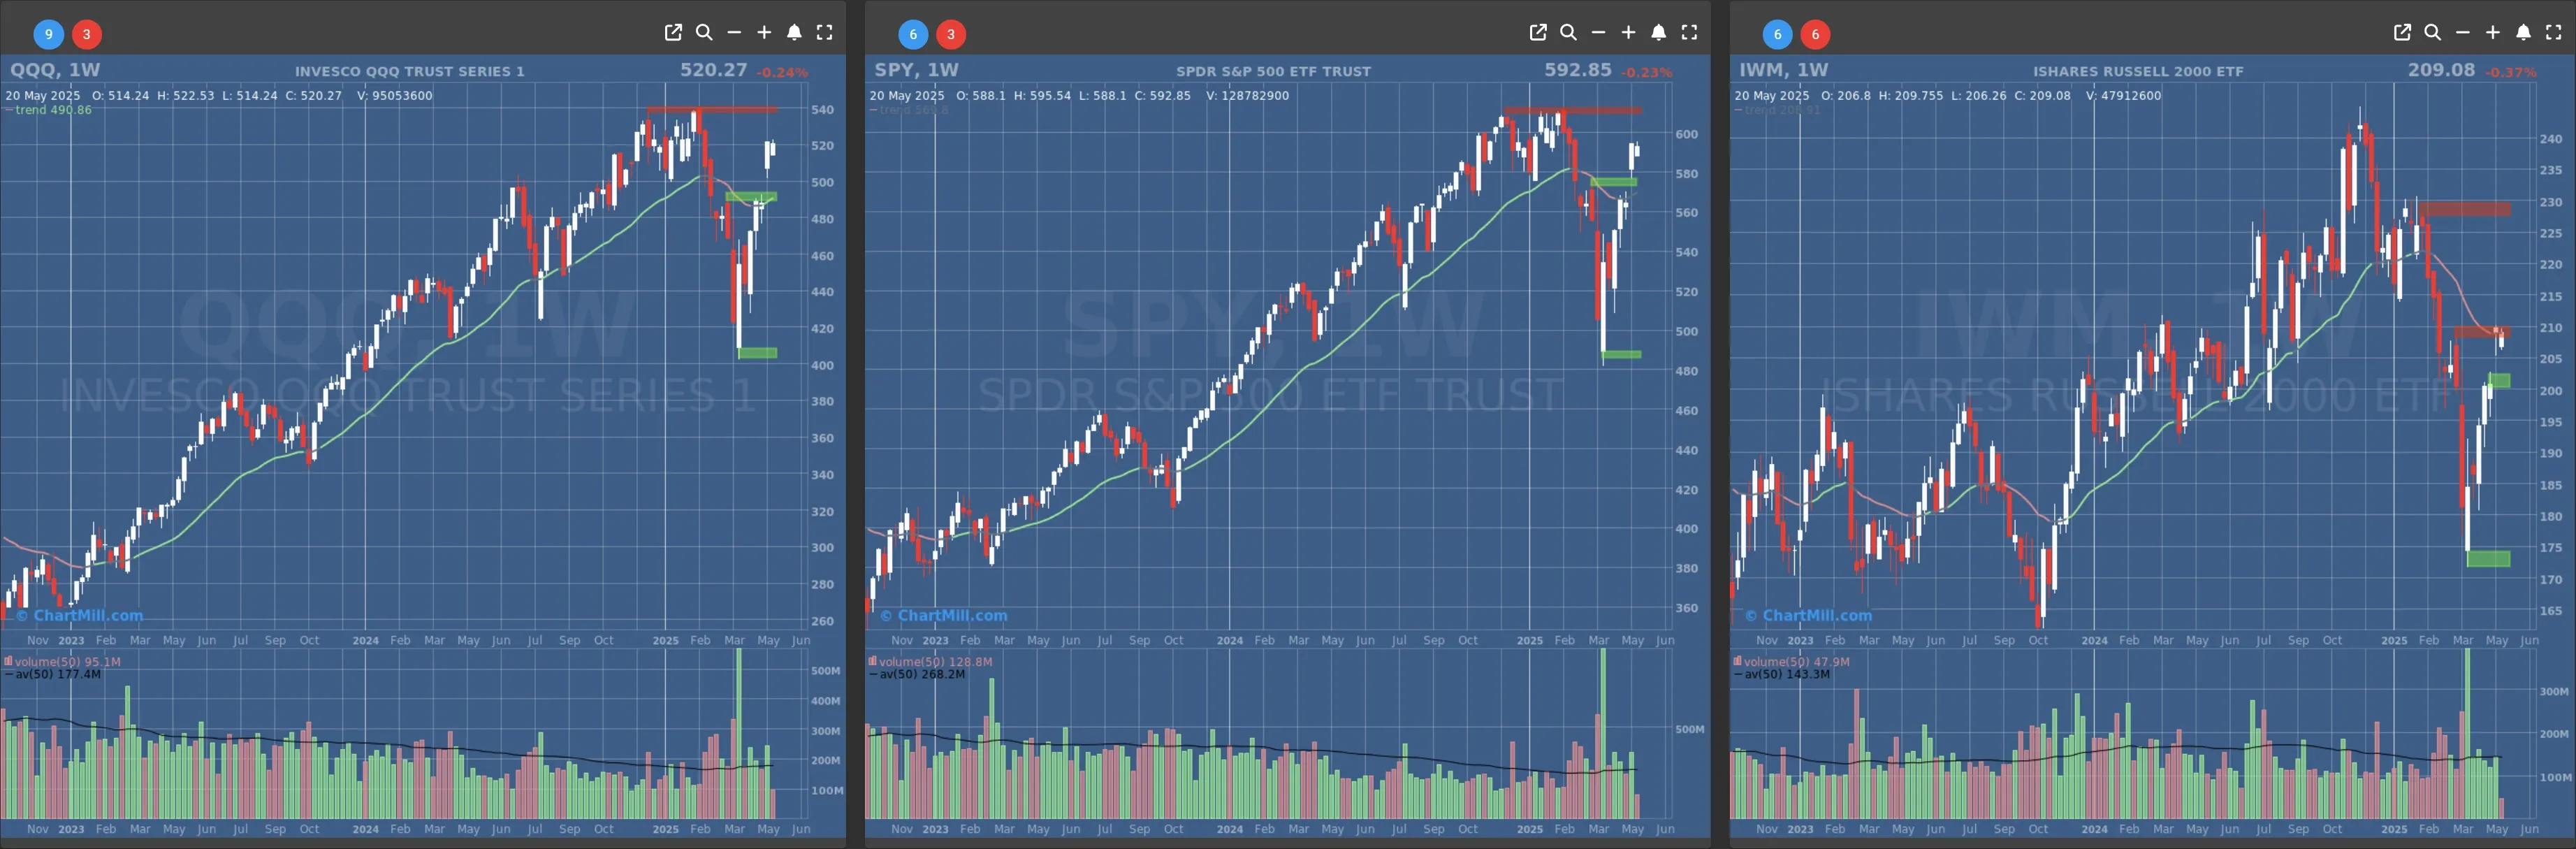
- Long-Term Trend: Neutral (no change)
- Long-Term Trend: Positive (no change)
- Long-Term Trend: Neutral (no change)
Daily Market Breadth Analysis – May 20, 2025 (After Market Close)
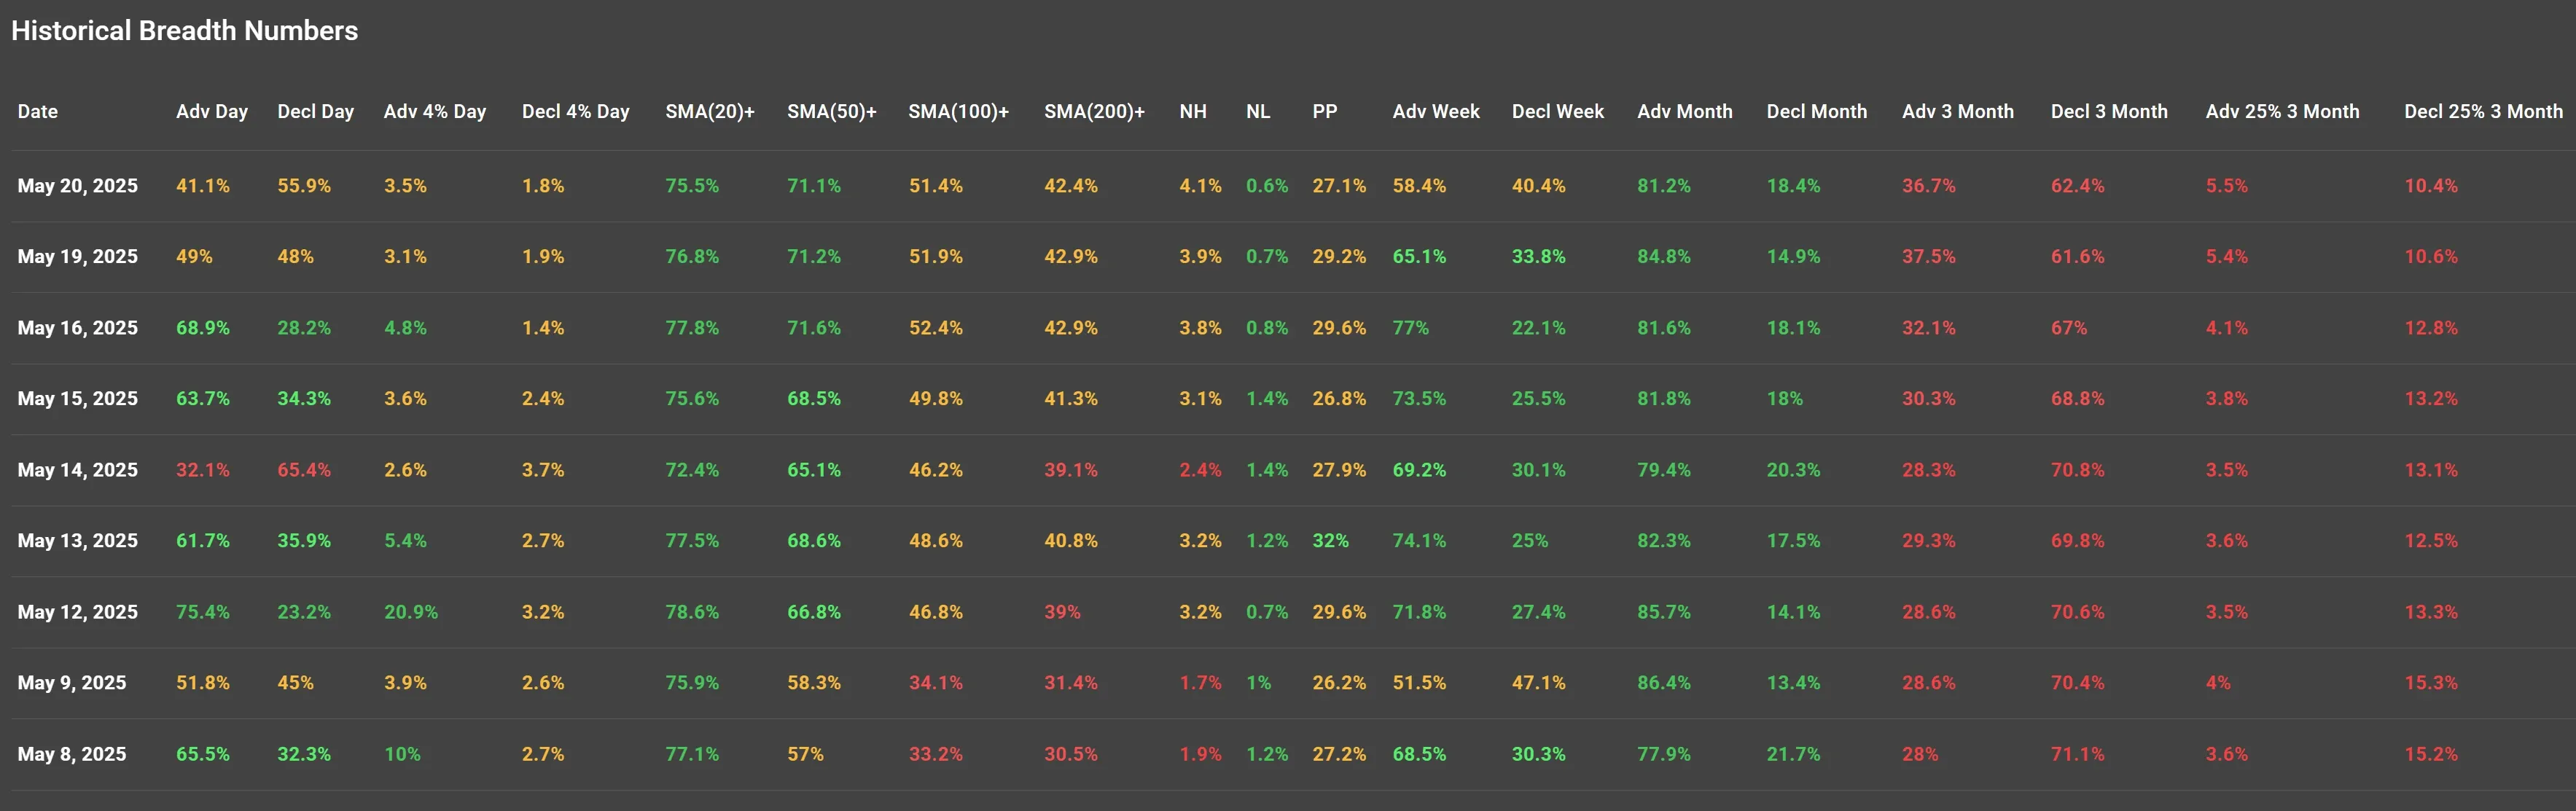
After a strong run-up in early May, the latest data suggests that market participation is beginning to weaken, a potential warning sign for bulls.
Advancers vs. Decliners: Momentum Is Slipping
The percentage of advancing stocks dropped sharply to 41.1% on May 20, down from 68.9% just four sessions ago. Decliners have overtaken advancers in three of the last four sessions, highlighting thinning leadership under the surface despite only a mild pullback in the indices.
Visual: Advancing vs. Declining Stocks
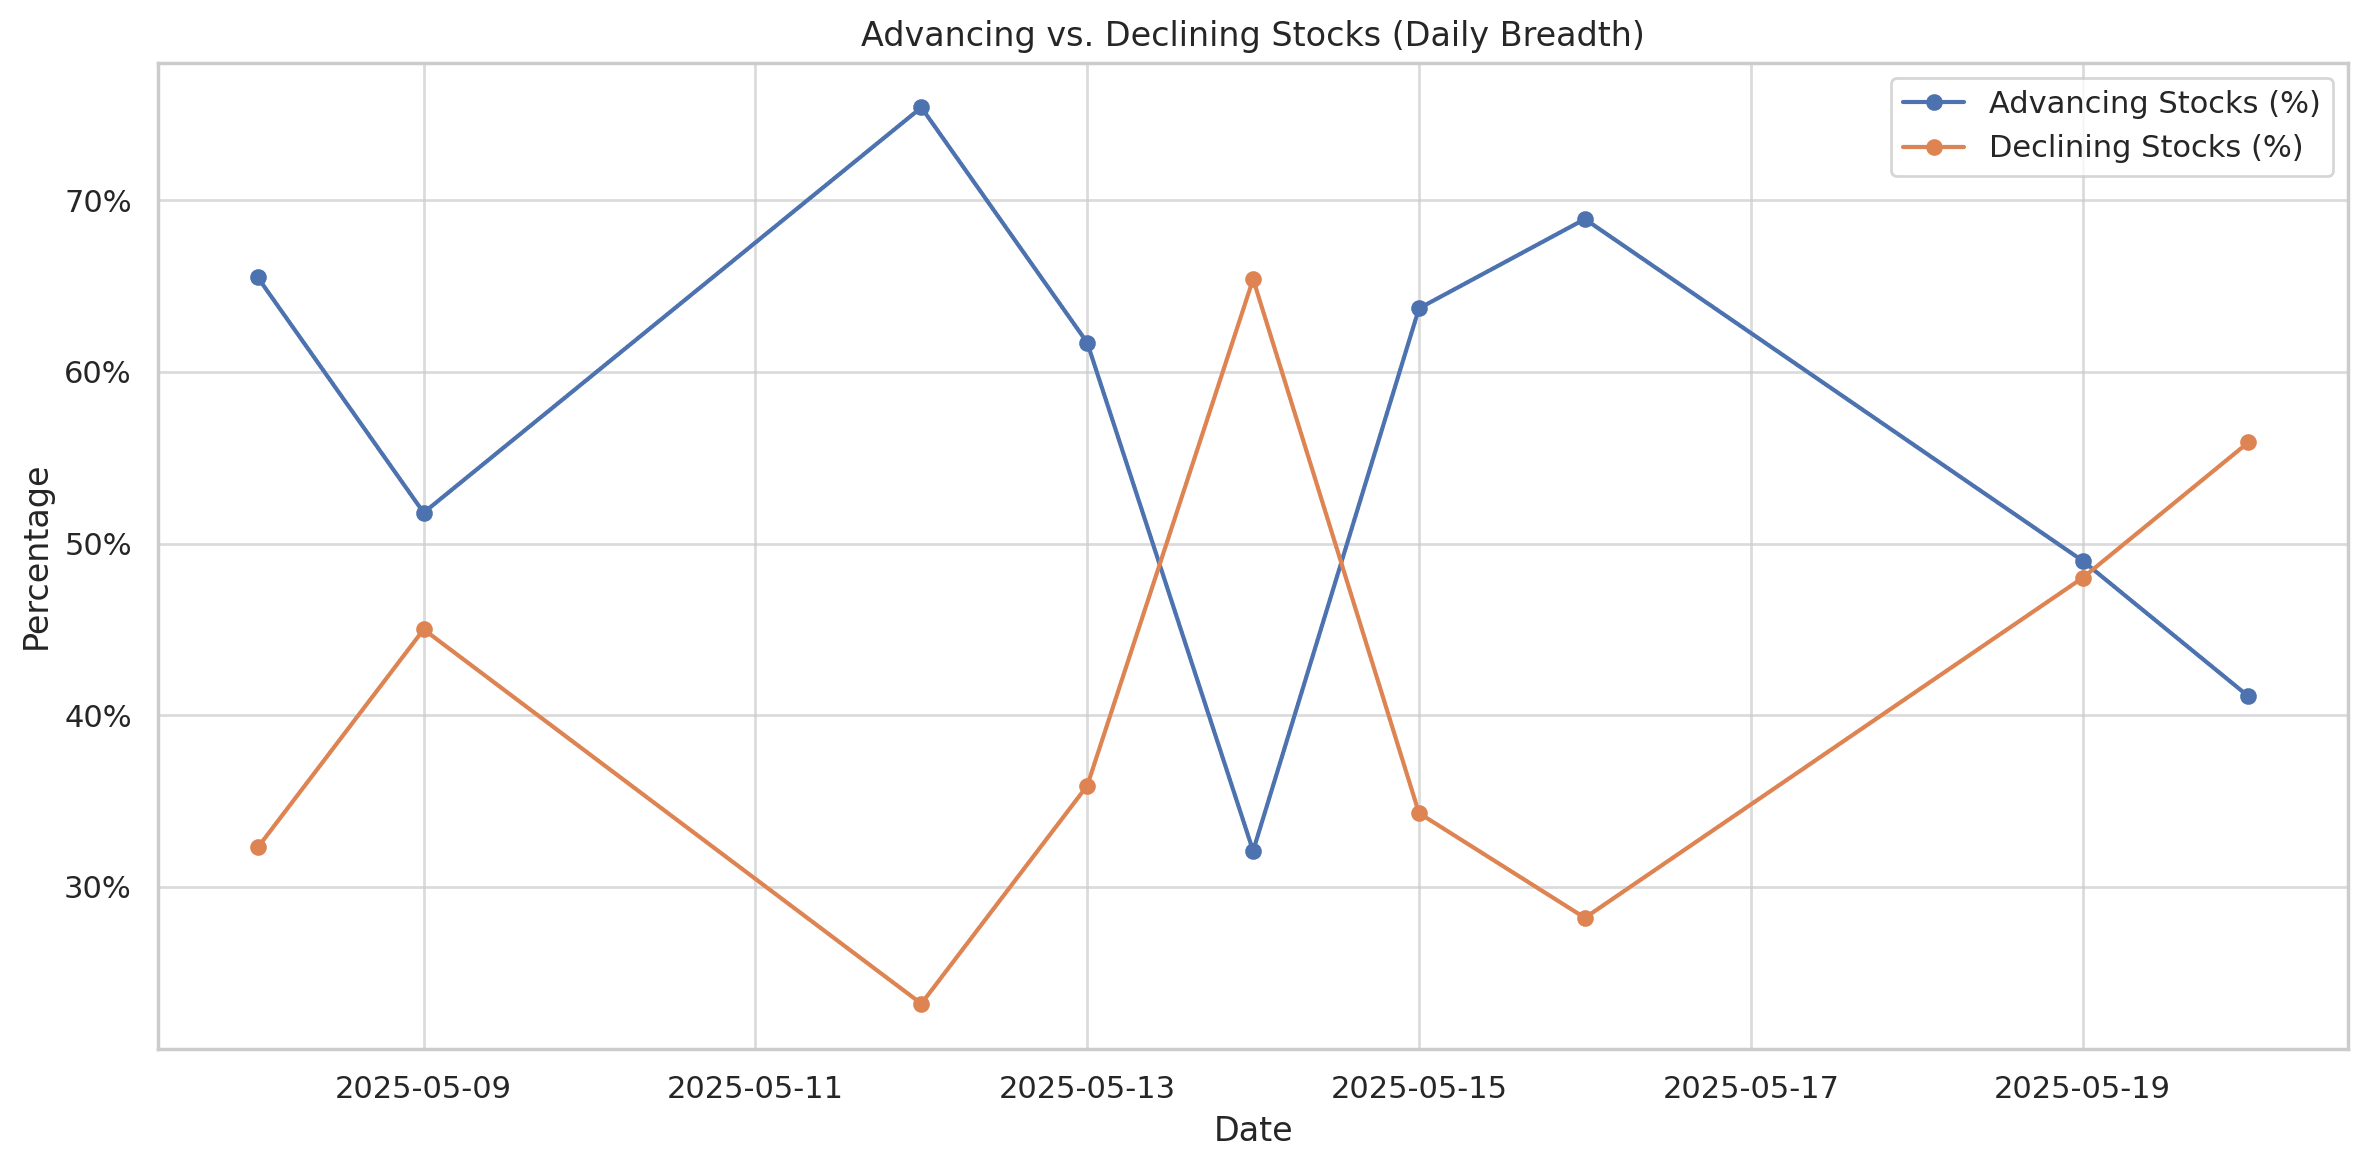
-
A shift from broad-based buying earlier in the month to more defensive posture.
-
May 12 showed peak participation (75.4% advancers), now cut almost in half.
Stocks Above Key Moving Averages: Still Solid but Flattening
-
71.1% of stocks remain above their 50-day SMA.
-
42.4% remain above the 200-day SMA.
While these numbers are still respectable, they’ve plateaued in recent days. If they begin to turn down, it would signal weakening breadth underneath headline strength.
Visual: % Above 50/200-Day SMAs
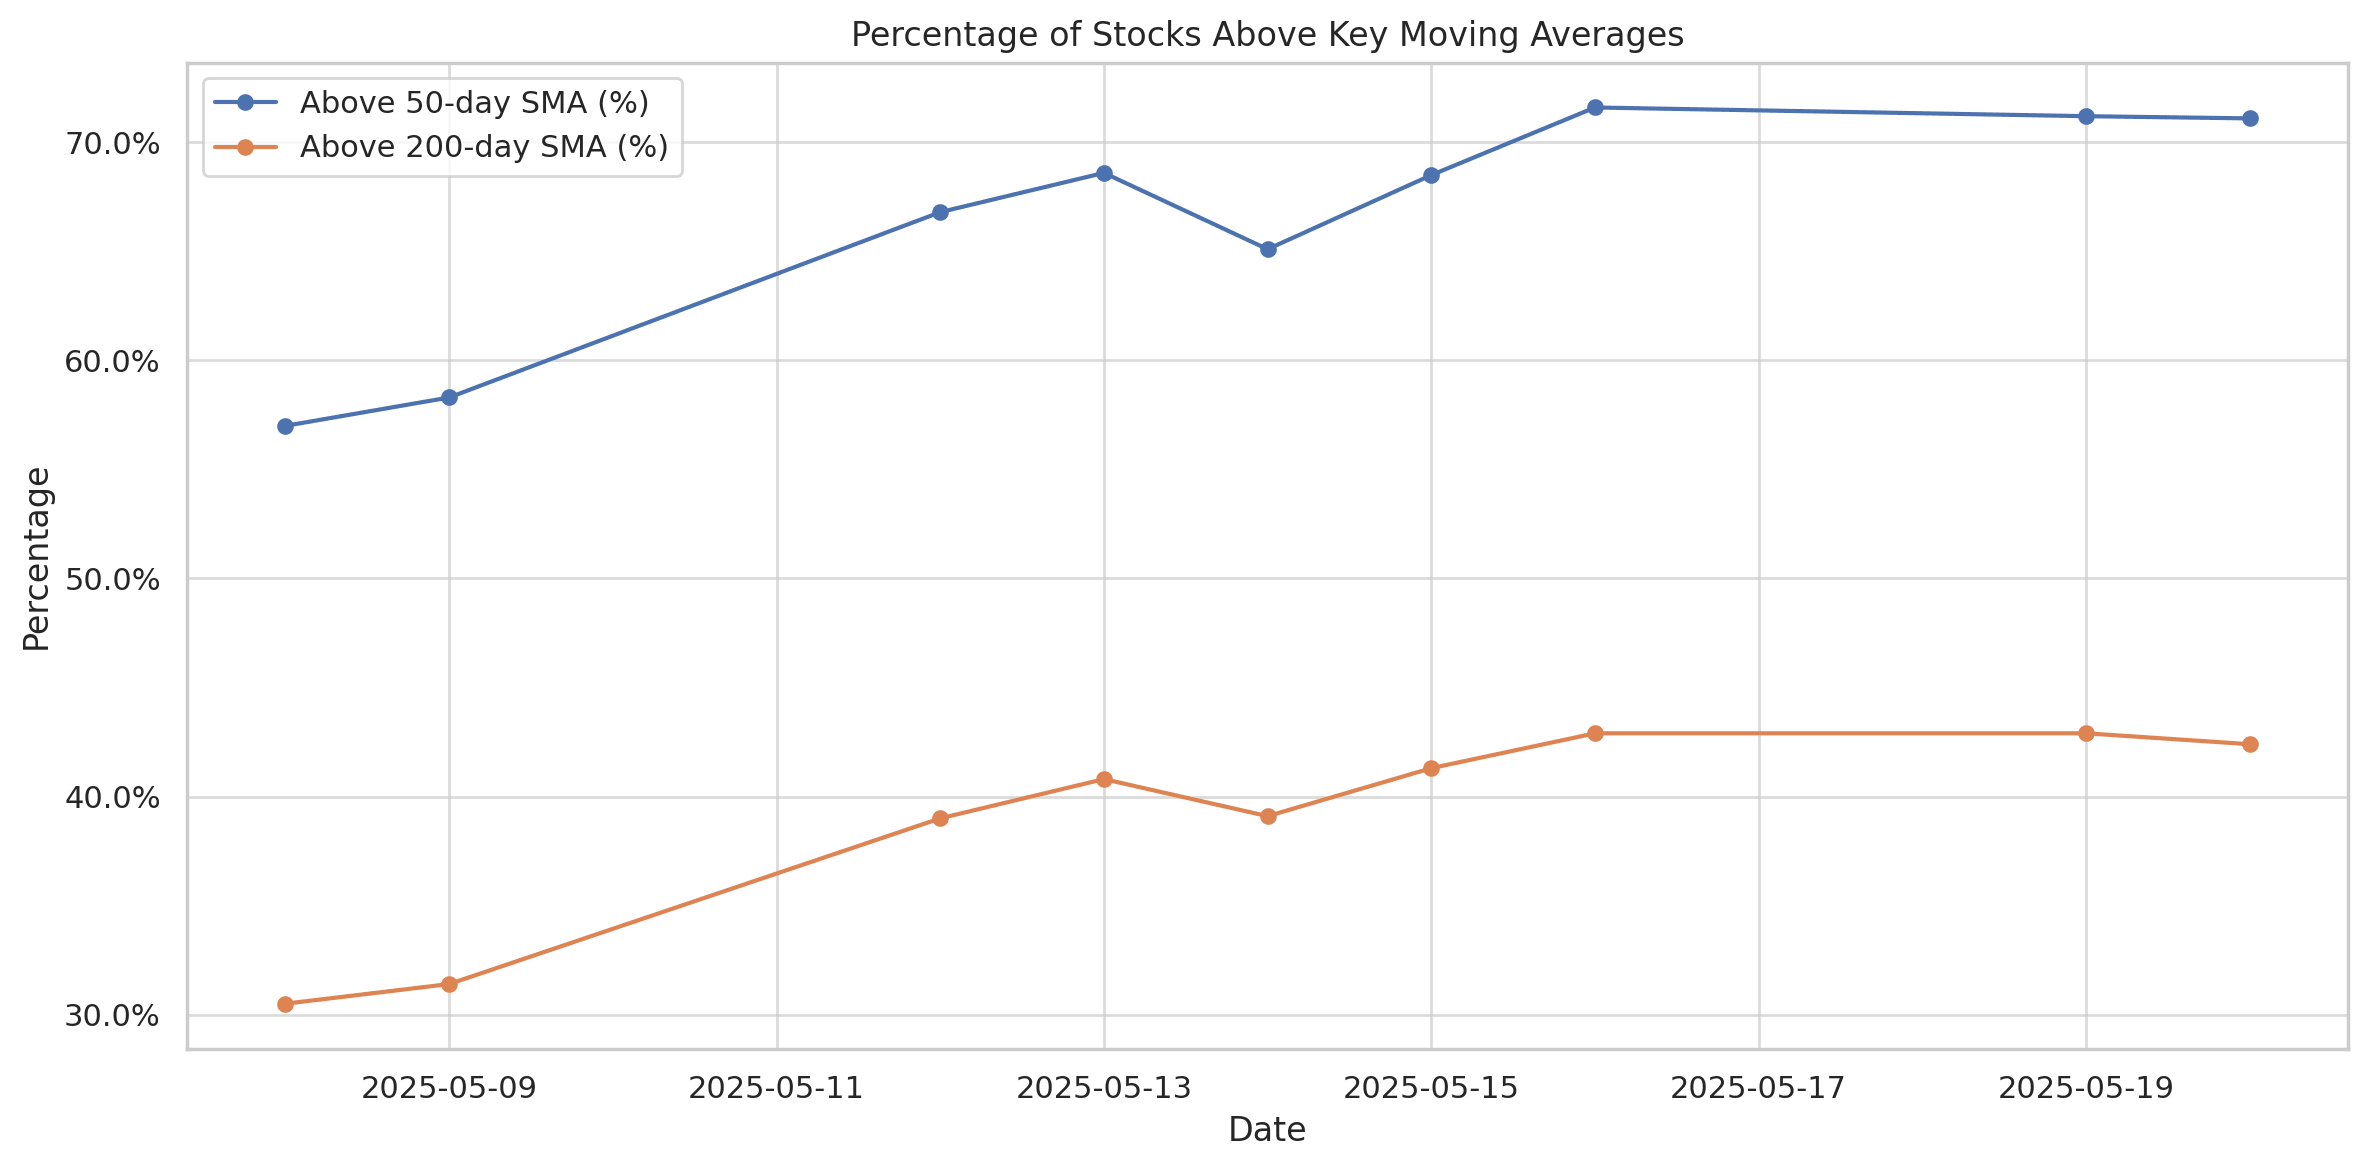
A rising trend through mid-May is now stalling. Watch for any crossover or sustained declines in these metrics.
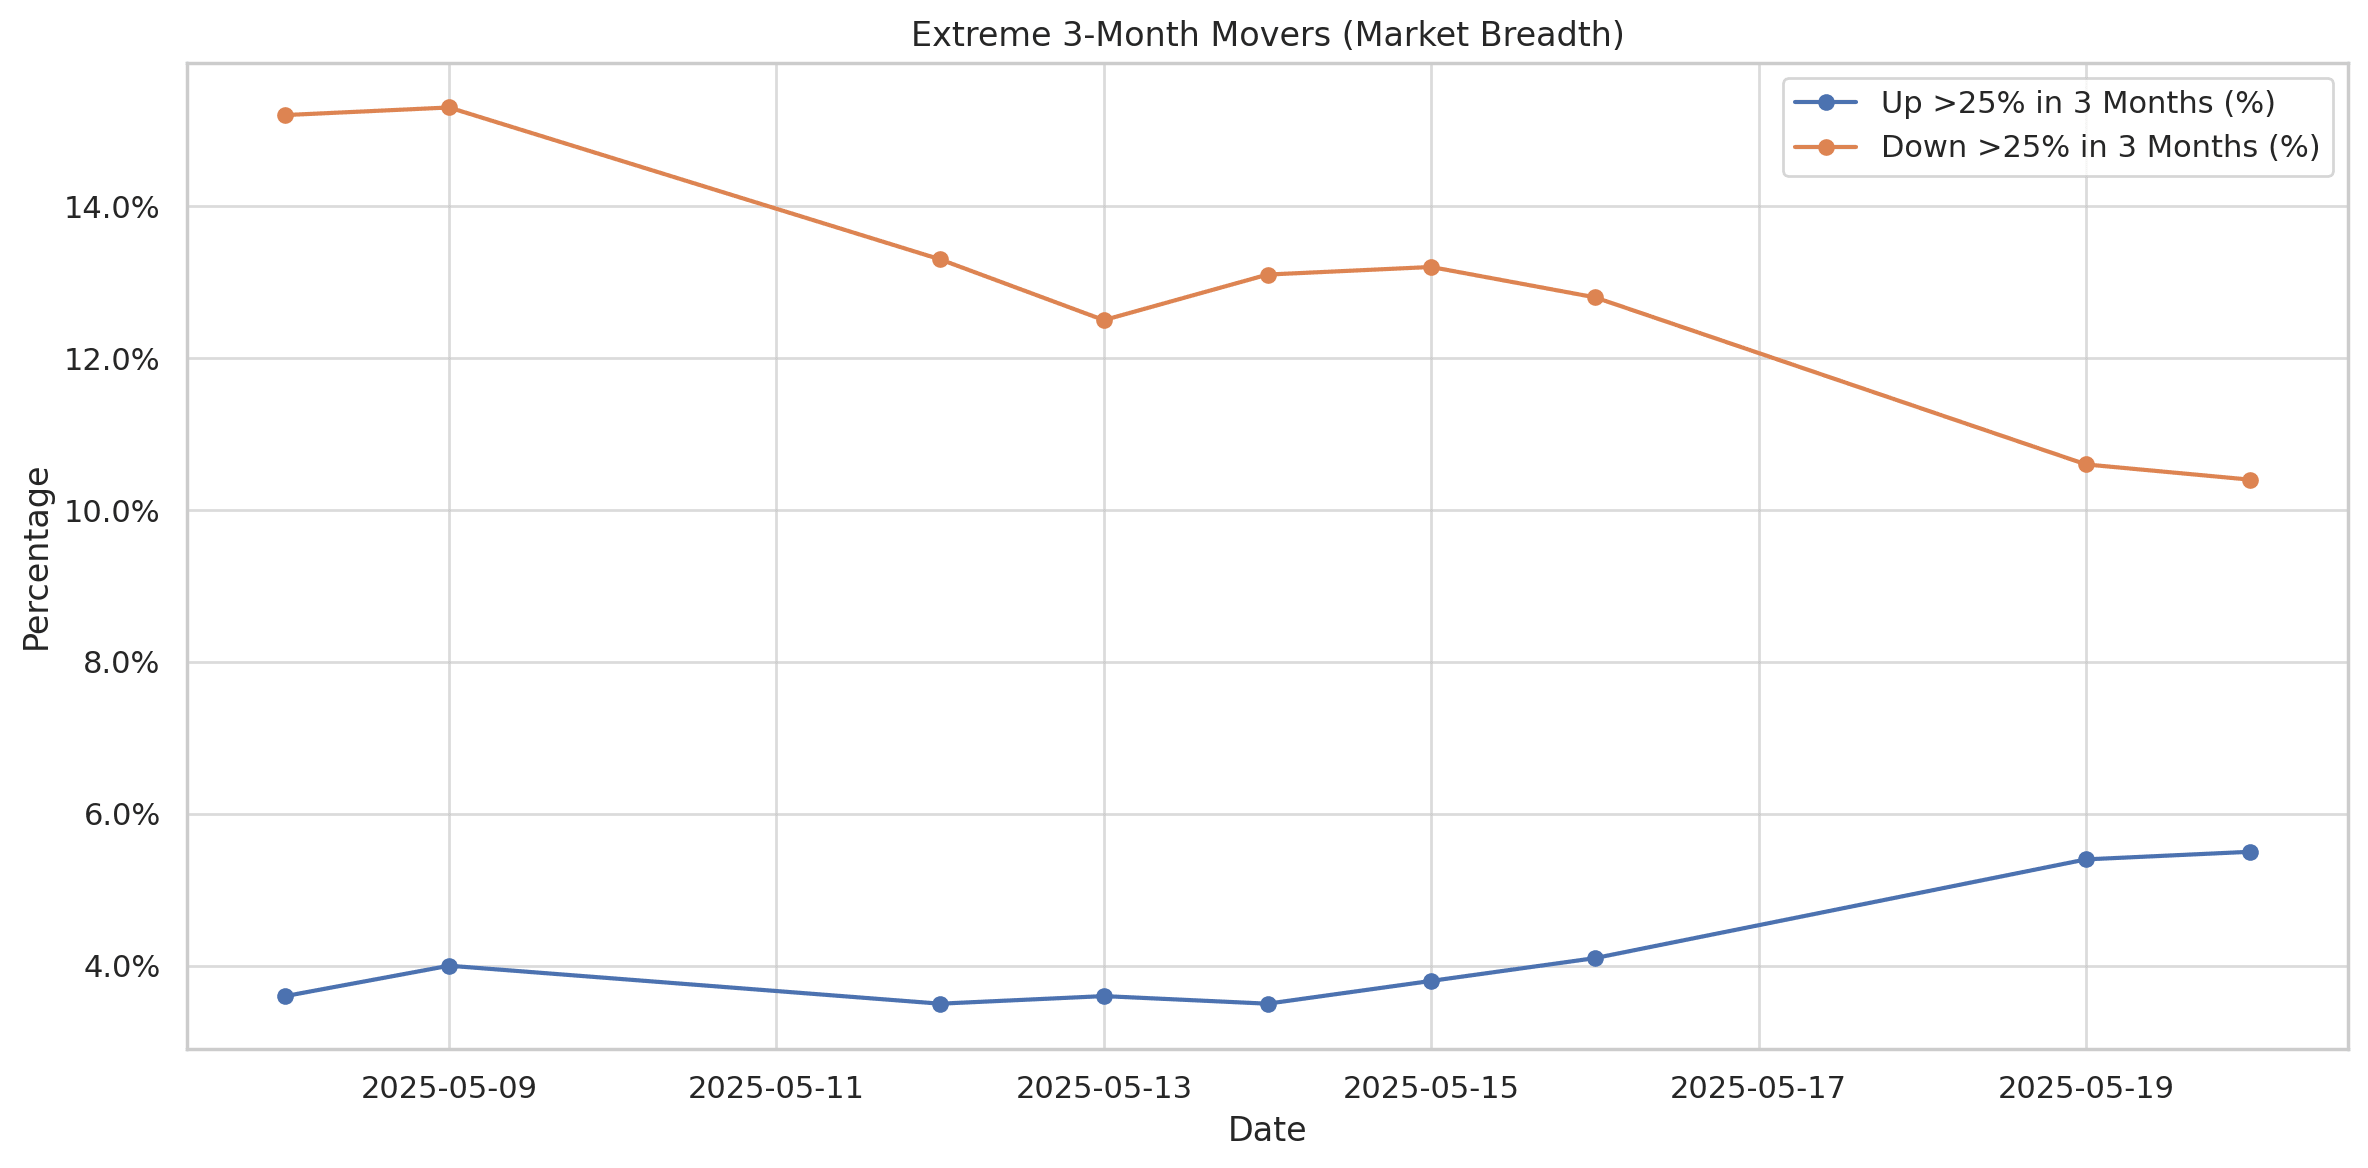
Longer-Term Extremes: Fewer Big Losers, Slight Pickup in Big Gainers
Over the past 3 months:
-
Only 5.5% of stocks are up more than 25%.
-
But 10.4% are still down more than 25%, though that number has been declining steadily.
This suggests some healing beneath the surface, but the market is still carrying substantial laggards from the earlier part of the year.
Visual: 3-Month Performance Extremes
-
Bearish momentum (declines >25%) is easing.
-
Bullish extremes are inching up — albeit slowly.
Final Takeaway
While the major indices are holding up, breadth is beginning to diverge and fewer stocks are driving the rally, market participation is waning. This divergence could be an early sign of exhaustion unless broad participation picks up again soon.
Keep a close eye on breadth indicators like advancing volume, new highs/lows, and the percentage of stocks above key moving averages for clues about the market's next move.
Next to read: Market Monitor News, May 21
208.44
-0.59 (-0.28%)
528.77
+1.47 (+0.28%)
595.93
-0.16 (-0.03%)
Find more stocks in the Stock Screener
IWM Latest News and Analysis
 4 hours ago - ChartmillMarket Monitor Trends (SPY, QQQ, IWM) and Breadth June 05
Breadth readings remain firm for now, this appears to be a healthy pause, not a reversal.
 2 days ago - ChartmillMarket Monitor Trends (SPY, QQQ, IWM) and Breadth June 04
Both the QQQ and the SPY broke out above their main resistance levels today.
 3 days ago - ChartmillMarket Monitor Trends (SPY, QQQ, IWM) and Breadth June 02
The indices continue to quote close to their next resistance. While headline indices may show only minor daily fluctuations, the underlying breadth data paints a more fragile picture.
 6 days ago - ChartmillMarket Monitor Trends (SPY, QQQ, IWM) and Breadth May 30
The data from May 29, 2025, confirms that market breadth has rebounded significantly, with strong participation and improving technical metrics across shorter moving averages.
 7 days ago - ChartmillMarket Monitor Trends (SPY, QQQ, IWM) and Breadth May 29
The breadth indicators signal a fragile and reactive market environment, prone to sharp swings and lacking sustained leadership. Bullish momentum may struggle to gain lasting traction.
 8 days ago - ChartmillMarket Monitor Trends (SPY, QQQ, IWM) and Breadth May 28
The May 27 surge in breadth confirms the bullish price action observed across major indices on that day, reinforcing the move’s credibility.
 10 days ago - ChartmillMarket Monitor Trends (SPY, QQQ, IWM) and Breadth May 26
The latest data show a market that is weakening internally, with fewer stocks supporting any upside and an increasing tilt toward broad-based selling.
 13 days ago - ChartmillMarket Monitor Trends (SPY, QQQ, IWM) and Breadth May 23
The market is in a cautious phase with waning momentum.
 14 days ago - ChartmillMarket Monitor Trends (SPY, QQQ, IWM) and Breadth May 22
The broad-based selling on May 21 wasn't a surprise, it was preceded by several days of narrowing breadth.
 15 days ago - ChartmillMarket Monitor Trends (SPY, QQQ, IWM) and Breadth May 21
While the major indices are holding up, breadth is beginning to diverge and fewer stocks are driving the rally, market participation is waning.
 16 days ago - ChartmillMarket Monitor Trends (SPY, QQQ, IWM) and Breadth May 20
Markets continued to show resilience at the start of the week, with all major indices maintaining their short-term bullish trends.
 17 days ago - ChartmillMarket Monitor Trends (SPY, QQQ, IWM) and Breadth May 19
The short-term trend remains bullish across all major indices, supported by strong market breadth and price action.
