US Market Update DIA QQQ IWM SPY
Last update: Sep 26, 2022
Big tech stocks went down heavily and the price of oil is at its lowest level since January 2022.... Fear of recession is omnipresent and weekly losses for major US index ETFs ranged from -4% (Dow Jones) to -6.4% (Russel 2000).
Technical outlook SPY, QQQ, DIA and IWM on a weekly timeframe
SPY | QQQ | DIA | IWM
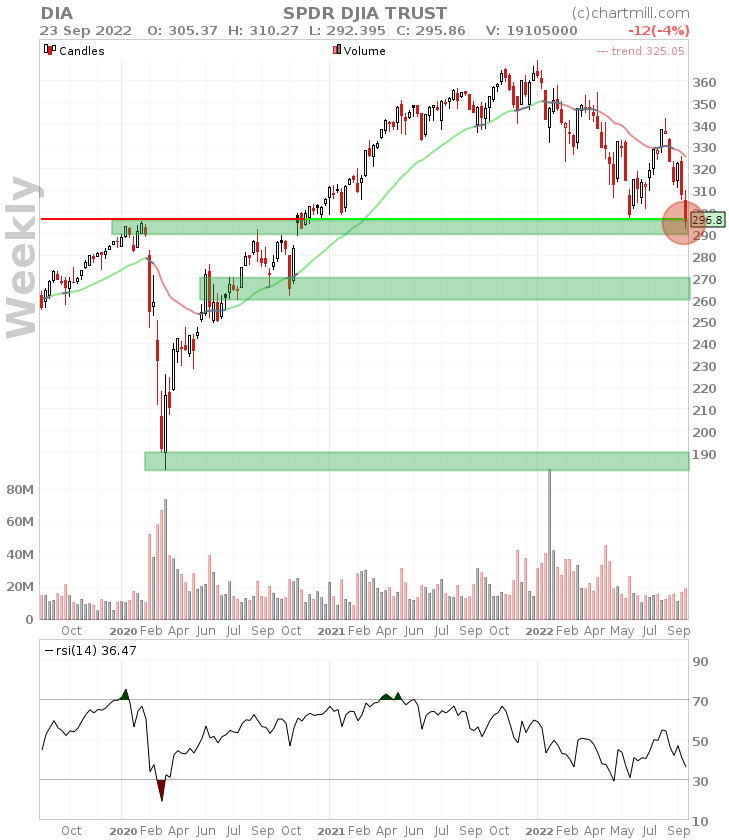
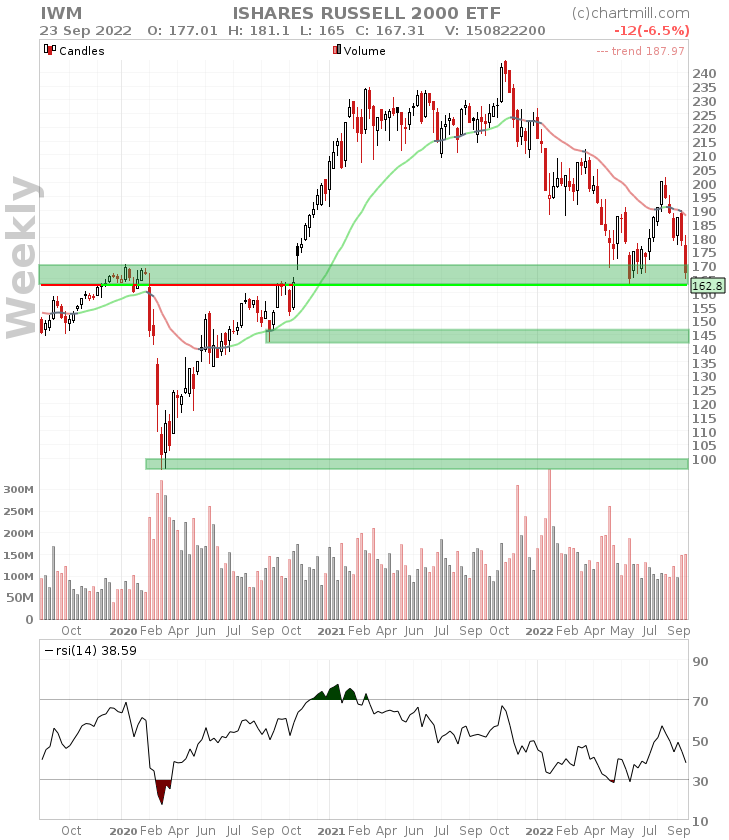
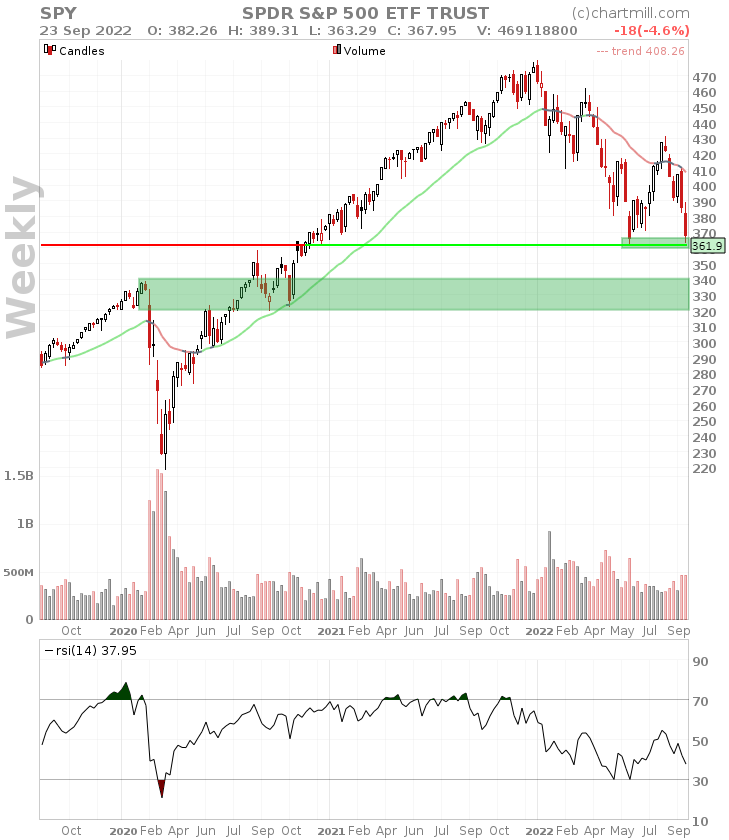
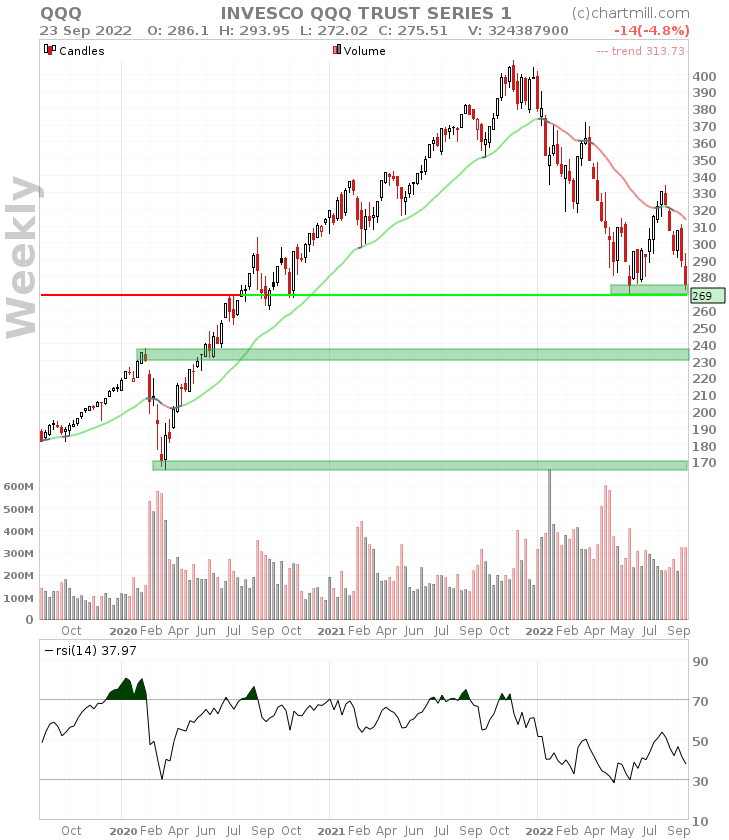
ChartMill Trend Indicator: RED (negative)
Stage Analysis phase: 4 (declining)
With the latest weekly close, we have provisionally arrived at scenario 2 (see our market update last month 2022/08/29), being the formation of a possible double bottom. The key question now is whether prices manage to stabilize around this level or whether we get further downward movement.
Technically, the DIA looks the worst, following last week's close on a weekly basis below the previous swing low. This opens the way to the next price technical support level around $260-$270.
For the SPY, QQQ and IWM, the mid-June swing low is still valid. We are especially curious to what extent this support level can play a significant role in the coming weeks.
After the interest rate decision in the US last week, this week all eyes are on the Eurozone inflation figure to be announced this Friday. Inflation is expected to rise sharply in September (9.7%), that figure was at 9.1% in August....
Perhaps even more important than the inflation rate itself, will be how Europe succeeds or fails to take measures to slow the further rise in energy prices. That would undoubtedly be an important structural step to dampen a further rise in inflation.
In any case, we can conclude that the fledgling neutral long-term trend from our previous market update should once again give way to a clear downward trend. For now, we have little choice but to remain patient and wait for better times.
261.35
-0.15 (-0.06%)
626.24
-0.93 (-0.15%)
693.77
-1.39 (-0.2%)
491.94
-3.96 (-0.8%)
Find more stocks in the Stock Screener