
(All data & visualisations by ChartMill.com)
Daily Market Trend Analysis – July 07, 2025 (After Market Close)
First decline after six consecutive days of gains for SPY.
Short Term Trend
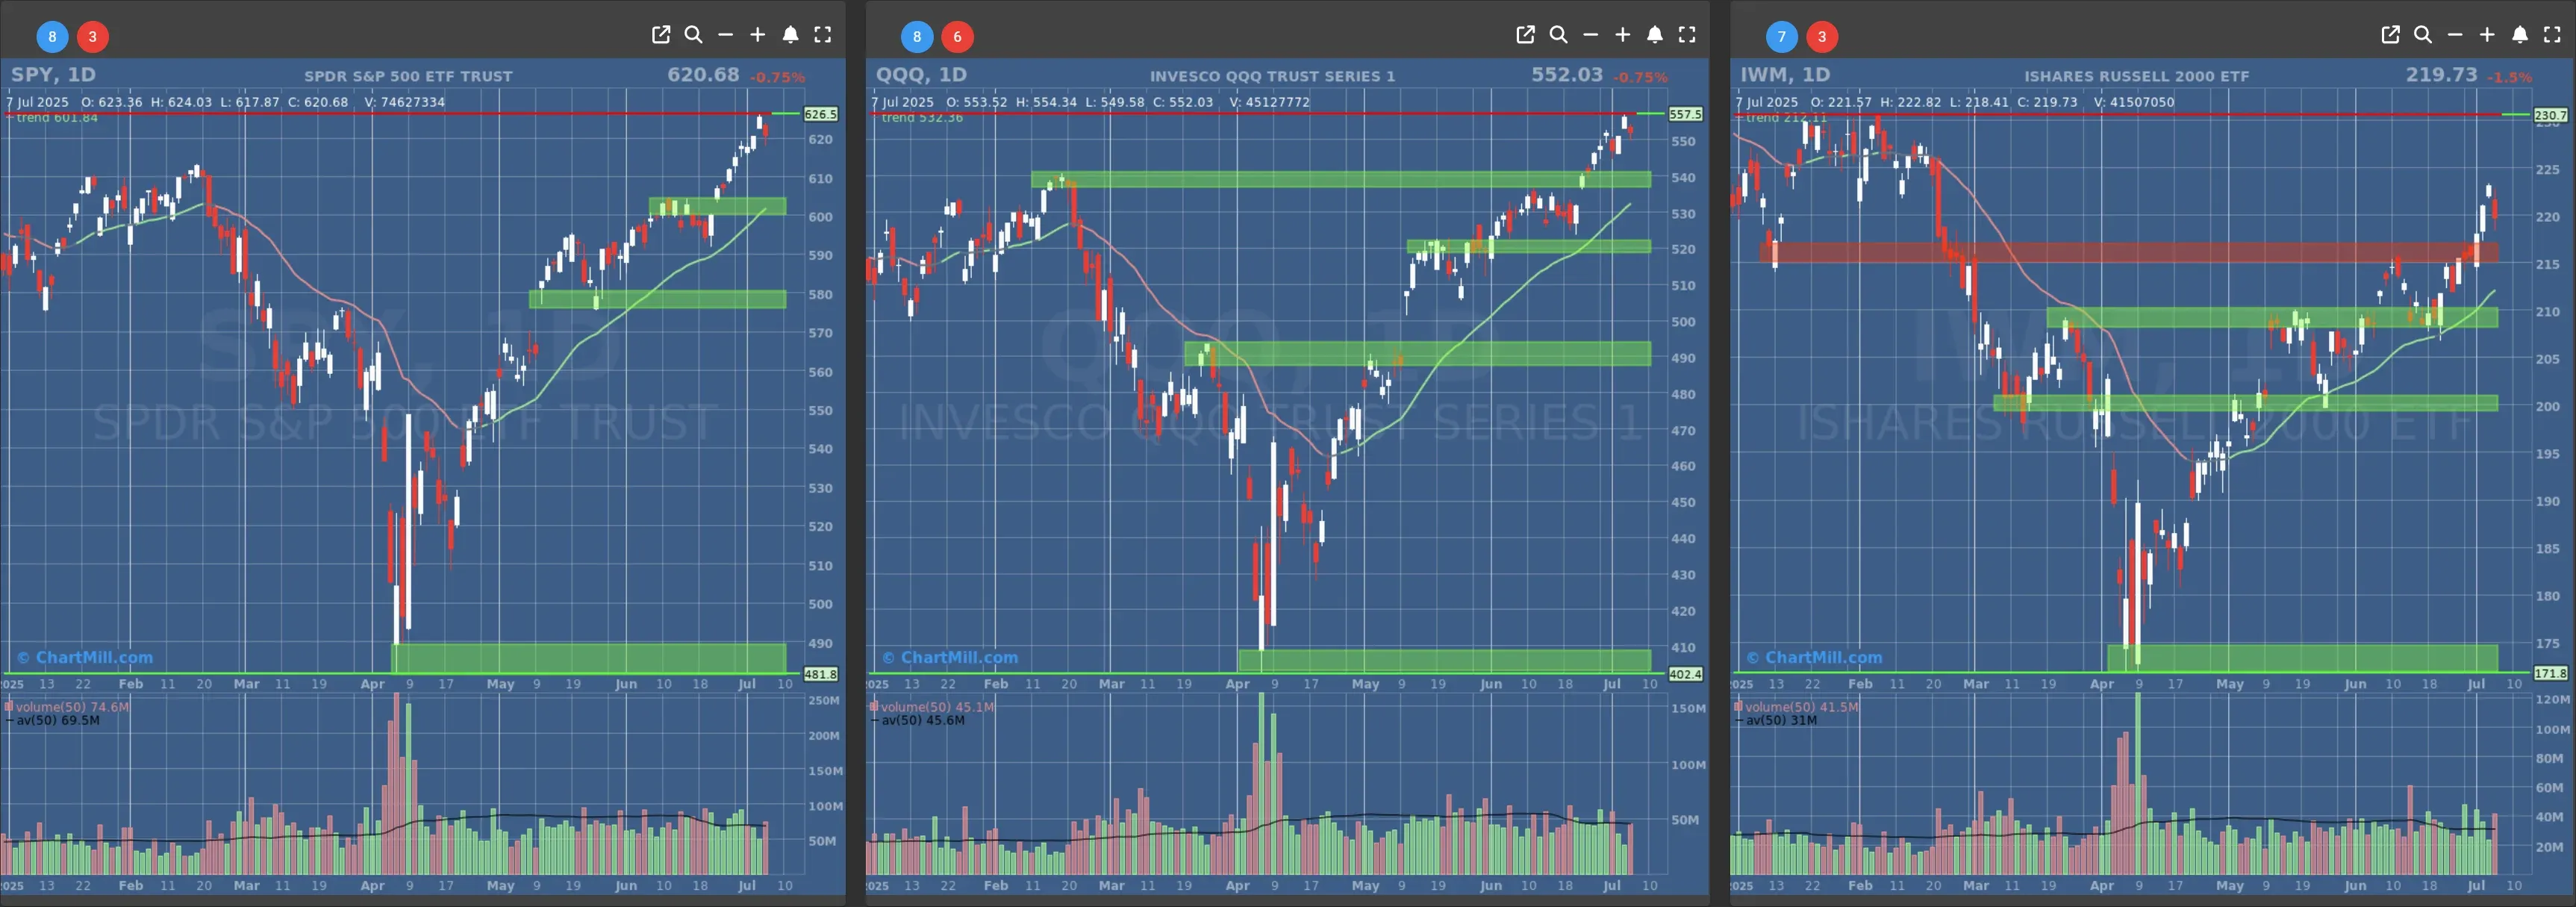
- Short-Term Trend: Bullish (no change)
- Next Support at $600 to $610
- Next Resistance at /
- Volume: Slightly Above Average (50)
- Pattern: Down Day
- Short-Term Trend: Bullish (no change)
- Next Support at $540
- Next Resistance at /
- Volume: At Average (50)
- Pattern: Down Day
- Short-Term Trend: Bullish (no change)
- Next Support at $210
- Next Resistance at $215 to $220
- Volume: Significant Above Average (50)
- Pattern: Down Day
Long Term Trend

- Long-Term Trend: Positive (no change)
- Long-Term Trend: Positive (no change)
- Long-Term Trend: Positive (changed from neutral) - CONFIRMED
Daily Market Breadth Analysis – July 07, 2025 (After Market Close)
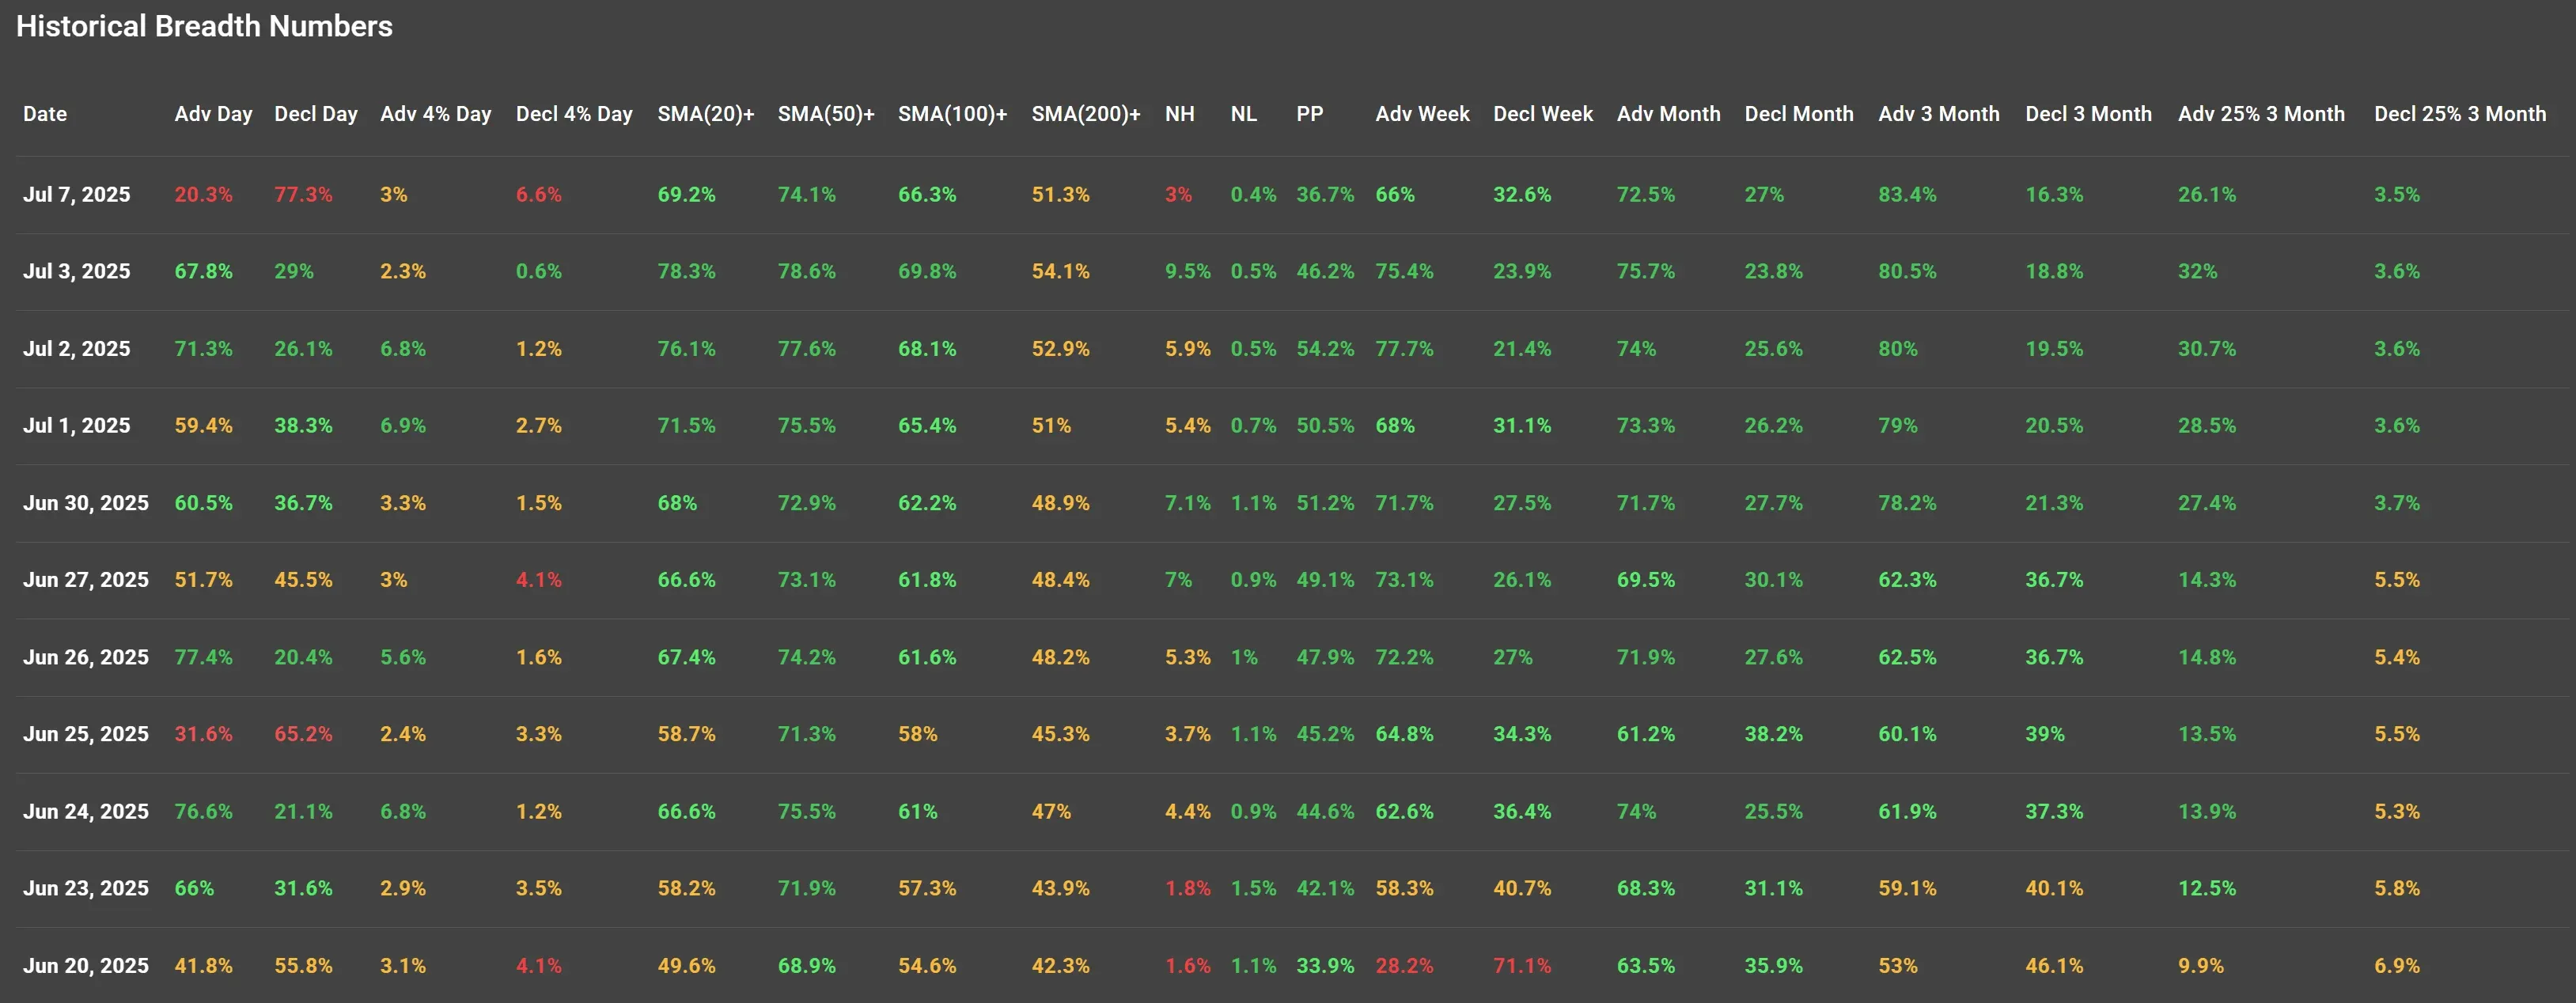
Monday, July 7th gave us a stark reminder that breadth doesn’t lie, even when the indices only slide modestly. Under the hood, the internals cracked hard, suggesting the sharp pullback wasn’t just headline-driven (tariff threats, anyone?) but structurally significant in the short term.
Let's dig into the numbers and see what changed and what didn’t.
A Sharp Reversal in Participation
Let’s not sugarcoat it: Monday's breadth numbers were a mess.
-
Only 20.3% of stocks advanced on the day, while a whopping 77.3% declined.
-
Even more telling: just 3% of stocks rose more than 4%, while 6.6% dropped by at least that amount.
This is a dramatic reversal from last Thursday (July 3), where 67.8% advanced and only 29% declined.
This kind of deterioration in a single session usually signals risk-off behavior, possibly driven by systematic selling or broad ETF outflows.
Short-Term Momentum Rolls Over
Looking at short-term trend strength:
-
SMA(20)+ dropped to 69.2% from 78.3% — the first notable dip in 4 sessions.
-
SMA(50)+ and SMA(100)+ also rolled over slightly: 74.1% and 66.3%, respectively.
While still strong overall, these moving average metrics are starting to flatten. Not a red flag yet, but definitely something to keep an eye on.
This loss of momentum mirrors the macro backdrop—rising uncertainty about tariffs and geopolitical positioning clearly led to positioning pullbacks.
New Highs Collapse, But No Panic Yet
- New Highs (NH) collapsed to 3%, down from 9.5% on July 3. But importantly, New Lows (NL) only ticked up marginally to 0.4%.
Translation? Selling pressure hit leaders, not laggards (for now). The market didn’t fall apart; it just recoiled. That distinction matters.

Weekly and Monthly Trends Still Hold
The weekly breadth stats held up surprisingly well despite Monday's carnage:
-
66% of stocks are still up on the week vs. just 32.6% down.
-
Over the past month, 72.5% are still net gainers.
This speaks to a broader uptrend that hasn’t been broken by one bad day. A bigger concern would be consecutive down days with deeper volume erosion, something we haven’t yet seen.
Longer-Term Outlook Still Constructive
The 3-month participation metrics stayed largely intact:
-
Advancing 3-Month: 83.4% (up from 80.5%)
-
Declining 3-Month: 16.3%
-
25%+ Gainers (3M): 26.1%, modest, but healthy
-
25%+ Losers (3M): Still a benign 3.5%
In plain English: despite Monday’s hit, the longer-term leadership is holding strong.
My Take
One rough breadth day does not equal a trend change, but it does give us a warning shot. This kind of under-the-surface weakness can either get reversed quickly (if macro fears ease), or deepen fast (if the tariff rhetoric escalates).
Keep an eye on follow-through: if we see another sub-30% advancer day with growing new lows, it might be time to get defensive.
But for now, the path of least resistance - particularly over a 1–3 month horizon - still leans bullish.
Kristoff - Co-founder, ChartMill
Next to read: Market Monitor News, July 08