
Latest news US equity markets
Last Friday, the financial markets were startled by the speech of the FED Chairman, Jerome Powell, who made it clear that keeping interest rates high is necessary to temper inflation. The fact that the inflation rate fell in July for the first time in a long time is encouraging, but it is far from sufficient to assume that the inflation beast has been defeated.
Powell hinted at an extended period of weaker growth and a slumping labor market, not hiding the fact that this will be difficult for both companies and households. But there is no alternative, desperate times call for desperate measures...
Powell referred to the situation in the 1970s where the situation got completely out of hand because action was not taken quickly enough.
All eyes are currently on the August inflation figure to be published on September 13, which is undoubtedly a hot item on many investors' calendars...
Technical outlook SPY, QQQ, DIA and IWM on a weekly timeframe
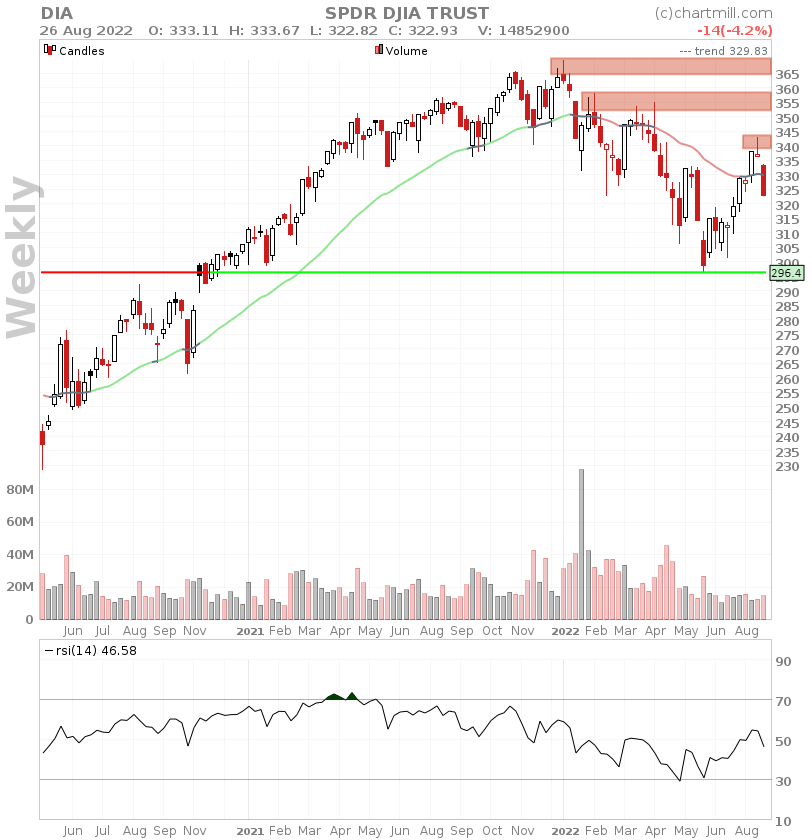
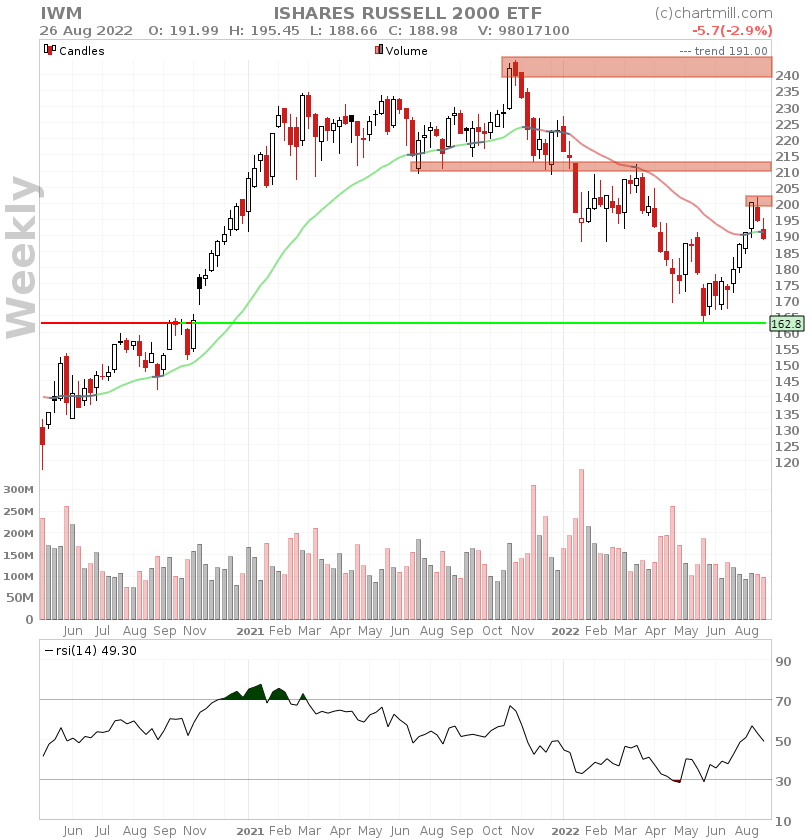
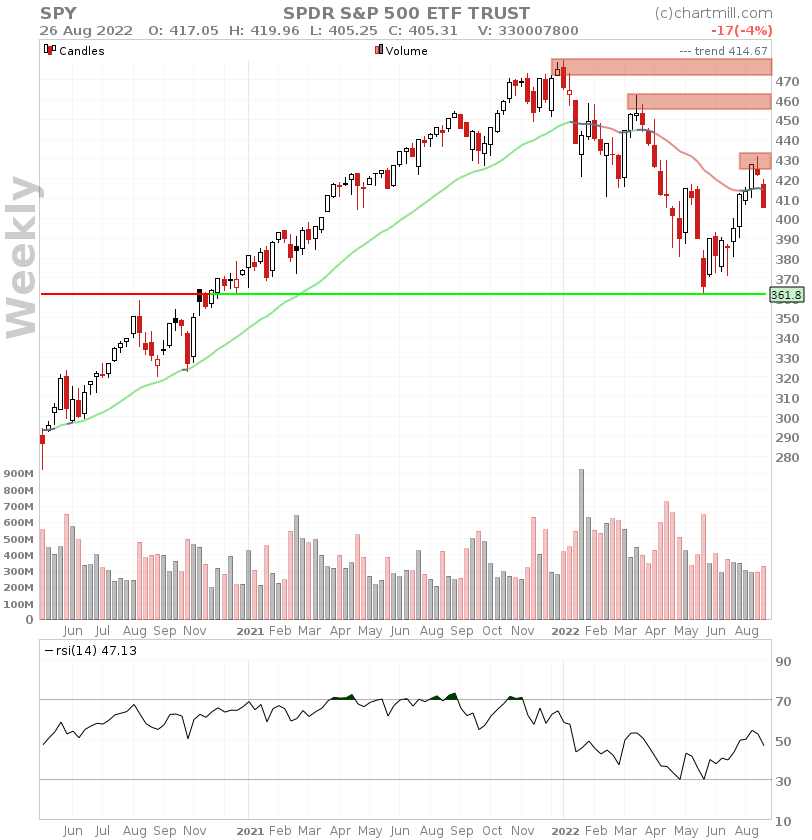
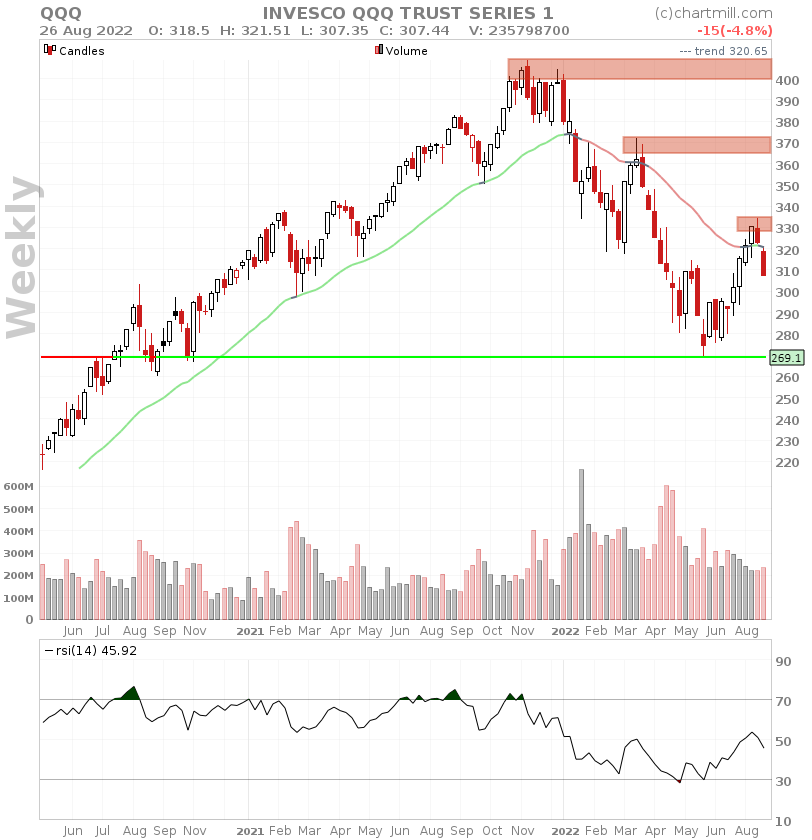
SPY | QQQ | DIA |IWM
ChartMill Trend Indicator: GREY (neutral)
Stage Analysis phase: 4 (declining) with some very early signs of a possible stage 1
After a fairly impressive recovery since late June early July in which the long-term trend for both technology stocks and small caps changed to positive, we now observe clear technical reversal patterns on all indices with last week's bearish candles whose price closed at the low of week.
For all U.S. indices, the long-term trend is now in neutral territory (ChartMill trend indicator is gray).
There is a significant chance that we will see further downward price pressure in the coming weeks, especially as the August inflation figure published on September 13 is very much awaited. Also keep in mind that nervous investors will undoubtedly create some more volatility.
For the further course of events, we take 4 possible scenarios into account:
Scenario 1 - Formation of first higher price bottom
The formation of a first higher bottom is the most ideal scenario from a bullish perspective (this higher bottom will then ultimately have to be followed - for confirmation - by a close above the next horizontal resistance zone).
Scenario 2 - Formation of a double bottom
Either the momentum is so strong that first we get a retest of the most recent lows whereby a double bottom is formed (near the horizontal green line).
Scenario 3 - New sell-off
In this scenario the price quickly drops below the current lows in the coming weeks and goes a lot deeper. However, this scenario seems the least likely based on the current charts. The reason for this is the selling volume, which during the decline of the past two weeks have been significantly lower than during the previous selling waves in January and April/May. On the other hand, the buying volume during the recent recovery were not impressive either...
Scenario 4 - Recovery above the current highs
In which the price quickly rises above the current highs, completely contrary to current expectations. Technically, this would be a strong signal as it would create a first higher high in a long-term downtrend. That is why we consider this scenario at least as unlikely as scenario 3.