
(All data & visualisations by ChartMill.com)
Daily Market Trend Analysis – July 08, 2025 (After Market Close)
Low volume and 'Inside Day' candles...
Short Term Trend

- Short-Term Trend: Bullish (no change)
- Next Support at $600 to $610
- Next Resistance at /
- Volume: Far Below Average (50)
- Pattern: Inside Day - Down Day
- Short-Term Trend: Bullish (no change)
- Next Support at $540
- Next Resistance at /
- Volume: Far Below Average (50)
- Pattern: Inside Day - Down Day
- Short-Term Trend: Bullish (no change)
- Next Support at $210
- Next Resistance at $215 to $220
- Volume: Far Below Average (50)
- Pattern: Inside Day - Down Day
Long Term Trend

- Long-Term Trend: Positive (no change)
- Long-Term Trend: Positive (no change)
- Long-Term Trend: Positive (changed from neutral) - CONFIRMED
Daily Market Breadth Analysis – July 08, 2025 (After Market Close)
While Wall Street drifted sideways on July 8, digesting geopolitical noise around tariffs and solar energy crackdowns, the internal health of the market - its breadth - remained surprisingly resilient.
Let's break down what the data tells us beneath the surface of the major indices.
Solid Breadth, Quiet Price Action
Although the major indices barely moved, market breadth on July 8 was fairly constructive:
-
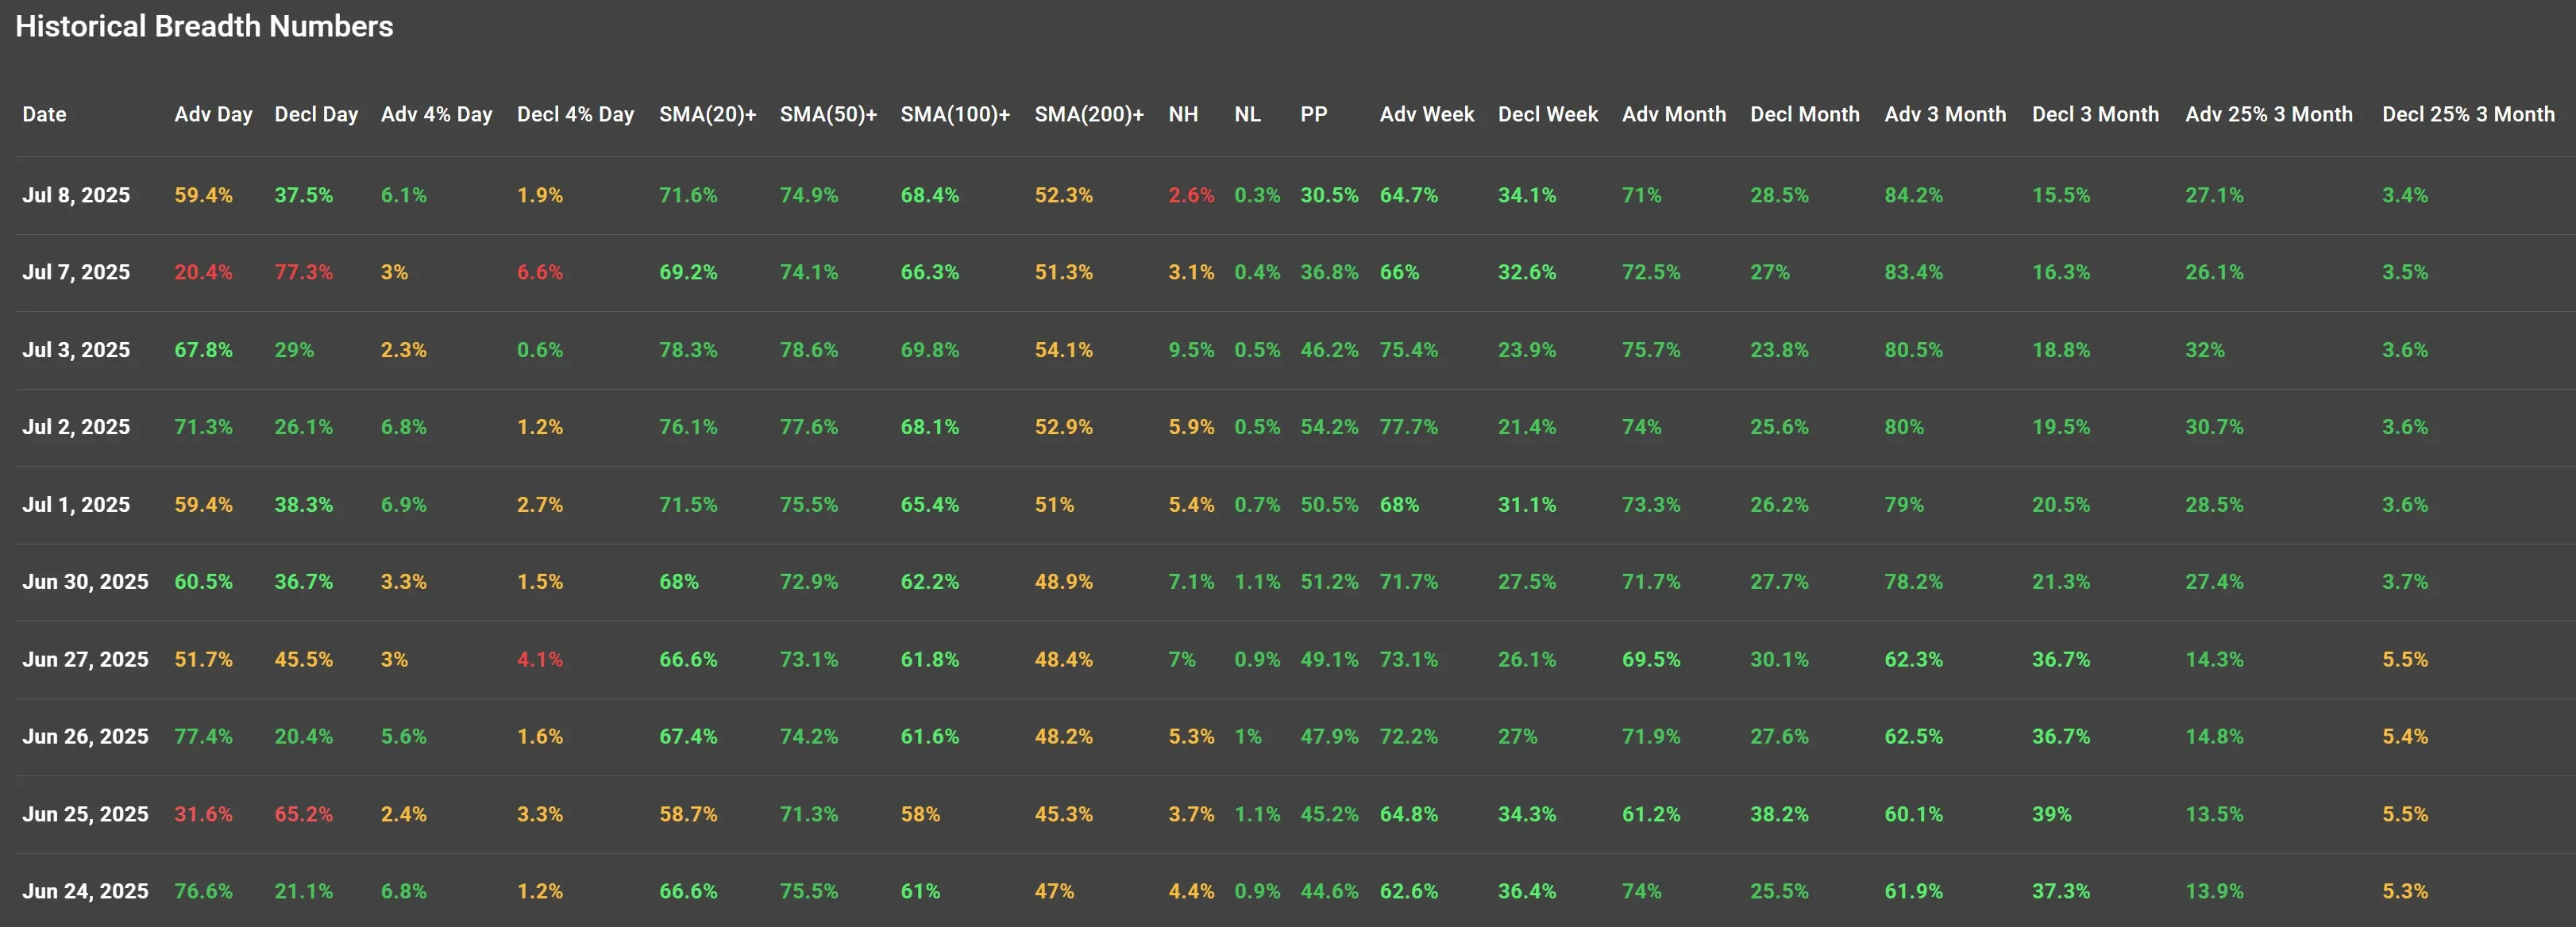
59.4% of stocks advanced, up significantly from the bruising 20.4% seen on July 7.
-
Only 37.5% declined, reversing the prior session’s 77.3% wipeout.
-
High-momentum movers (+4% or more): 6.1% of stocks
-
Significant decliners (−4% or more): 1.9%
The contrast with July 7 is dramatic. That session stood out as a capitulation-type selloff, so it’s not surprising that we saw a reflexive rebound yesterday. However, this bounce came with modest enthusiasm, which may indicate more of a technical reset than a new leg higher.
Momentum Still Intact But Flattening?
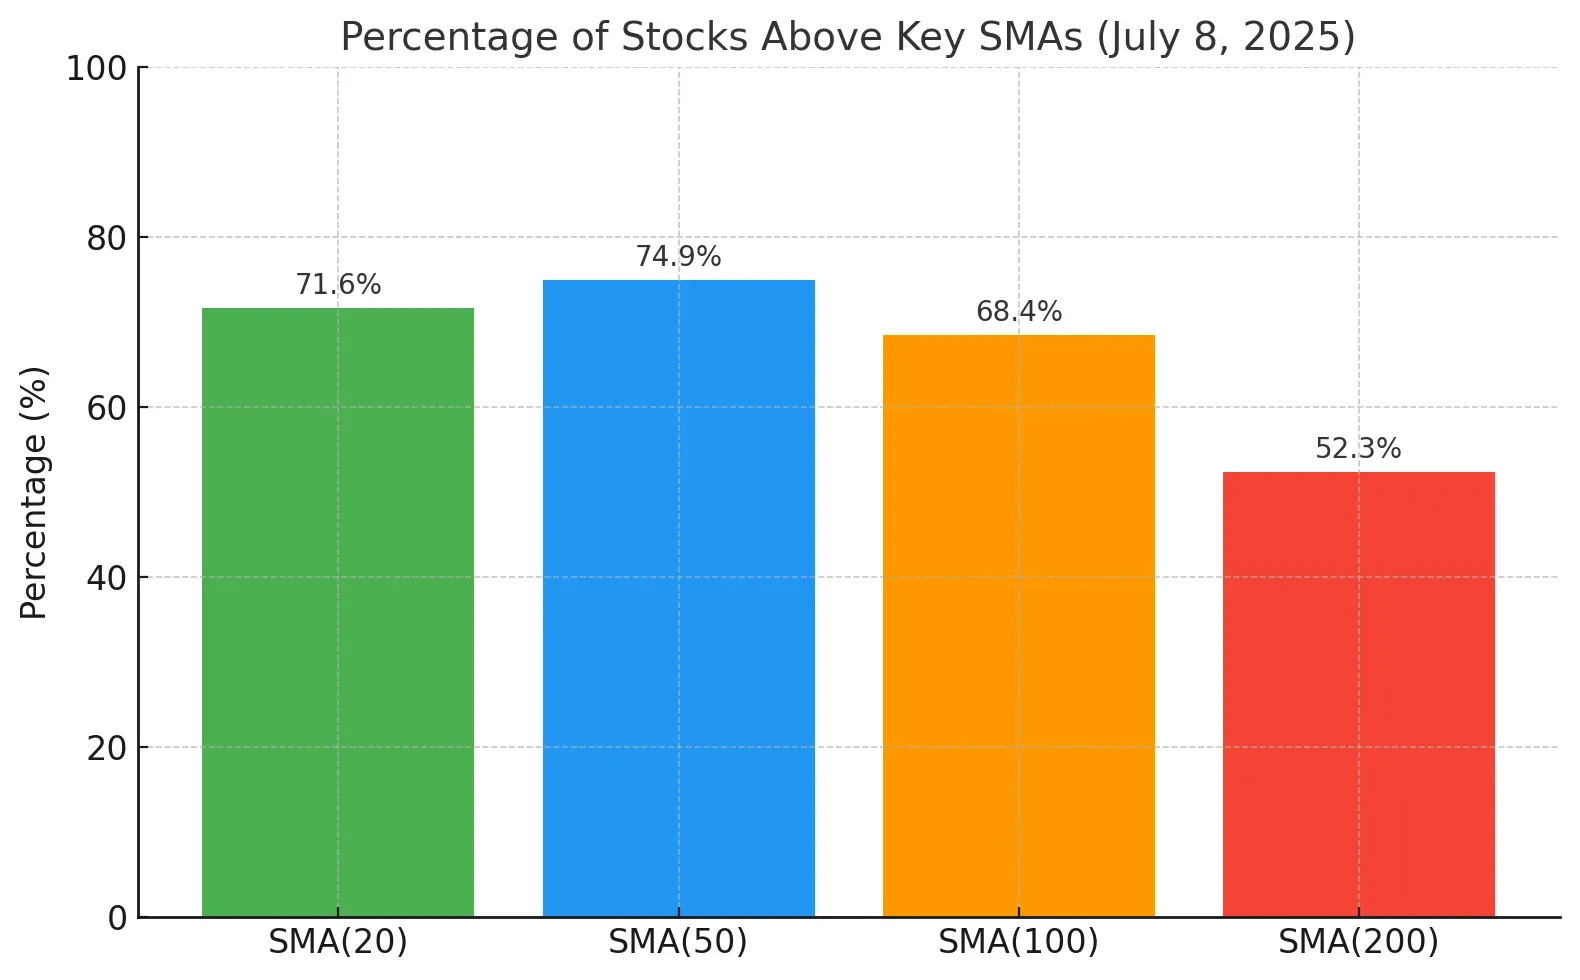
A look at stocks above key moving averages shows we're still in a bullish phase, though upside momentum may be stalling a bit:
-
71.6% above 20-day MA (up slightly from 69.2% on Jul 7)
-
74.9% above 50-day MA (flat vs. Jul 7)
-
68.4% above 100-day MA (slightly higher)
-
52.3% above 200-day MA, holding above the key 50% level but showing signs of fatigue
The fact that the 200-day breadth has hovered just above the 50% line for five consecutive sessions suggests the broader trend remains up, but it’s slowing.
Leadership Narrowing?
The percentage of stocks making new highs (NH) dropped to just 2.6%, a notable dip from 3.1% the previous day and a peak of 9.5% on July 3.
Meanwhile, new lows (NL) stayed negligible at 0.3%. This contraction in new highs shows fewer stocks are leading, a potential warning sign.
This decline in new highs during a bounce-back day hints that breadth is improving, but leadership is narrowing, which could translate into a thinner rally or sideways movement.
Longer-Term Breadth: No Breakdown, No Breakout
-
Advancing issues over the past week: 64.7% (vs. 66% on Jul 7)
-
Advancing over the month: 71% (flat)
-
Over 3 months: 84.2% (also flat)
There’s no denying that breadth remains strong when zoomed out, but it’s not accelerating. The month- and quarter-long metrics are plateauing, signaling a market that is likely consolidating after its recent gains.
Quick Take: Don’t Chase, But Don’t Bail Either
After Monday’s selloff - one of the weakest breadth days in recent memory - Tuesday’s (July 8) session brought a meaningful recovery, with nearly 60% of stocks advancing and only minor participation from decliners.
However, it’s worth keeping perspective: last Friday, July 4, markets were closed for Independence Day, and the session prior to that (Wednesday, July 3) was notably strong, with 67.8% of stocks advancing and only 29% declining. That bullish tone was completely reversed Monday before stabilizing again Tuesday.
So, what we're seeing is not necessarily a new directional trend, but rather a back-and-forth between fear-driven selling and technical mean reversion.
The takeaway? Market breadth remains solid on a multi-day basis, but momentum is choppy. It’s a classic case of:
“Don’t chase short-term rebounds too aggressively, but don’t panic and jump ship either.”
The broader setup still favors bulls, but with caution and selectivity.
Final Word
Market breadth tells me the engine is still running, but maybe not at full speed. We’ve got resilience, yes.
But until leadership firms up and momentum kicks in again, I’d approach new positions with selectivity. Watch for whether this bounce attracts broader participation or stalls out.
Kristoff - Co-founder, ChartMill
Next to read: Market Monitor News, July 09