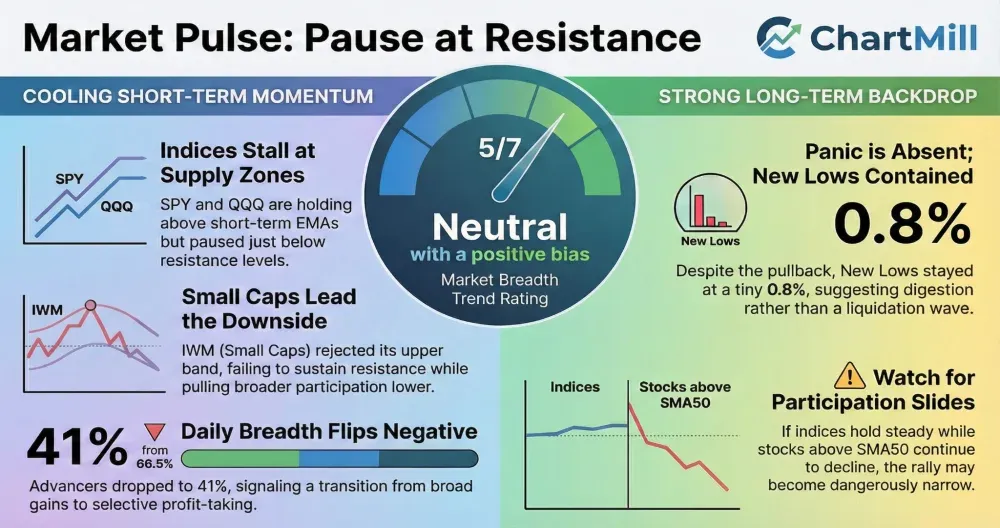
Friday’s session saw a clear short-term breadth fade after two strong days, while SPY and QQQ largely held their ground near resistance. Small caps (IWM) did the heavy lifting on the downside, rejecting the upper band and pulling participation metrics lower, but longer-term breadth and the monthly backdrop remain constructive.
Index overview (SPY, QQQ, IWM)
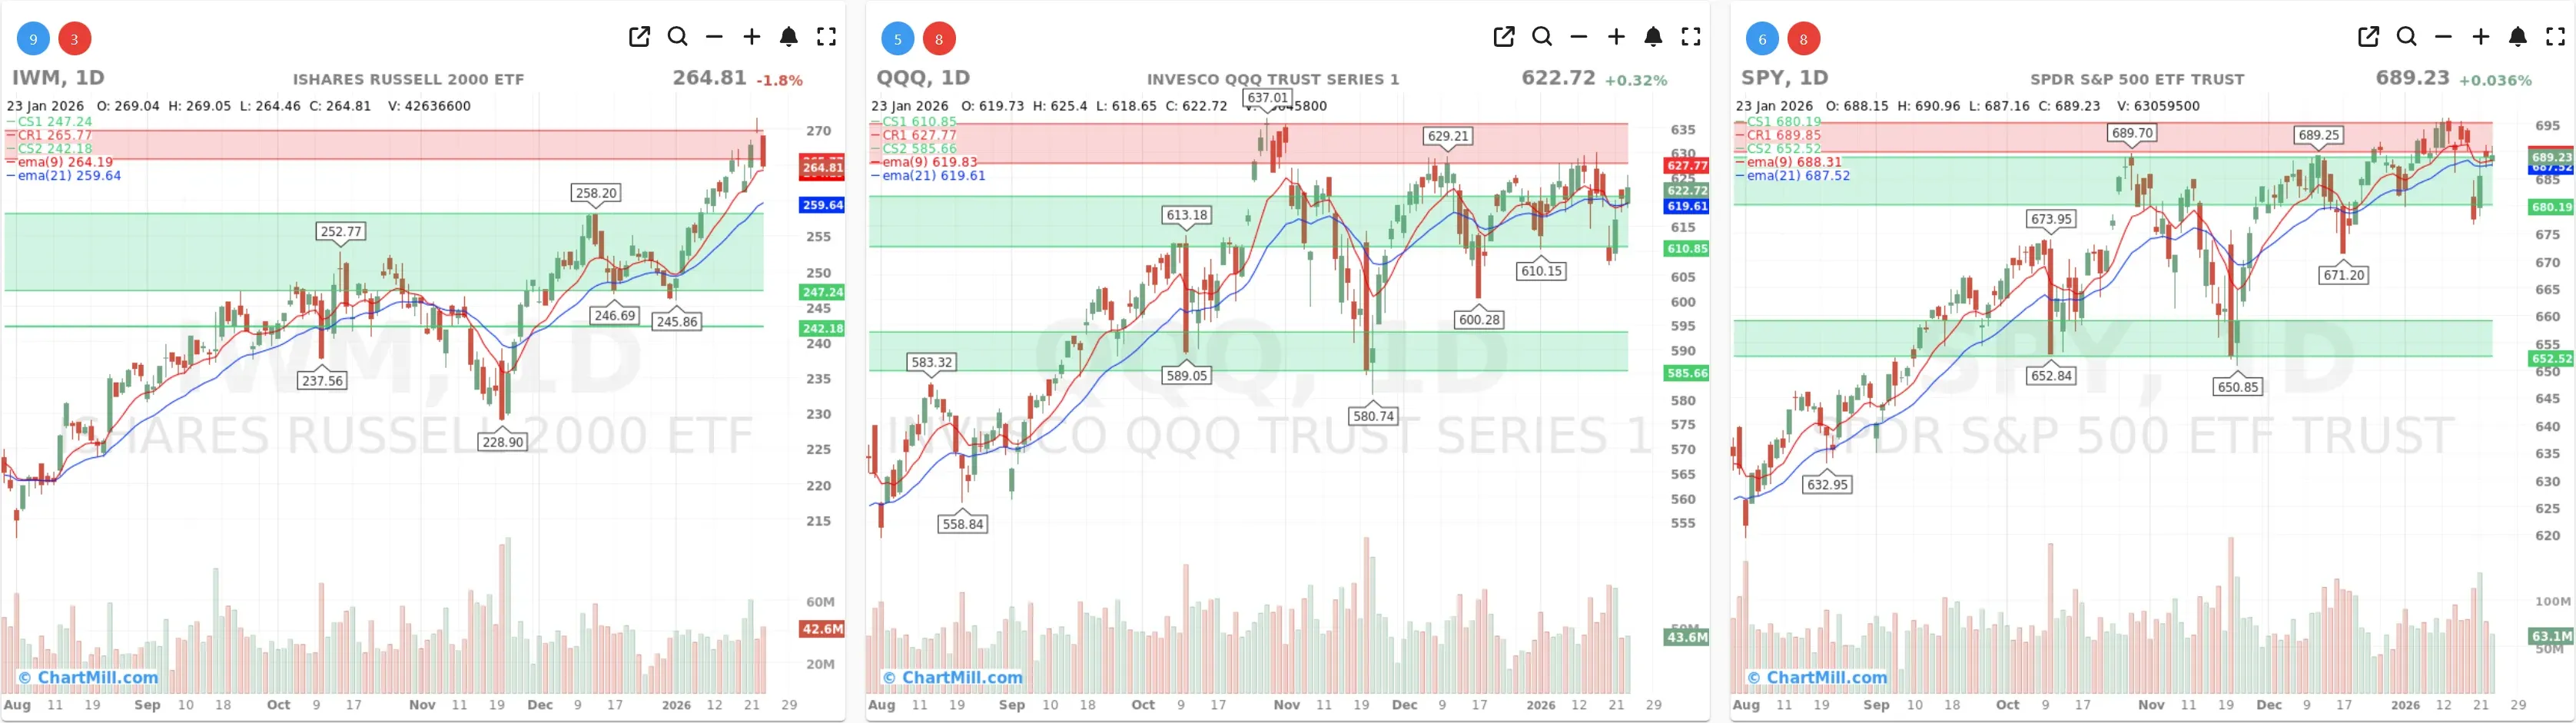
Short Term (Daily)
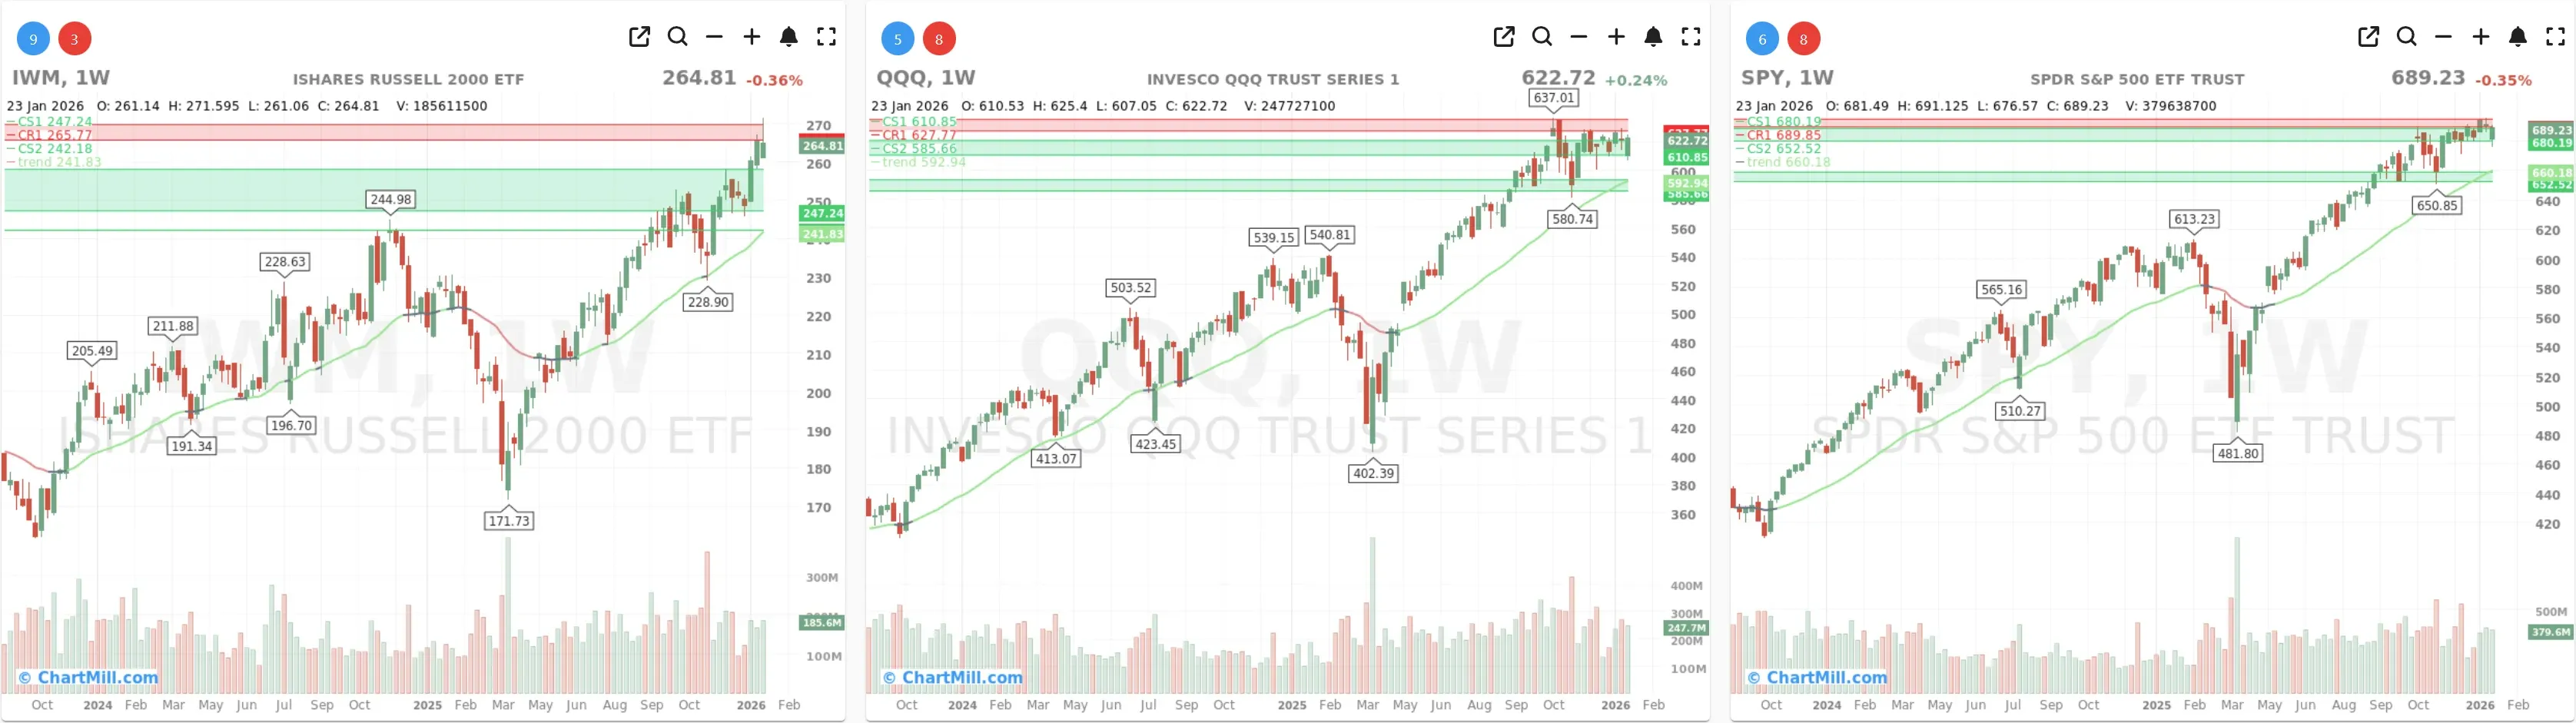
Long Term (Weekly)
SPY
Daily: SPY closed at 689.23, still above EMA9 (688.31) and EMA21 (687.52), but stalling just below resistance (CR1 ~689.85). The takeaway: trend is intact, but momentum is pausing right where it should, near a supply zone.
Weekly: The Trend Indicator remains green (30-week EMA around 660.18). Price is extended but not breaking down, this looks more like consolidation at highs than a trend change.
QQQ
**Daily:**QQQ closed at 622.72, above EMA9/EMA21 (~619.8 / ~619.6) and again below resistance (CR1 ~627.77). This keeps the market’s “leadership pocket” firm even while broader participation cooled.
Weekly: Trend remains green (30-week EMA around 592.94). As long as QQQ holds above the 610–620 area on pullbacks, the larger uptrend remains in control.
IWM
Daily: IWM was the weak spot, closing 264.81 after testing the upper band. It’s still just above EMA9 (264.19) and above EMA21 (259.64), but importantly it failed to sustain above resistance (CR1 ~265.77).
Weekly: Trend is still green (30-week EMA ~241.83), yet the week showed rejection from higher levels (high near 271.6). That’s not bearish by itself, but it does signal overhead supply and a likely digestion phase after the recent push.
Link to last thursday (Jan 22): Thursday’s breadth strength suggested a market ready to continue higher with improving participation. Friday didn’t invalidate the bigger picture, but it pushed price into resistance and breadth backed off, with small caps absorbing most of the pressure. Net: uptrend intact, but the “easy” upside is less immediate.
Market breadth dashboard (Jan 23 close)

Daily breadth flipped negative (short-term cooling)
-
Advancers: 41% vs Decliners: 56.1% → a clear reversal from Thursday’s broad gain (66.5% advancers).
-
Big movers (>4%) stayed muted: 2.9% up vs 3.2% down.
Despite more decliners, the market didn’t show “panic-style” distribution. It was more grindy profit-taking / rotation than a liquidation wave.
Participation in the trend is still good, but slipping
Stocks above key moving averages remain healthy, though most eased versus the prior day:
-
Above SMA20: 65.6% (down from 68.9%)
-
Above SMA50: 67.4% (down from 68.5%)
-
Above SMA100: 58.4% (down from 59.8%)
-
Above SMA200: 62.7% (down from 63.6%)
The market remains broadly “in trend,” but participation is no longer expanding. That’s typical when indices press into resistance and leadership narrows.
New highs cooled, but new lows stayed very contained
-
New Highs: 7.7% (down from 13.7%)
-
New Lows: 0.8% (still very low)
This is one of the most constructive tells in the whole table: weak breadth day, but no meaningful expansion in new lows. That strongly supports a pullback-as-digestion narrative.
Multi-timeframe breadth: week turned soft; month still strong
-
Week: 45.7% advancing vs 52.8% declining → weekly breadth slipped back negative.
-
Month: 67.9% advancing vs 31.5% declining → monthly breadth remains decisively positive.
-
3-month: 53.6% advancing vs 45.3% declining → still positive, but not as dominant.
-
25% movers (3-month): 10.9% up vs 11.1% down → basically flat/slightly negative, hinting that big winners are not overwhelming big losers lately.
What it means (context + conclusion)
Friday looks like a classic “pause at resistance” session:
-
SPY and QQQ held near highs and stayed above their short-term EMAs.
-
IWM rejected the upper band, pulling breadth lower and suggesting small-caps leadership is less consistent right now.
-
Breadth cooled sharply versus Thursday, but the lack of expanding new lows argues against a breakdown.
Base case: a sideways-to-slightly-down digestion is more likely than an immediate acceleration higher, unless breadth quickly rebounds and new highs re-expand.
Risk to watch: if indices keep holding up but SMA20/SMA50 participation continues to slide, the rally becomes narrower and more fragile.
Breadth trend rating (1–7)
5 — Neutral, positive bias.
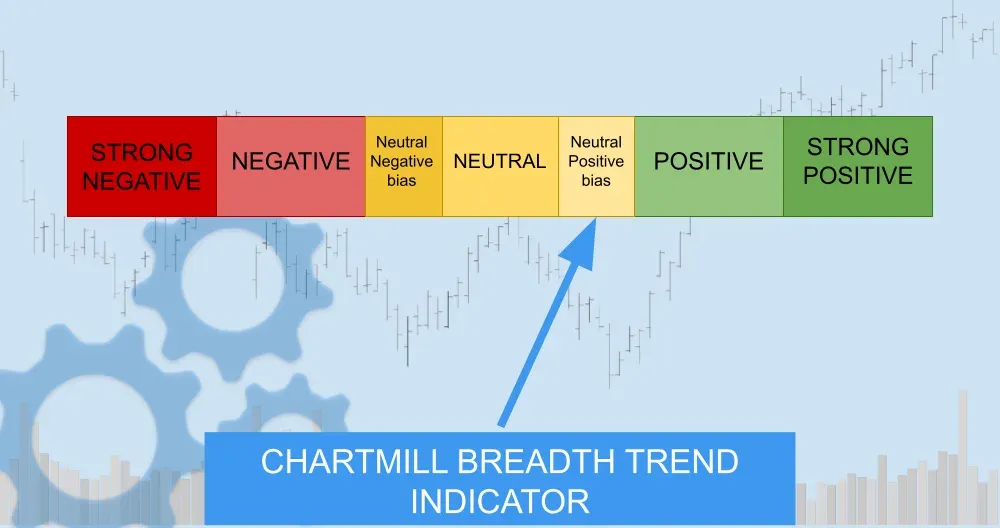
The longer-term trend and monthly breadth are still supportive, and new lows remain suppressed. But short-term participation rolled over into resistance and small caps weakened, so the market is constructive, not carefree.
Kristoff
Next to read: Tariffs, TikTok, and the Intel Tailspin