Stocks closed the week with the major index ETFs still pushing upward and this time the internals mostly kept pace. Participation above key moving averages improved again, new highs expanded, and small-caps (IWM) look like they’re finally pressing through a well-defined ceiling. The only real “yellow flag” I see is that upside thrust cooled a bit compared with the prior session, hinting at a steadier (less explosive) advance near resistance.
Index overview (SPY, QQQ, IWM)
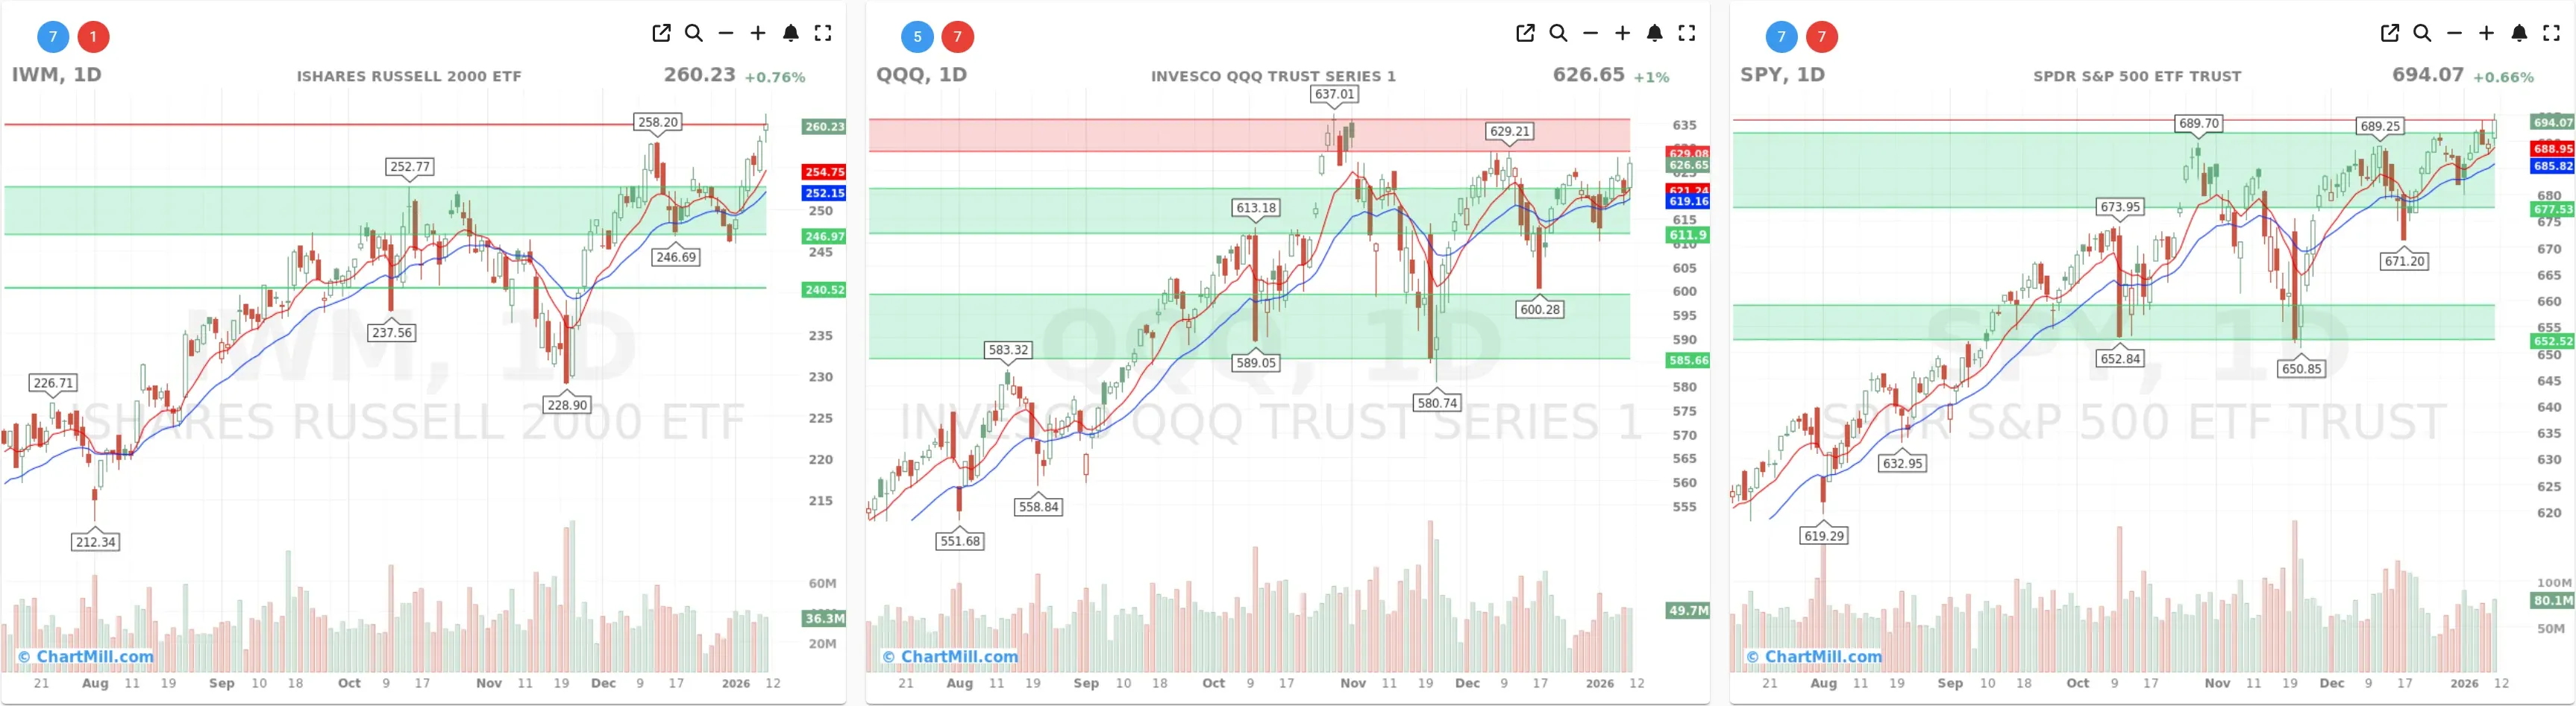
Short Term (Daily)
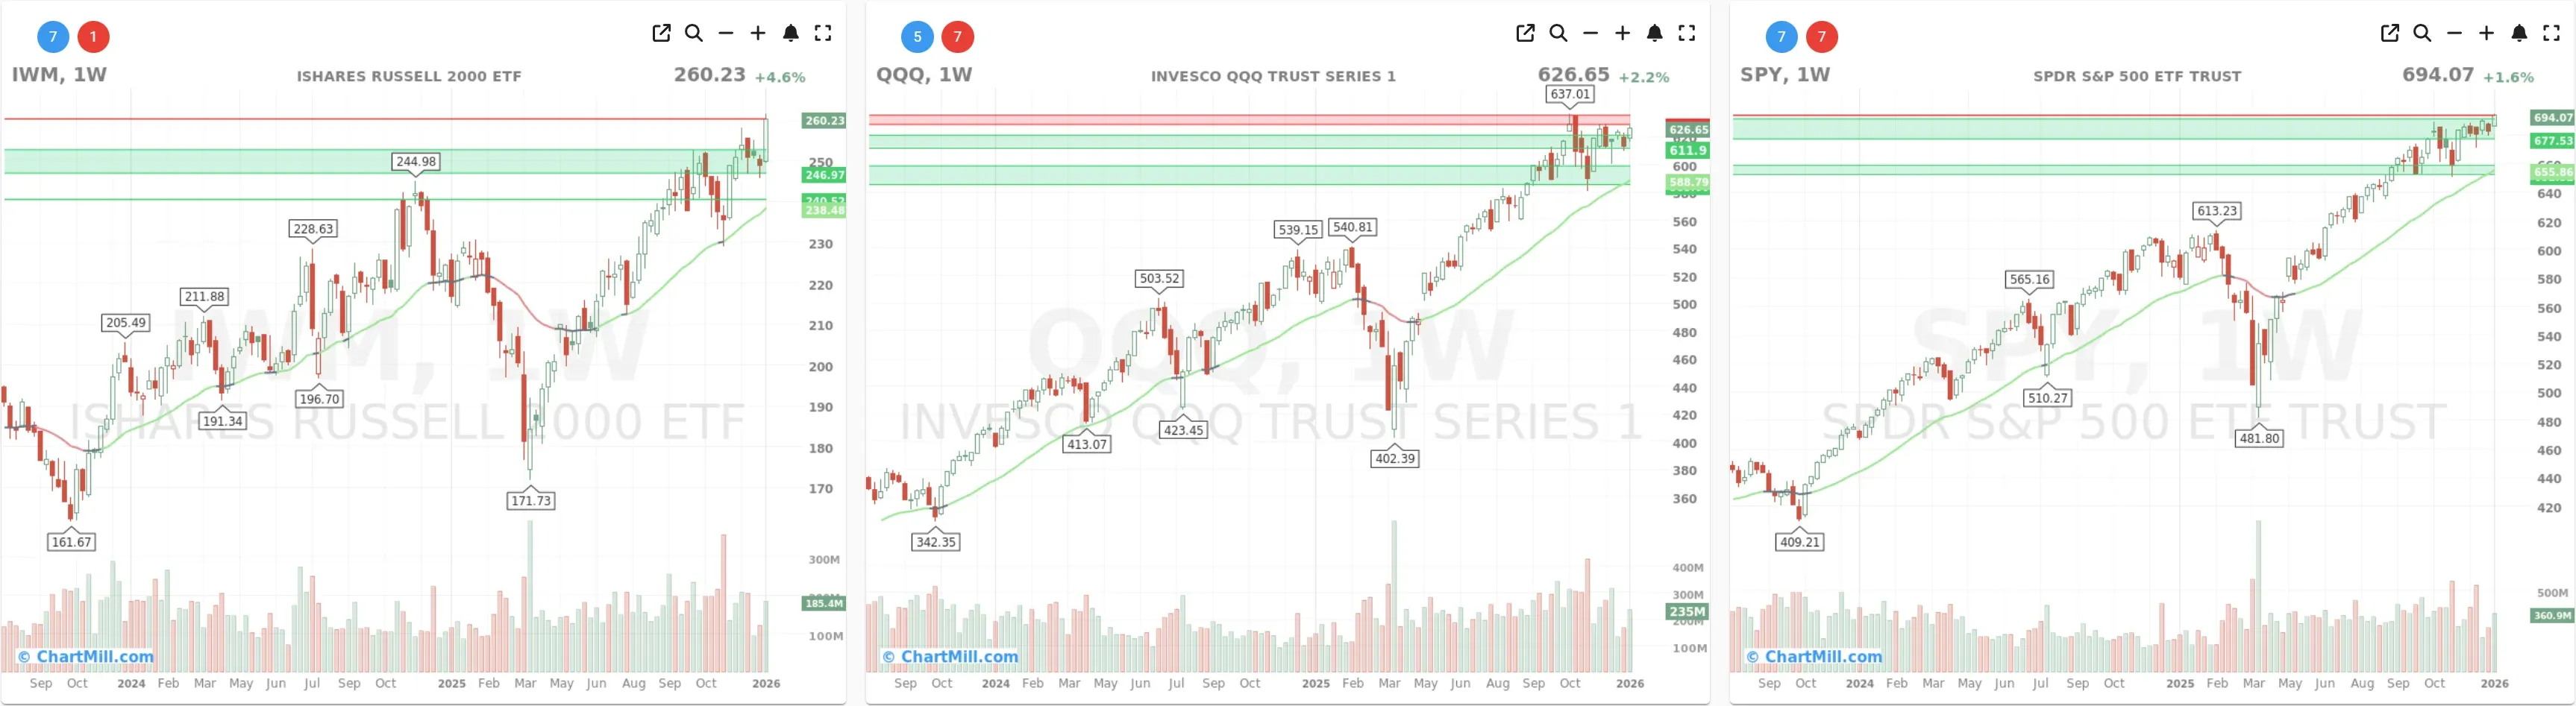
Long Term (Weekly)
SPY - Uptrend intact, pressing the upper band
SPY finished higher (694.07, +0.66%) and remains comfortably above both the EMA9 and EMA21 on the daily chart. The short-term averages are rising and price is holding above them, classic trend-following behavior. On the weekly chart, the long-term Trend Indicator stays green, reinforcing that the primary trend remains constructive. The only nuance: SPY is still operating near an upper “supply” zone, so continued progress likely depends on whether breadth keeps confirming.
QQQ - Grinding higher into overhead resistance
QQQ added about 1% (626.65) and is also holding above the EMA9/EMA21 on the daily. The pattern looks like a controlled push into a well-marked resistance area overhead (roughly the mid-630s). Weekly trend remains green, but this is the kind of location where leadership matters: if mega-cap strength continues, QQQ can chew through that zone. If not, we often see a pause or a choppier consolidation.
IWM - The standout, small-caps appear to clear the ceiling
IWM rose to 260.23 (+0.76%) and, importantly, it’s now trading above a key resistance level that has been capping price action. That’s meaningful because small-caps tend to be a “breadth amplifier”: when they break out, it often aligns with improving participation under the hood. Weekly trend is green here as well, and this looks like the cleanest “breakout attempt” of the three.
Breadth dashboard: more confirmation, less exuberance

Participation keeps improving
Compared with the previous trading day, the percentage of stocks above their moving averages rose across the board:
-
SMA(20)+: 69.1% (up from 66.5%)
-
SMA(50)+: 65.2% (up from 62.4%)
-
SMA(100)+: 56.7% (up from 54.8%)
-
SMA(200)+: 61.3% (slightly up from 60.5%)
That’s exactly what I want to see when indices are pushing into resistance: not just price drifting higher, but more stocks participating.
New highs expand sharply
New highs jumped to 11.3% (from 5.6%), while new lows stayed muted at 1.0%. That’s a strong “risk-on” signature and, in my experience, one of the more important confirmations when markets are attempting to sustain an advance.
####Daily thrust cools a bit
Here’s the subtle shift versus yesterday: big up-moves were a bit less common.
- Advancing >4%: 4.4% (down from 6.6%)
So while the market stayed positive, the move looked more like steady accumulation than a broad “momentum pop.” That’s not bearish—just a reminder that we may be transitioning from rebound energy into a more methodical trend phase.
Multi-day context: short-term strong, monthly slightly less punchy
The short-term picture remains notably supportive:
- Adv Week: 76% vs Decl Week: 23% (still very strong, only slightly softer than yesterday)
But the intermediate window is where I see mild cooling:
- Adv Month: 58.3% vs Decl Month: 40.9% (down from 62.1% / 37.2%)
Meanwhile, the 3-month view leans constructive again:
- Adv 3 Month: 60.1% vs Decl 3 Month: 38.8%
Net: short-term breadth is strong, intermediate breadth is still positive but not accelerating, and longer participation is improving again.
My breadth take: trend is healthy, but near “decision levels”
Linking this back to yesterday’s read: the market was already leaning bullish but bumping into resistance. Today, price moved higher again and breadth confirmed through improved participation and a surge in new highs, especially encouraging with IWM acting better. The only thing that didn’t expand was upside thrust, which makes me think we may see more “grind and digest” price action if indices keep leaning into overhead supply.
Breadth trend rating
Rating: Positive.
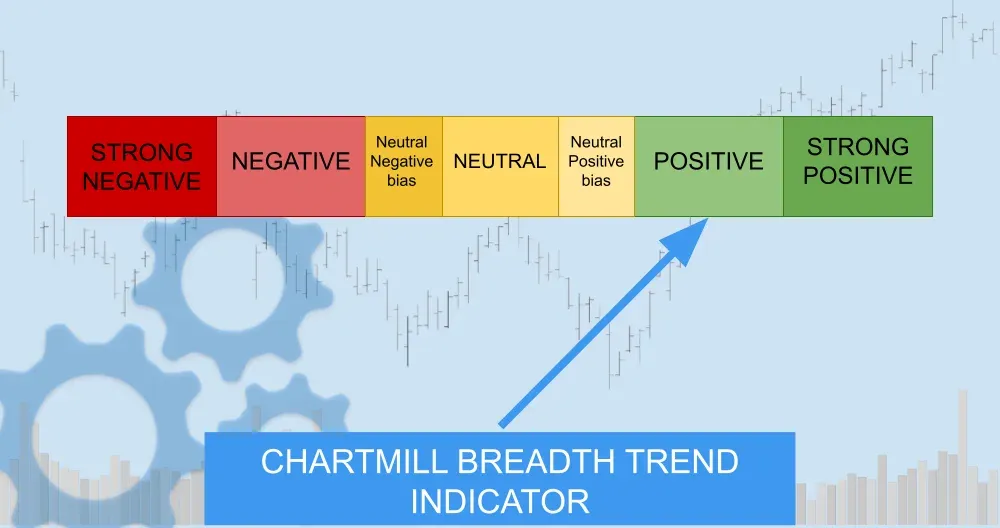
The market has broadening participation, expanding new highs, muted new lows, and all three major ETFs remain aligned with rising short-term trends and green weekly regimes. The slight reduction in daily thrust keeps me from calling it “very positive,” but the evidence still favors the bulls right now.
Kristoff
Next to read: Chips + Nuclear Power = Fresh Records on Wall Street