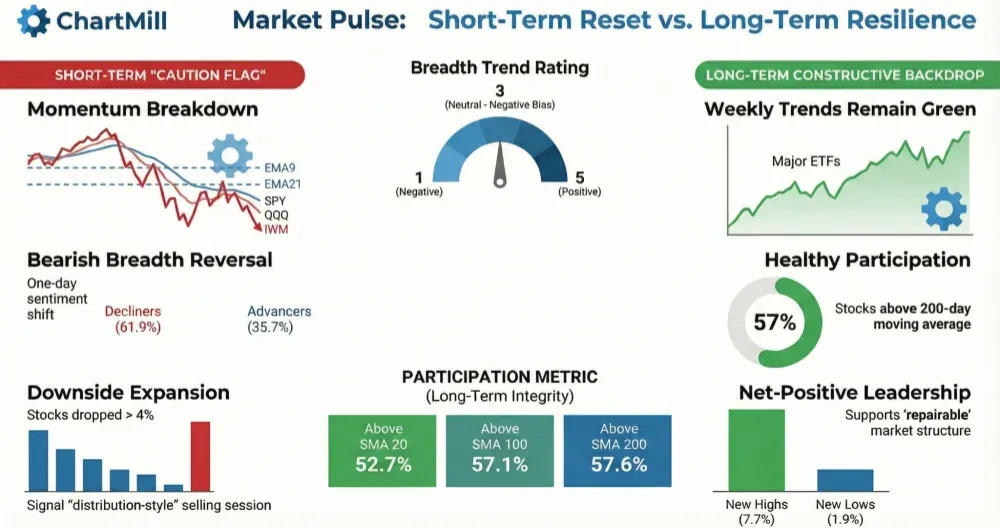
Friday’s session delivered a clear short-term reset: all three major ETFs closed back below their short-term averages, and breadth flipped decisively in favor of decliners. Still, the bigger-picture participation metrics remain relatively intact, keeping the longer-term backdrop constructive despite the day-to-day volatility.
Index overview (SPY, QQQ, IWM)
Short Term (Daily)

Long Term (Weekly)

SPY
Daily (EMA9/EMA21): SPY closed 685.99 (-0.48%), back below EMA9 (687.51) and EMA21 (687.71). Price continues to whip around inside a well-defined range, with supply showing up again near the upper zone and support holding in the mid-to-lower band.
Weekly (Trend Indicator): The long-term trend remains green (positive), with price still holding above the rising trend line.
Read-through: short-term momentum softened again, but the weekly structure still looks like consolidation near highs rather than breakdown.
QQQ
Daily: QQQ closed 607.29 (-0.32%), also below EMA9 (608.27) and EMA21 (610.26). The rebound attempt from earlier in the week lost traction, and QQQ is back in “range repair” mode.
Weekly: Trend remains green, with price still above the long-term trend line.
Read-through: tech is holding the bigger uptrend, but the daily chart keeps signaling hesitation and mean reversion rather than clean continuation.
IWM
Daily: IWM led to the downside, closing 261.41 (-1.7%), clearly below EMA9 (263.43) and EMA21 (262.91). Small caps remain the most sensitive to selling bursts, and price is leaning back into the lower area of its recent trading band.
Weekly: Trend stays green, and price remains well above the long-term trend line.
Read-through: short-term damage is most visible in small caps, but the weekly trend still argues for “pullback” rather than “trend break.”
Market breadth (10-day view)

The key message: a sharp one-day breadth reversal
Adv/Decl flipped risk-off: 35.7% advancers vs. 61.9% decliners, a meaningful deterioration versus Thursday’s healthier 54.1% / 42.6% split.
Downside expansion returned: 7.7% of stocks dropped >4%, versus 3.0% gaining >4% (yesterday’s skew was the other way around: 6.2% up vs 3.1% down). That’s classic “distribution-style” breadth for a single session.
Participation still holding up:
Above SMA20: 52.7%
Above SMA50: 55.6%
Above SMA100: 57.1%
Above SMA200: 57.6%
These are not bearish readings, they tell us the structure hasn’t broken, even if the tape is choppy.
Leadership isn’t collapsing: New Highs 7.7% vs New Lows 1.9% remains net-positive, which helps explain why the bigger picture still looks “repairable.”
What this means versus the prior day
Thursday looked like it might be building a bit of traction. Friday invalidated that follow-through with a broad-based sell-off and a heavier downside tail. This “one step forward, one step back” behavior continues to define the current regime: volatile, range-bound, and quick to punish conviction.
Conclusion
Friday’s data is a short-term caution flag: all three ETFs slipped below their EMA9/EMA21, decliners dominated, and downside movers expanded. But the longer-term breadth foundation (majority of stocks still above key SMAs; new highs still well above new lows) suggests this is still a consolidation/pullback within a broader uptrend, not a confirmed breadth breakdown.
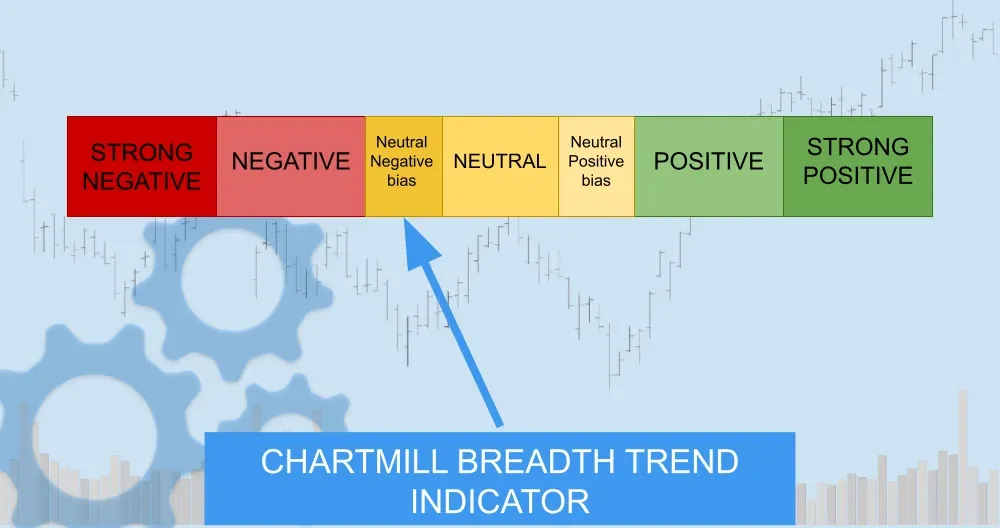
Breadth trend rating (scale 1 to 7): 3 — Neutral (negative bias)
The day-to-day action remains too unstable to justify a more constructive stance, and Friday’s breadth reversal reinforces the defensive bias. At the same time, longer-term participation metrics are still supportive enough to avoid downgrading into a clearly negative regime.
Kristoff - ChartMill
Next to read: War, Credit Cracks & the AI Divide: Wall Street Closes a Brutal Week as the Middle East Ignites