
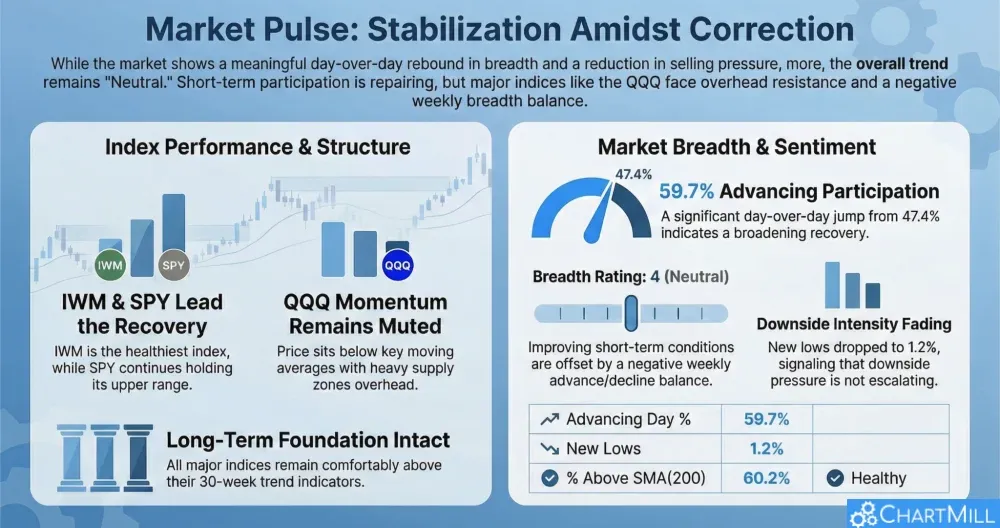
Wednesday brought a clear day-to-day breadth rebound and a meaningful drop in downside pressure (fewer heavy decliners and fewer new lows). The 1-week breadth totals remain skewed to decliners, and the QQQ chart still looks like a rebound inside a choppy corrective range.
Index overview (SPY, QQQ, IWM)
Short Term (Daily)

Long Term (Weekly)
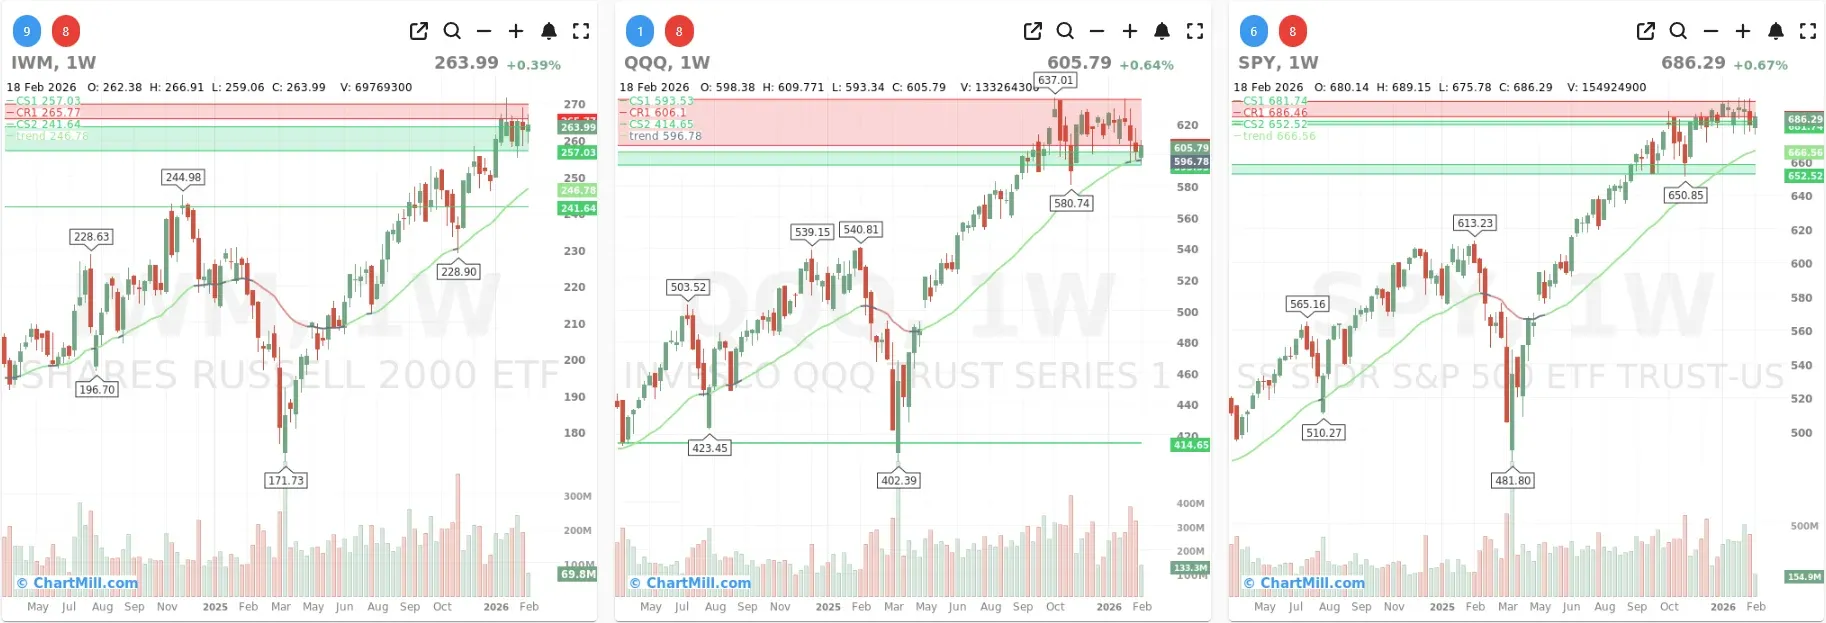
SPY
SPY closed 686.29 and continues to hold the upper range it has carved out over the past weeks. The daily chart shows price sitting around the short-term averages (EMA9 ~686.4 and EMA21 ~687.8), which fits the current tape: constructive, but not trending cleanly. From a structure perspective, SPY is still digesting gains near the highs rather than breaking down.
On the weekly chart, SPY remains well above the 30-week trend indicator (~666.6), so the longer-term bias stays supportive. The main takeaway is continuity versus the prior session: the market is still absorbing rather than rolling over, but it also isn’t accelerating higher.
QQQ
QQQ closed 605.79 and bounced, but the daily trend remains messy: price is still below EMA9 (~607.2) and EMA21 (~612.2), keeping short-term momentum muted. The rebound helped, yet it doesn’t change the bigger pattern: QQQ is still trying to stabilize after repeated sharp swings.
On the weekly chart, QQQ remains above the trend indicator (~596.8), but it’s also pressing into a well-defined overhead supply zone (the red band). This is important context for today’s breadth improvement: it helps, but QQQ still needs follow-through to confirm that buyers are regaining control in the leadership segment.
IWM
IWM closed 263.99 and continues to look healthier than QQQ. On the daily chart, it’s back above EMA9 (~263.2) and EMA21 (~262.3) and is holding near the upper end of its recent range. That keeps the small-cap tone constructive.
The weekly chart remains supportive as well, with IWM comfortably above its trend indicator (~246.8). Among the three, IWM currently looks like the “least damaged” index structure-wise.
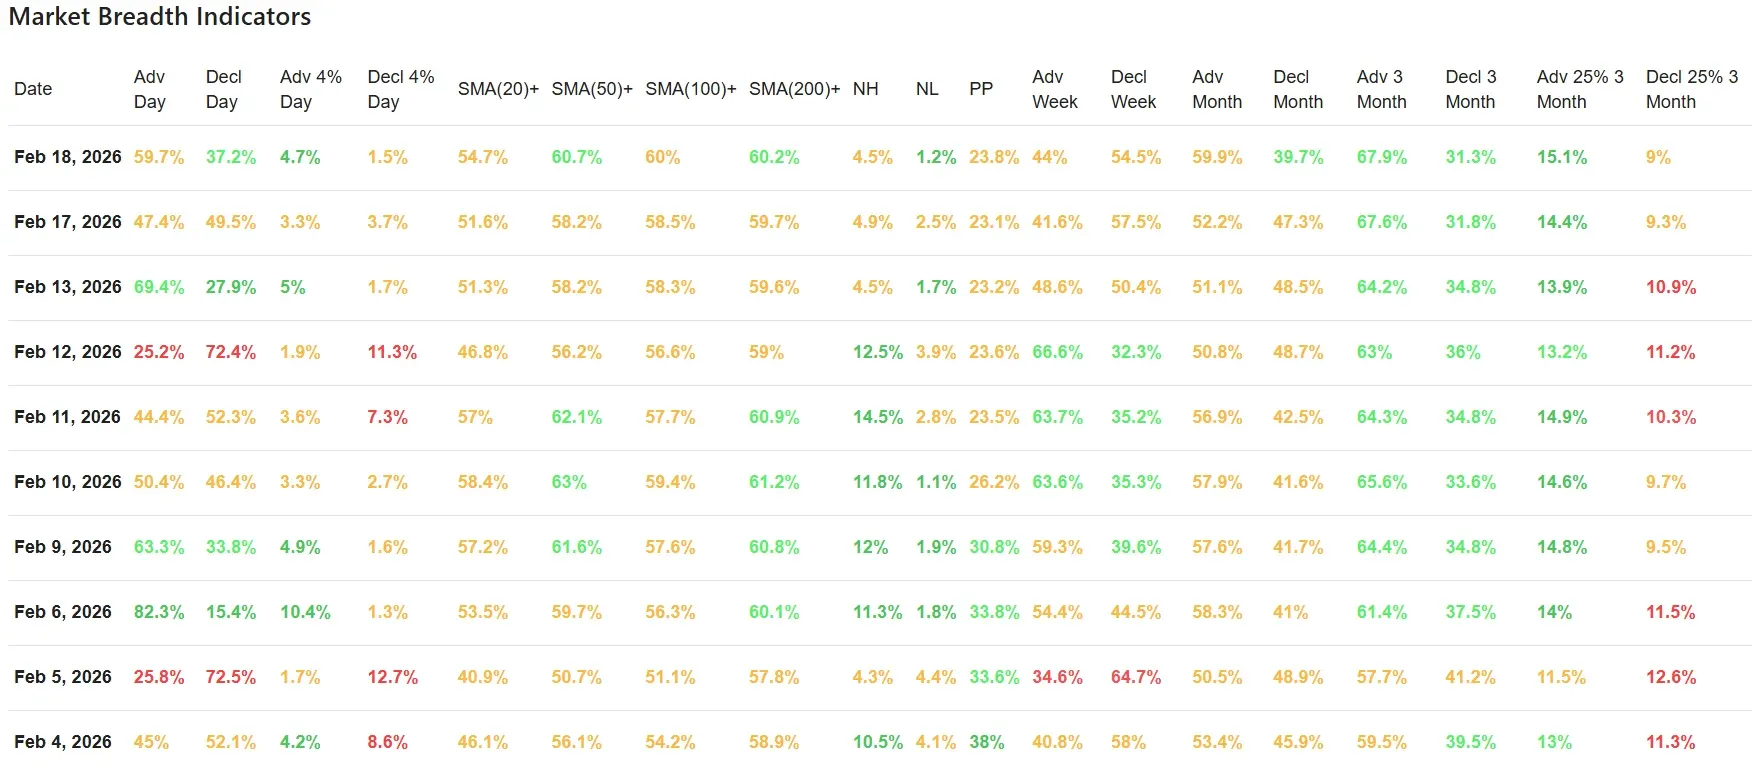
Market breadth (10-day view)
1) Participation improved meaningfully (day-over-day)
-
Advancing day % jumped to 59.7% (from 47.4% on Feb 17), while decliners fell to 37.2%.
-
Importantly, the tape also showed less downside intensity: Decliners >4% dropped to 1.5% (from 3.7%).
This is a notable improvement versus the prior session, where the market felt more split and fragile.
2) The “trend health” measures ticked higher
-
% above SMA(20) rose to 54.7% (from 51.6%).
-
Longer lookbacks remain solid: SMA(50)+ 60.7%, SMA(100)+ 60.0%, SMA(200)+ 60.2%.
So the longer-term foundation is still intact, and the short-term participation is repairing, consistent with what you see in SPY/IWM holding up on the charts.
3) New highs vs new lows: steady-to-better
-
New highs: 4.5% (slightly lower than 4.9% prior day)
-
New lows: 1.2% (improved from 2.5%)
The key shift is the decline in new lows, which supports the idea that yesterday’s wobble did not escalate into broader breakdown pressure.
4) Short-term breadth is better… but the weekly balance is still negative
This is the main “hold the excitement” line:
Adv week: 44% vs Decl week: 54.5%
Even after today’s rebound, the last week still shows more persistent selling than buying. That aligns well with QQQ’s choppy corrective structure and explains why today reads more like stabilization + repair than a clean trend resumption.
Breadth trend rating (1-7)
4 — Neutral
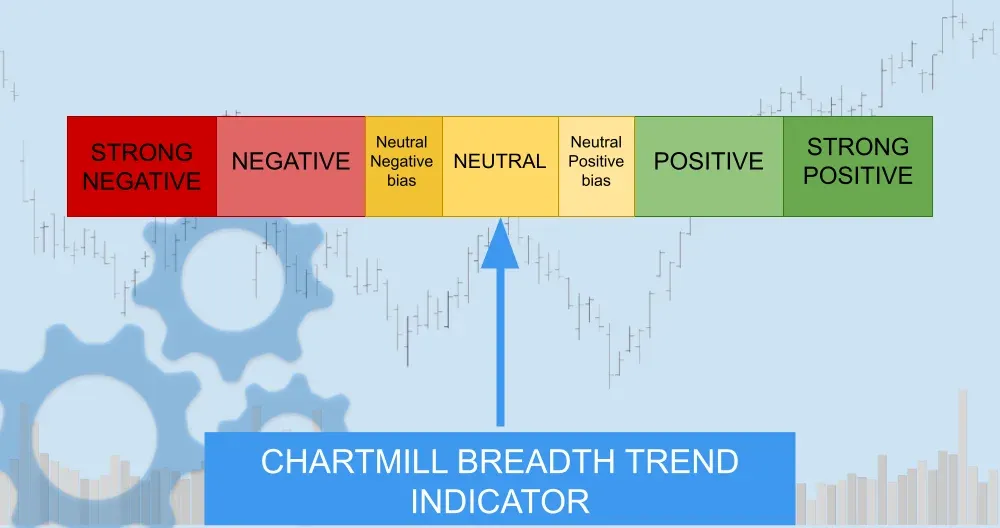
The improvement in day-to-day participation and the sharp reduction in heavy decliners are constructive, and the longer-term breadth backbone (SMA50/100/200) remains solid.
But with weekly breadth still negative and QQQ still below key daily moving averages, the evidence supports a neutral stance rather than a positive bias—improving conditions, not confirmed momentum.
Kristoff - ChartMill
Next to read: Tech Rebounds and Fed Friction: Navigating a Tug-of-War Market