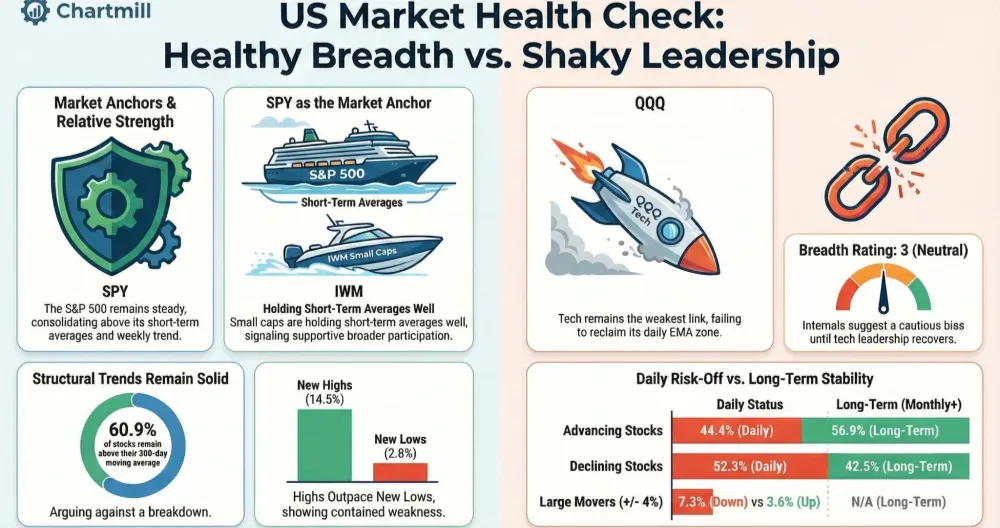
The market is still digesting last week’s sharp selloff: longer-term breadth remains healthy, but today’s tape showed a mild “risk-off” tilt with more decliners than advancers and an uptick in 4% down days. Small caps and the S&P 500 are holding up better than tech, keeping the broader picture stable, but leadership is not fully back in control yet.
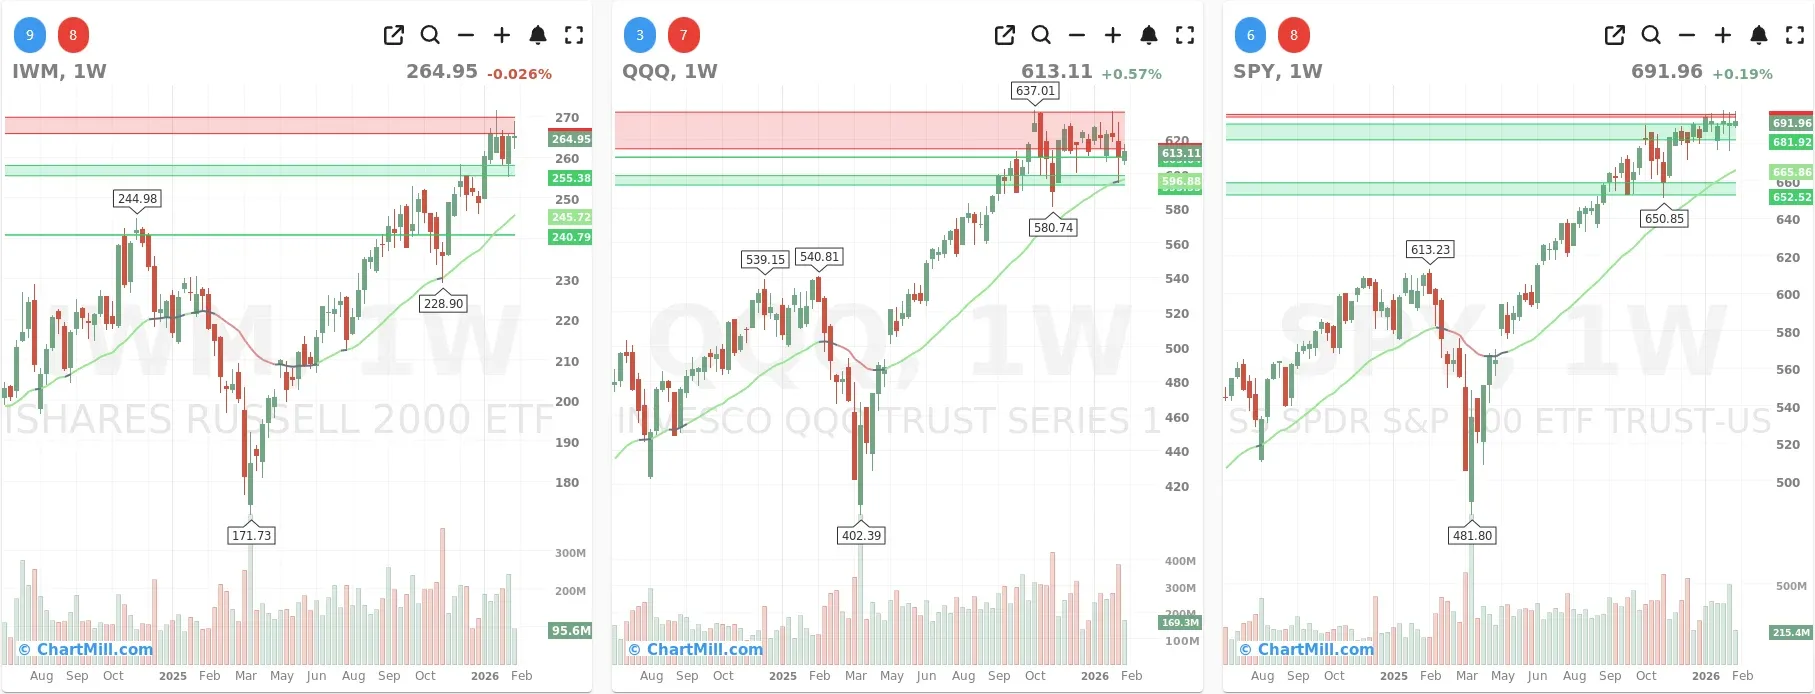
Index overview (SPY, QQQ, IWM)
Short Term (Daily)

Long Term (Weekly)
SPY
SPY finished essentially flat and continues to hold near the upper end of its recent range, with price still above the rising weekly trend (30-week EMA). On the daily chart, the EMA9/EMA21 are still supportive, which fits the idea of consolidation rather than breakdown.
Takeaway: SPY remains the “anchor” - steady, not explosive. As long as it holds above the short-term averages, pullbacks look more like digestion than trend damage
QQQ
QQQ managed a small gain, but the chart remains the weakest of the three. After failing near the recent highs, price is now below the daily EMA zone, showing that buyers are less aggressive in tech leadership. On the weekly chart, the long-term trend is still constructive (price above the 30-week EMA), yet the recent action looks like a consolidation with a heavier tone than SPY/IWM.
Takeaway: Leadership is still “questionable.” For breadth to improve meaningfully, QQQ typically needs to reclaim/hold its short-term averages and reduce downside volatility.
IWM
IWM slipped modestly but continues to hold above its daily EMA9/EMA21, and the weekly trend remains clearly positive. Small caps are also pressing into a prior resistance zone, which often creates chop and short-term pullbacks.
Takeaway: IWM is acting relatively well. If small caps can keep holding their short-term moving averages while the market consolidates, it’s a supportive sign for broader participation.
Market breadth (10-day view)

Today vs. Yesterday: slight “risk-off” tilt
- Advancing stocks (day): 44.4% vs Declining: 52.3% → mildly negative day.
- 4% movers: Adv 4%: 3.6% vs Decl 4%: 7.3% → more large downside moves than large upside moves.
That’s a step down from the prior session, when adv/decl was more balanced and downside pressure was lighter. So while the rebound attempt remains intact, today’s internals weren’t a clean continuation day.
The bigger picture is still supportive
Despite today’s softer daily numbers, the structural breadth metrics remain solid:
- % above SMA(20): 57%
- % above SMA(50): 62.1%
- % above SMA(100): 57.7%
- % above SMA(200): 60.9%
This combination typically argues against a “broad market breakdown” narrative. It suggests many stocks are still in workable trends, even if leadership (QQQ) is lagging.
Momentum over weeks/months stays positive
- Advancing week: 63.7% (vs declining week 35.2%)
- Advancing month: 56.9% (vs declining month 42.5%)
- Advancing 3 months: 64.3% (vs declining 34.8%)
So the rebound from last week’s washout still shows up in the intermediate windows, today just adds a reminder that volatility hasn’t vanished.
Highs vs. lows: still constructive
- New Highs: 14.5% vs New Lows: 2.8%
New lows remain contained, which supports the idea that weakness is not spreading aggressively. That’s consistent with the weekly trend structure on SPY/IWM.
What changed vs. the previous session?
Yesterday’s tone leaned more “stabilizing.” Today introduced more downside expansion (higher 4% down days) while indexes largely held their ground. That combination often translates to:
- index resilience, but
- stock-level selectivity rising, and
- leadership still not fully repaired (especially visible in QQQ’s daily chart vs its EMA zone).
Breadth Trend Rating (1–7)
3 — Neutral (negative bias)
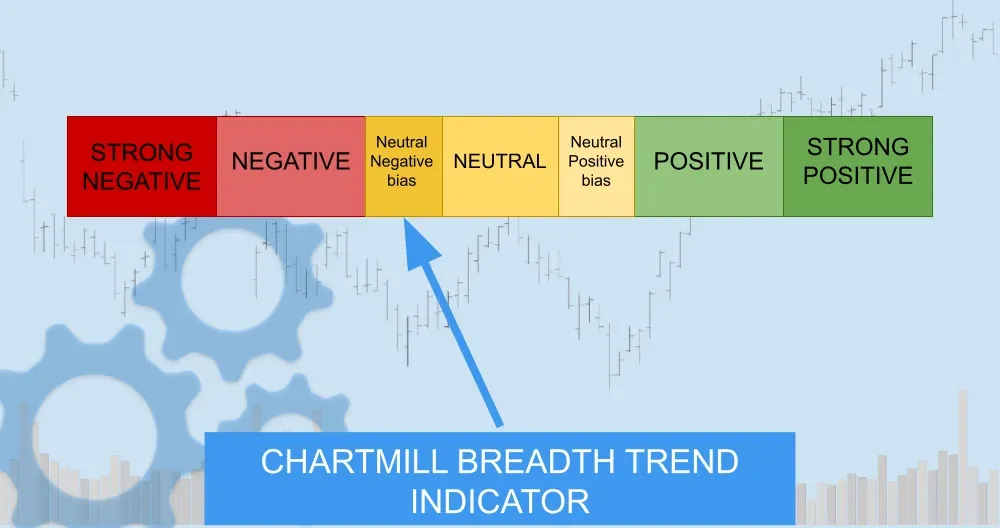
Breadth is not “broken” (longer-term participation remains healthy and new lows are limited), but today’s internals and QQQ’s short-term weakness keep the bias slightly cautious. A shift back toward neutral/positive would likely require QQQ to reclaim its daily EMA zone and a reduction in downside expansion days.
Kristoff - ChartMill
Next to read: AI Agents and the Jobs Report Jitter: A Wall Street Balancing Act