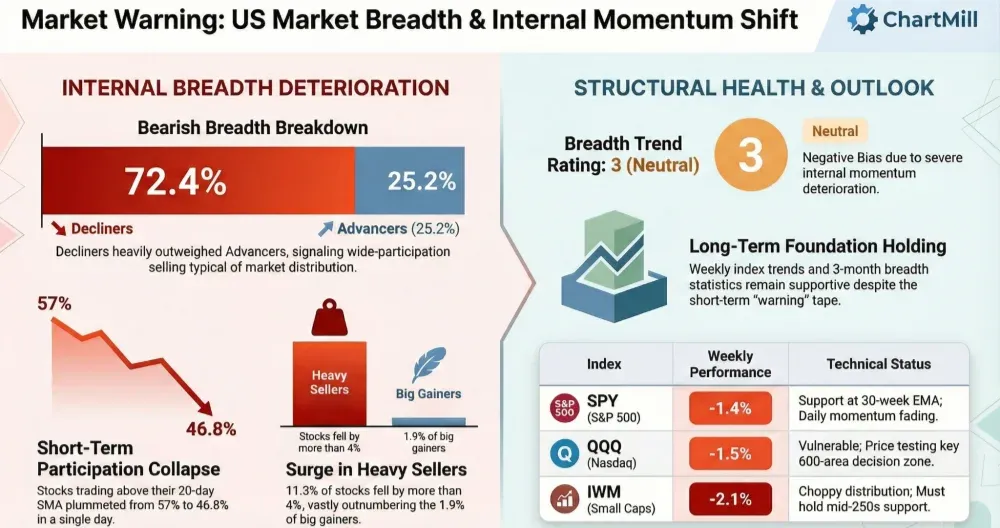
Thursday’s session delivered a clear risk-off breadth message: heavy decliners, a jump in -4% movers, and a sharp drop in short-term participation (SMA(20)+ falling back below 50%). Longer-term structure (weekly/3-month stats and the weekly index trends) is still holding up, but the tape is sending a warning that this rally is losing internal momentum.
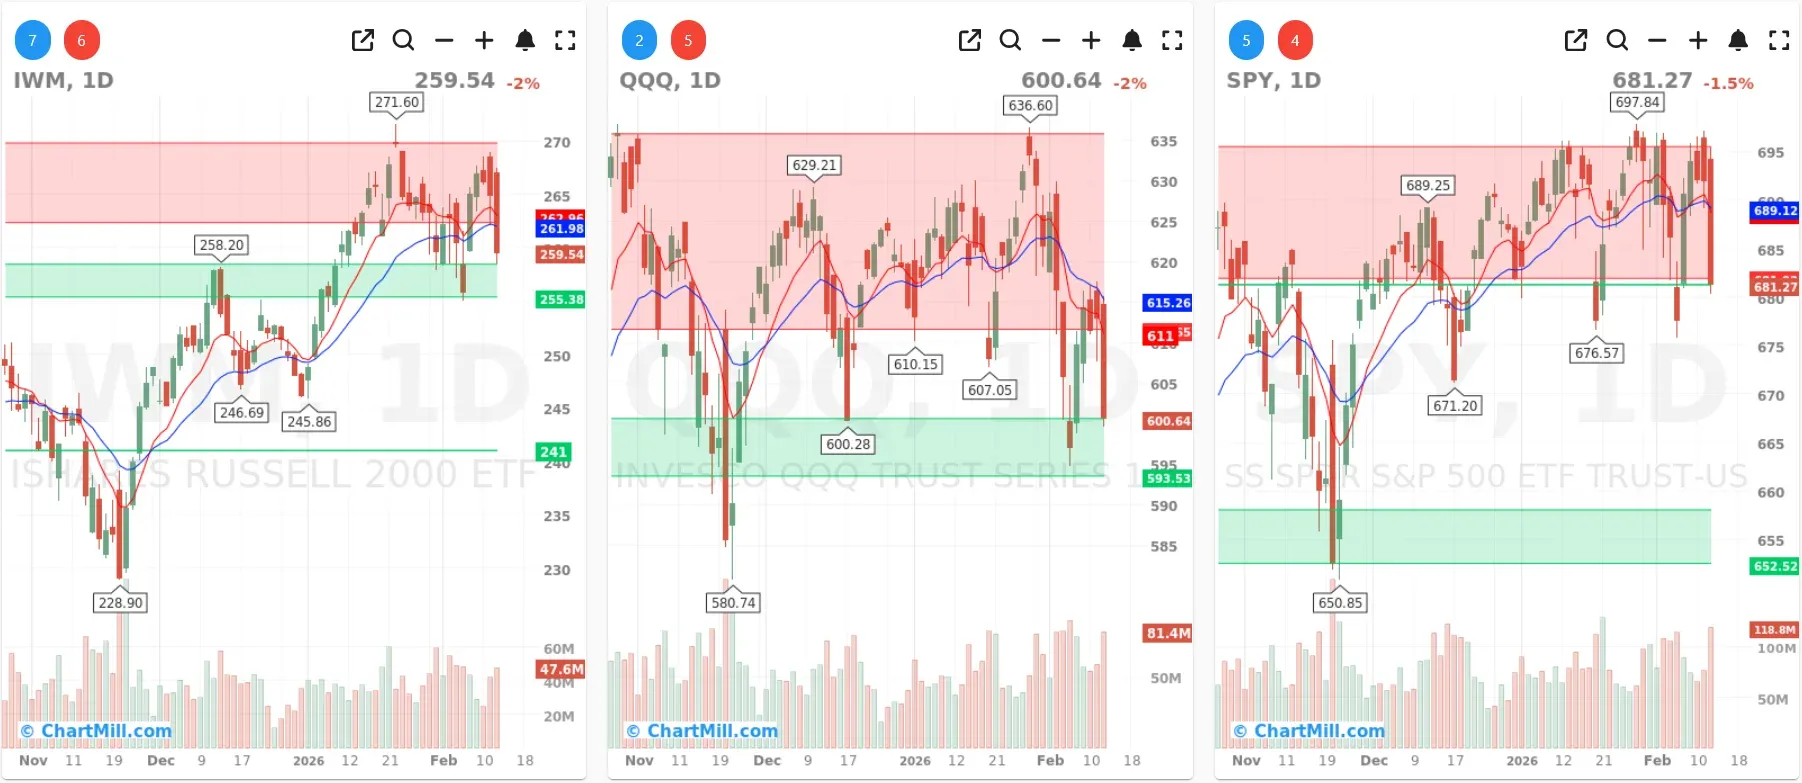
Index overview (SPY, QQQ, IWM)
Short Term (Daily)
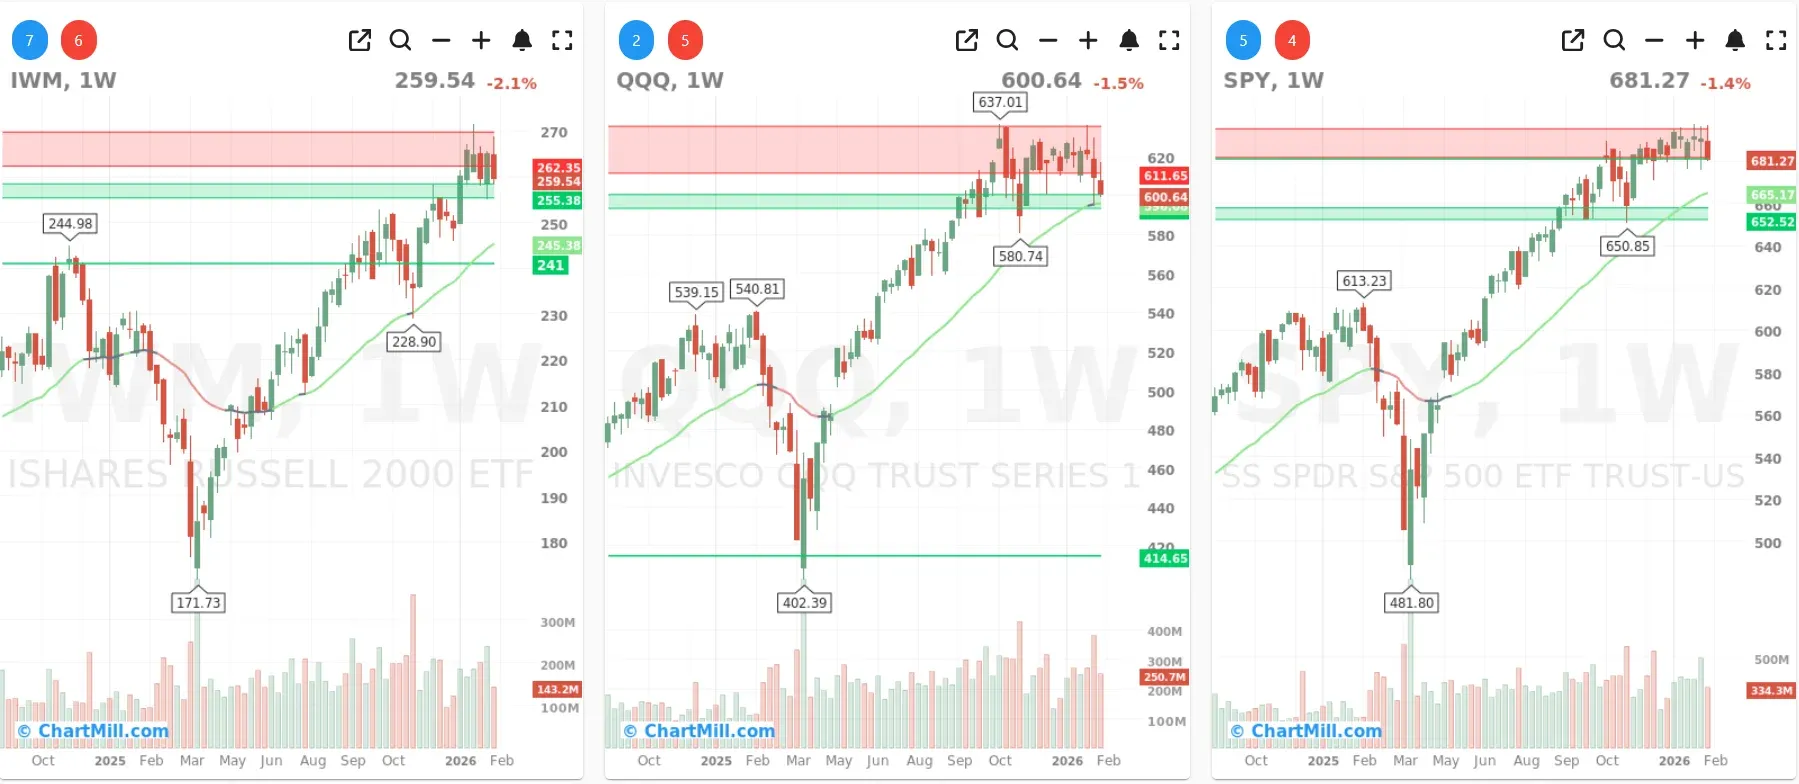
Long Term (Weekly)
SPY
Weekly: SPY pulled back (-1.4% on the week) from the upper resistance area after a strong multi-month run. The 30-week EMA/Trend Indicator remains supportive, which keeps the bigger picture constructive, but the rejection near the highs suggests buyers are less aggressive at these levels.
Daily: The daily chart shows a sharp down day (-1.5%) that drags price back toward the lower edge of the recent range. With the EMA9/EMA21 rolling over, short-term momentum is fading and the market is increasingly dependent on nearby support holding.
QQQ
Weekly: QQQ also gave ground (-1.5% on the week) after failing to sustain the move in the upper resistance band. Structurally it’s still above the rising long-term average, but the pullback is now more than just noise.
Daily: The daily damage is clearer here: ~-2% and price pushed back toward the 600 area, which has acted as an important decision zone. The short-term moving averages are weakening, and QQQ looks like the most vulnerable of the three if selling continues.
IWM
Weekly: IWM dropped the most this week (-2.1%), but it’s still coming off a strong prior advance. The weekly trend remains intact for now, yet the candle structure suggests choppy distribution near the top of its recent range.
Daily: The daily chart (-2%) shows price slipping back toward the mid/upper-250s support zone. As long as that area holds, this can remain a consolidation; if it breaks, small caps could quickly become a larger drag on breadth.
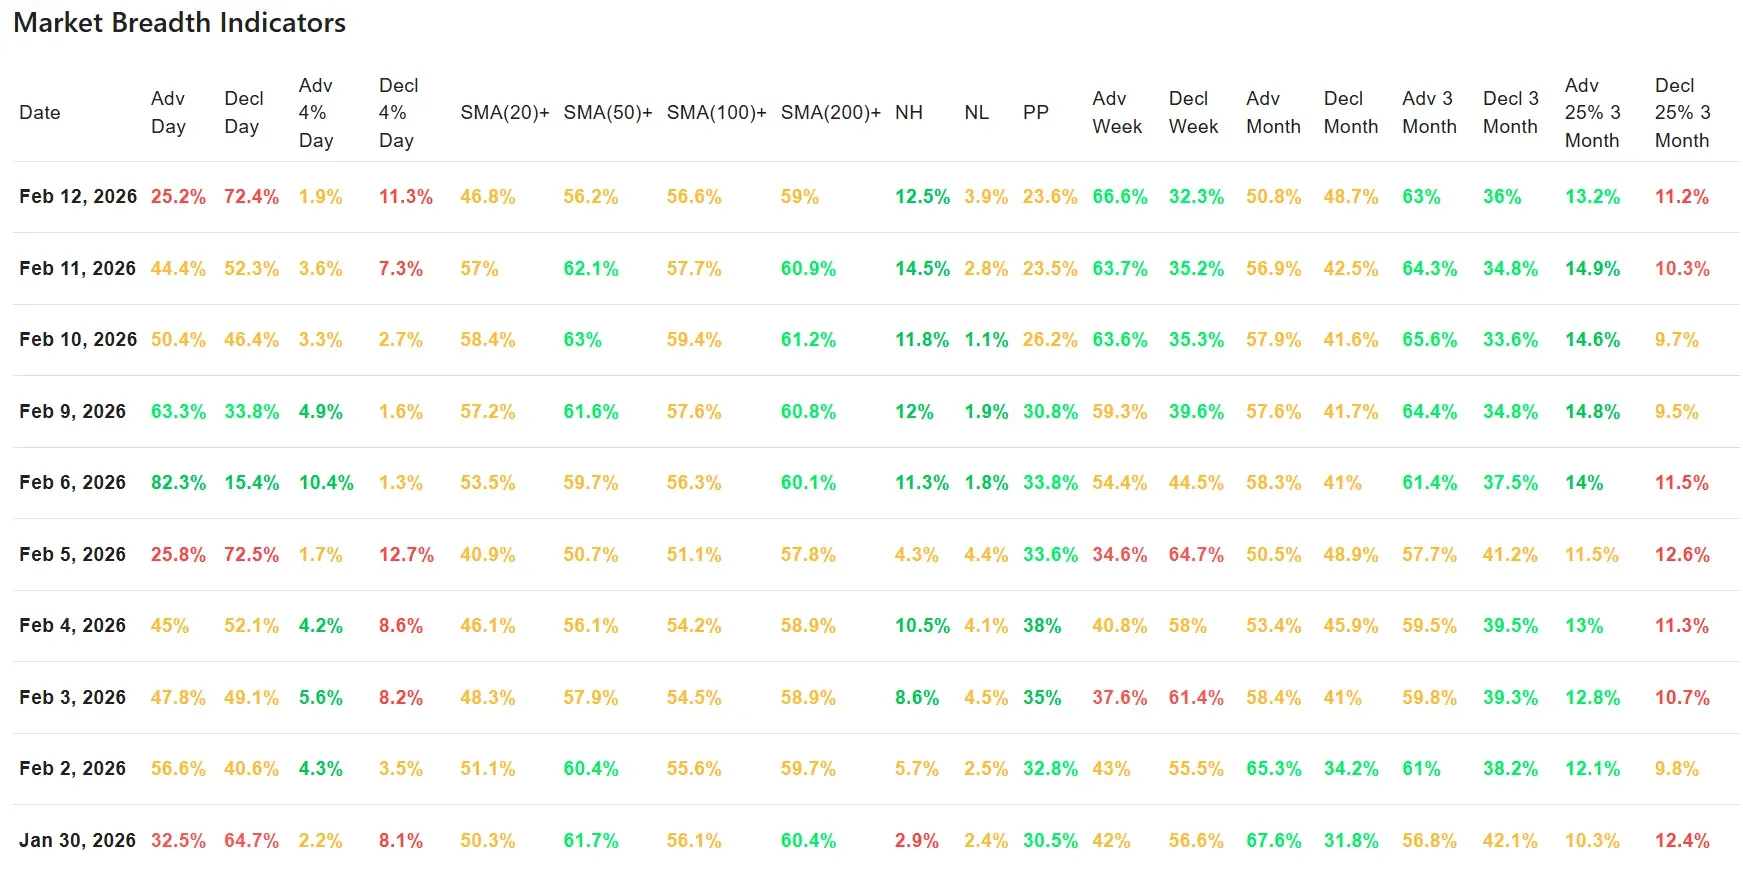
Market breadth (10-day view)
A decisive downside day
Thursday’s breadth numbers were outright bearish:
- Advancers: 25.2% vs Decliners: 72.4%
- Big movers: only 1.9% of stocks gained +4%, while 11.3% fell -4%
This is the kind of “wide participation selling” that typically shows distribution, not a healthy pullback.
Participation weakens sharply
The most important internal shift is the sudden deterioration in stocks holding above key moving averages:
-
SMA(20)+: 46.8% (down sharply from 57% the prior day)
-
SMA(50)+: 56.2% (down from 62.1%)
-
SMA(100)+: 56.6%
-
SMA(200)+: 59%
That drop in SMA(20)+ below 50% matters: it suggests the average stock is losing its short-term trend even if the longer-term backdrop hasn’t broken yet.
New highs vs new lows: still okay, but drifting
-
New Highs: 12.5%
-
New Lows: 3.9%
This is not “panic breadth” (lows are still contained), but the direction is unfavorable: highs are easing and lows are ticking up.
Longer-term breadth isn’t broken
Despite today’s hit, the slower measures still lean constructive:
-
Adv Week: 66.6% vs Decl Week: 32.3%
-
Adv Month: 50.8% vs Decl Month: 48.7% (basically neutral)
-
Adv 3 Month: 63% vs Decl 3 Month: 36%
-
25% (3M): 13.2% vs Decl 25% (3M): 11.2%
So the bigger message is: the foundation is still standing, but the internal “thrust” is fading fast.
Link to the prior update (what changed vs Feb 11)
Yesterday already wasn’t clean (decliners slightly led), but it was still contained. Today flipped that into a clear and broad selloff, with:
-
a large jump in heavy downside movers (-4%),
-
and a meaningful breakdown in short-term participation (SMA(20)+).
This looks less like a one-off wobble and more like a market that’s starting to price in tighter conditions (or at least stepping back from risk), without yet confirming a full trend break on the weekly charts.
Breadth trend rating
Rating: 3 — Neutral (negative bias)
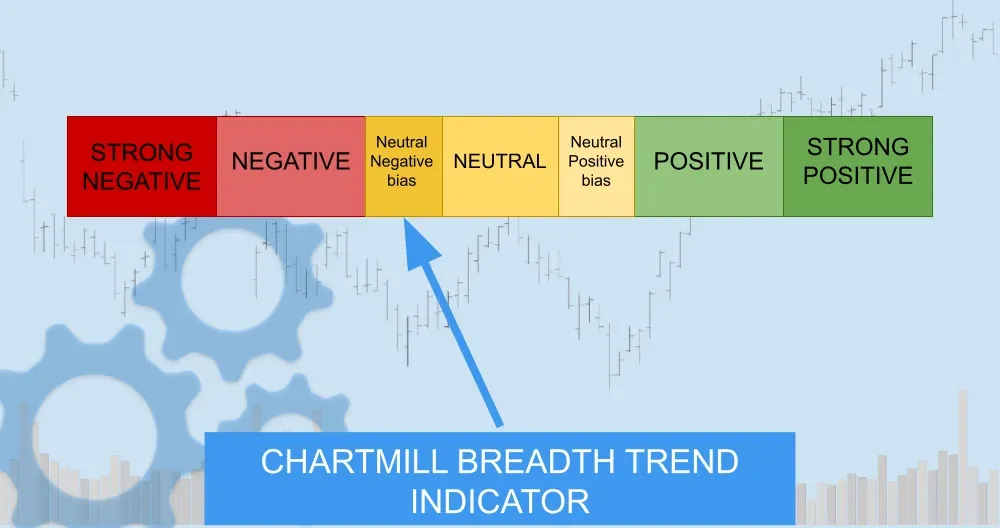
The weekly/3-month structure is still supportive, but the severity of today’s breadth deterioration and the drop in short-term participation keep the bias pointed lower unless buyers quickly reclaim control.
Kristoff - ChartMill
Next to read: AI: The Great Disruptor or the Great Divider?