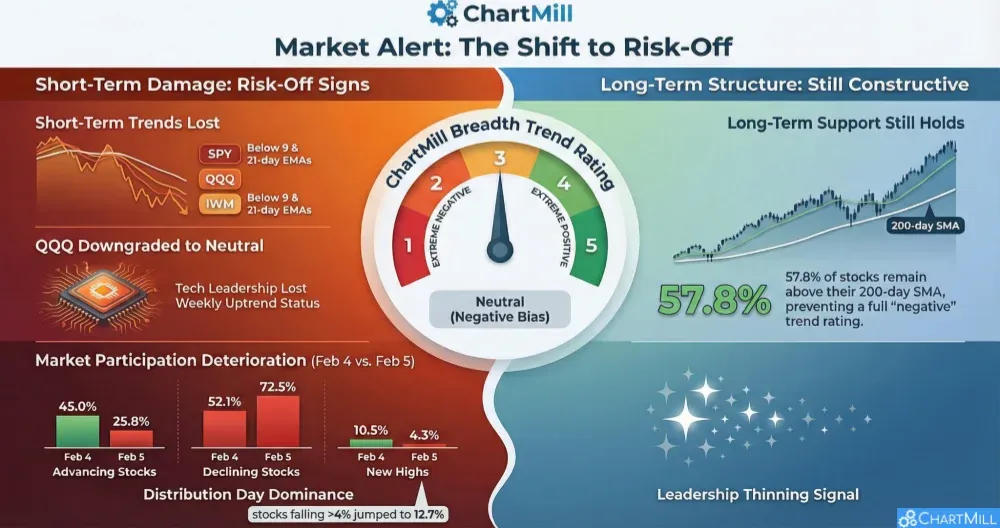
The market followed through to the downside on Feb 5, with a sharp drop in day-to-day breadth and all three major index ETFs losing their short-term trend (below EMA9/EMA21).
Longer-term trends are still intact on the weekly charts, but the internal damage increased meaningfully - especially in the “hard down” (−4%+) bucket and the 25% movers over 3 months.
Index overview (SPY, QQQ, IWM)
Short Term (Daily)
Long Term (Weekly)
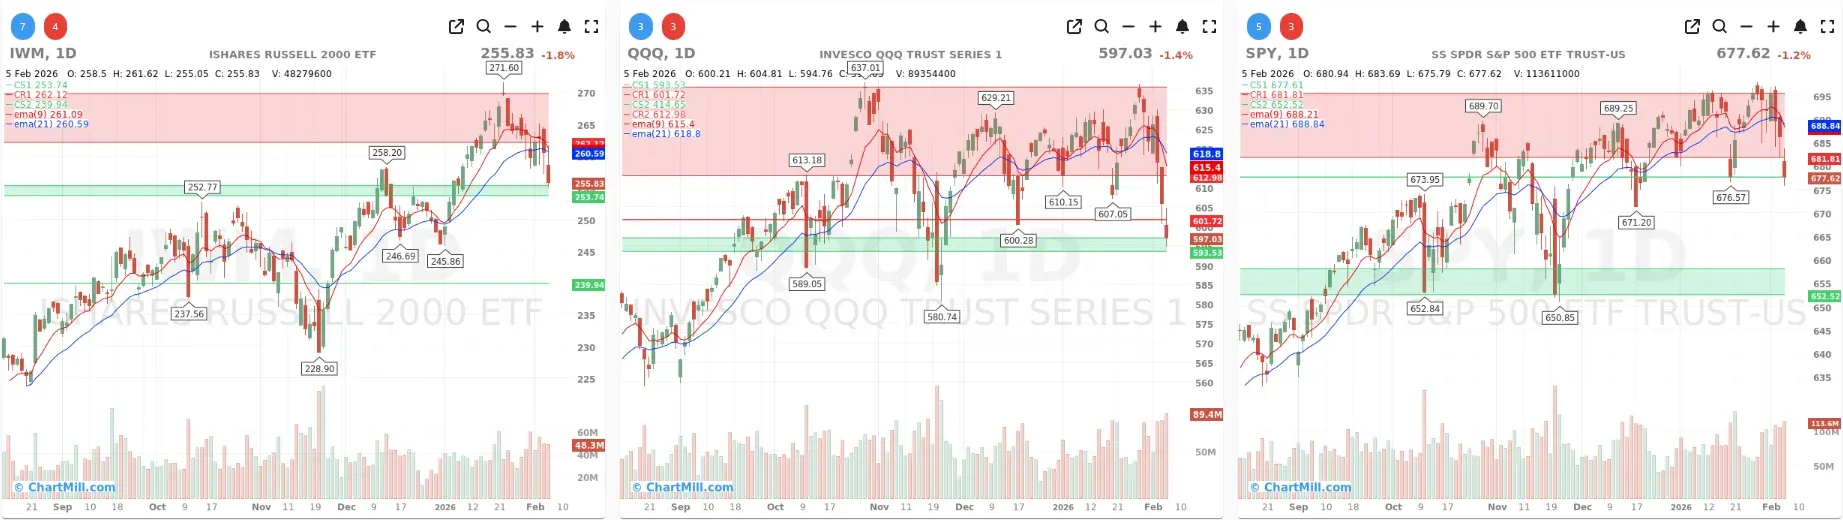
SPY
Daily: A decisive selloff pushed SPY further below both EMA9 and EMA21, shifting the short-term character from “buy-the-dip” to “risk-off until proven otherwise.” The candle pressed into the near-term support area around the mid/upper-670s; the next meaningful demand zone sits much lower (mid-650s area on the chart).
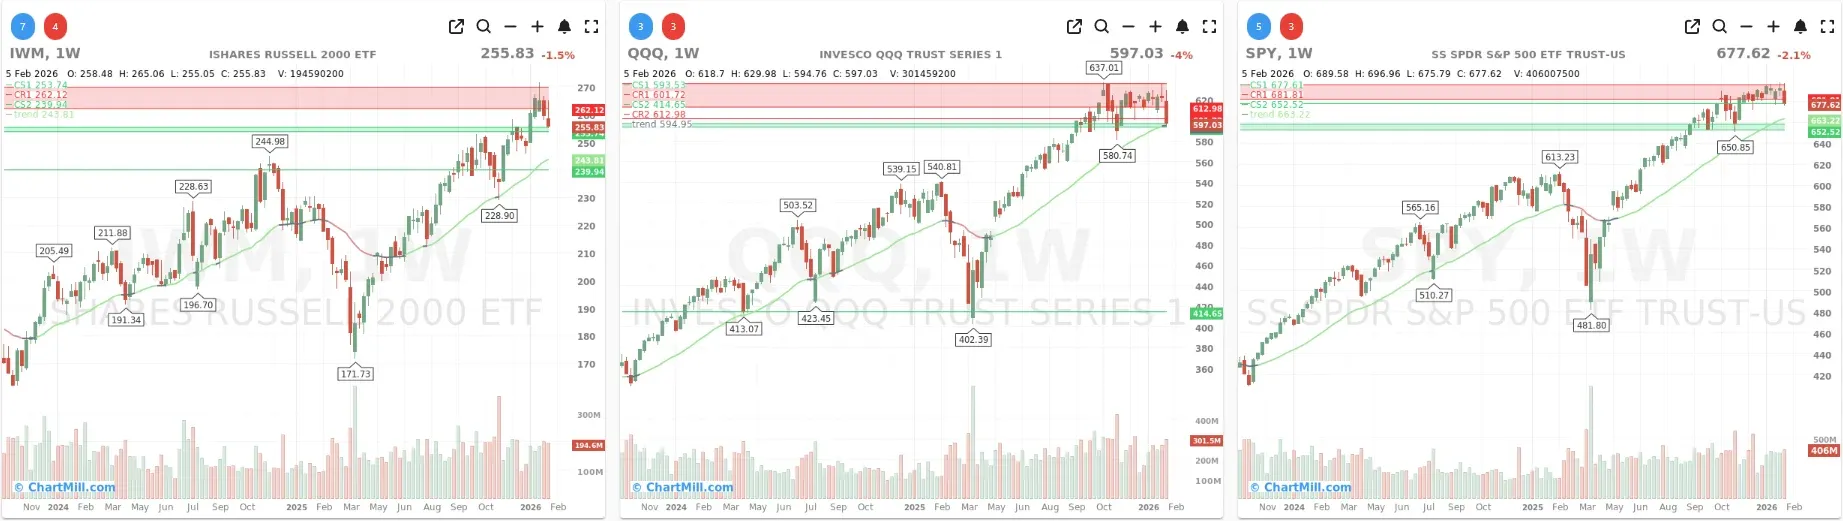
Weekly: Still above the green 30-week Trend Indicator, so the longer-term uptrend isn’t broken, but this week’s drop is a clear momentum interruption after an extended run.
Takeaway: Short-term trend damage, long-term still constructive — but bulls now need to reclaim the daily EMAs to restore confidence.
QQQ
Daily: The most technically concerning of the three. QQQ printed a large bearish expansion candle, slicing under both EMAs and landing into the lower support band (high-590s/low-600s). This looks like a breakdown from the prior range rather than a contained pullback.
Weekly: The bigger change is on the weekly chart: the ChartMill Trend Indicator has turned grey, meaning QQQ has shifted from a confirmed uptrend to a neutral long-term regime. That doesn’t automatically imply a bear market, but it does mean leadership is no longer trending higher in a clean way and that makes near-term rallies more likely to face supply unless QQQ can stabilize and regain key levels.
Takeaway: With QQQ losing both its daily trend and its weekly uptrend status, growth/tech leadership is on watch and the burden of proof shifts back to the bulls.
IWM
Daily: IWM also lost its daily EMAs and fell back into/near a near-term support pocket in the mid-250s. Small caps are again acting like the market’s “risk barometer,” and today they didn’t like what they saw.
Weekly: Trend Indicator still green and price remains well above it, but the weekly candle shows a clear rejection from higher levels.
Takeaway: The small-cap uptrend survives, but the short-term tape has shifted to defense.
Market breadth (10-day view)
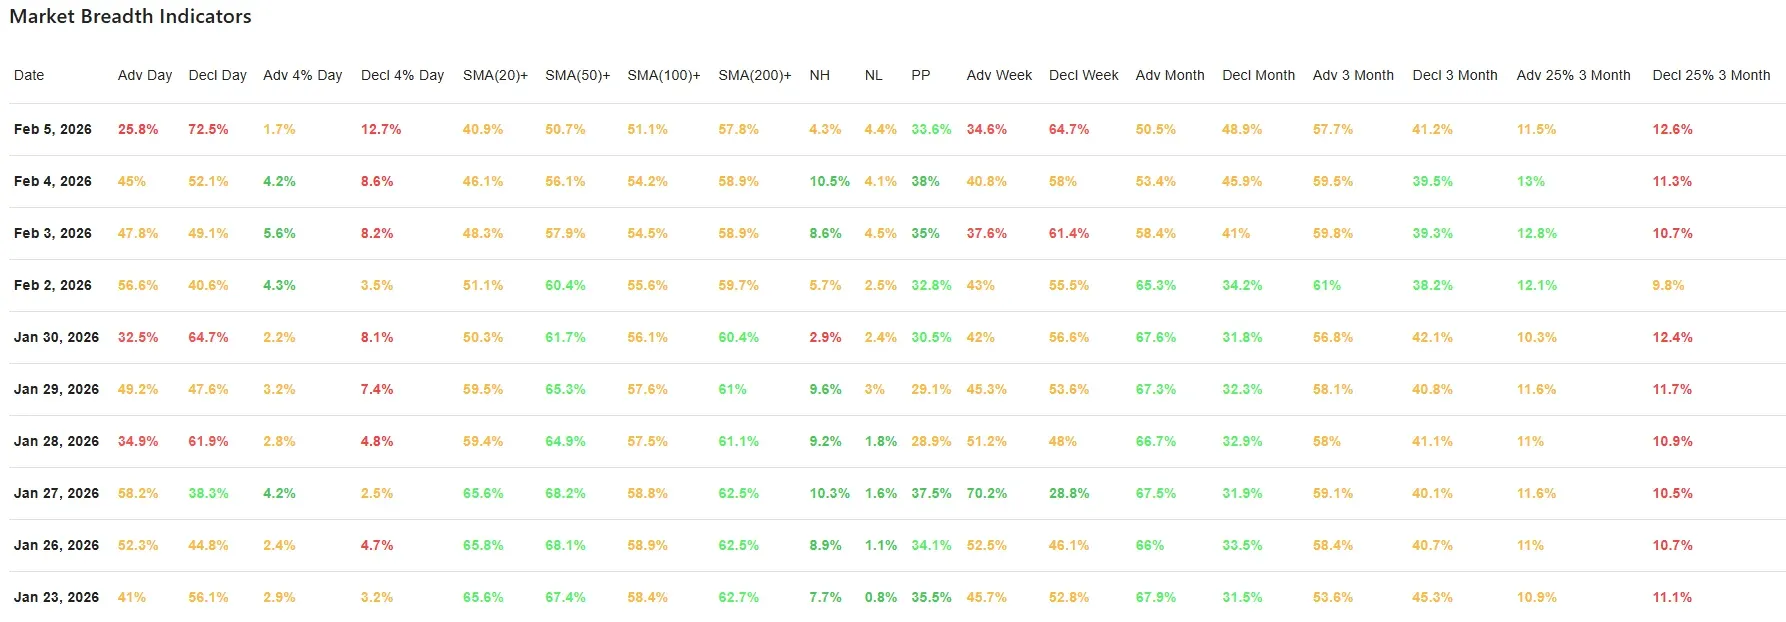
Compared with Feb 4, Feb 5 was a material deterioration in participation:
Daily participation flipped hard negative
-
Advancing stocks: 25.8% (down sharply from 45%)
-
Declining stocks: 72.5% (up strongly from 52.1%)
-
Big downside (−4% day): 12.7% (up from 8.6%)
-
Big upside (+4% day): 1.7% (down from 4.2%)
Message: This wasn’t a mild “red day.” The market produced a broad distribution day with an expansion in large losers.
Trend health weakened, especially short-term
-
Above SMA(20): 40.9% (down from 46.1%)
-
Above SMA(50): 50.7% (down from 56.1%)
-
Above SMA(100): 51.1% (down from 54.2%)
-
Above SMA(200): 57.8% (slightly down from 58.9%)
Message: The longer-term structure (SMA200) is still okay, but the short/medium trend layer is slipping, consistent with the daily index breakdowns.
Breakouts vs breakdowns: deterioration continues
-
New Highs: 4.3% (down from 10.5%)
-
New Lows: 4.4% (up from 4.1%)
Message: New highs collapsed while new lows rose, a classic “leadership thinning” signal.
Multi-day breadth confirms the shift to defense
-
Weekly: 34.6% adv vs 64.7% decl
-
Monthly: still relatively balanced (50.5% adv vs 48.9% decl) but momentum is fading
-
3-month: still positive (57.7% adv vs 41.2% decl) however…
-
Extreme movers (25% over 3 months): 11.5% adv vs 12.6% decl
Message: The longer lookback still reflects the prior uptrend, but the “extreme movers” skew now favors big decliners, which often happens when risk appetite starts to contract.
Linking to the prior breadth read (Feb 4 → Feb 5)
Wednesday’s picture still had some stabilization characteristics (higher advancers, better SMA participation, and notably higher new highs). Yesterdat reversed that improvement and did it forcefully: fewer advancers, more hard down moves, and a sharp drop in new highs.
In other words: Feb 4 looked like it might hold; Feb 5 confirmed it didn’t.
What to watch next (practical checkpoints)
-
Can SPY/QQQ/IWM reclaim EMA9/EMA21 quickly? If not, rallies are more likely to be sold.
-
Does −4% decliners cool off? That “12.7%” reading is a risk-off tell , you want to see that shrink meaningfully.
-
New highs need to rebuild. A market can’t sustain an uptrend if leadership stops making fresh highs.
-
QQQ vs its weekly trend line. QQQ is the closest to a true weekly support test, important for broader risk sentiment.
Breadth trend rating
Rating: 3 — Neutral, negative bias.
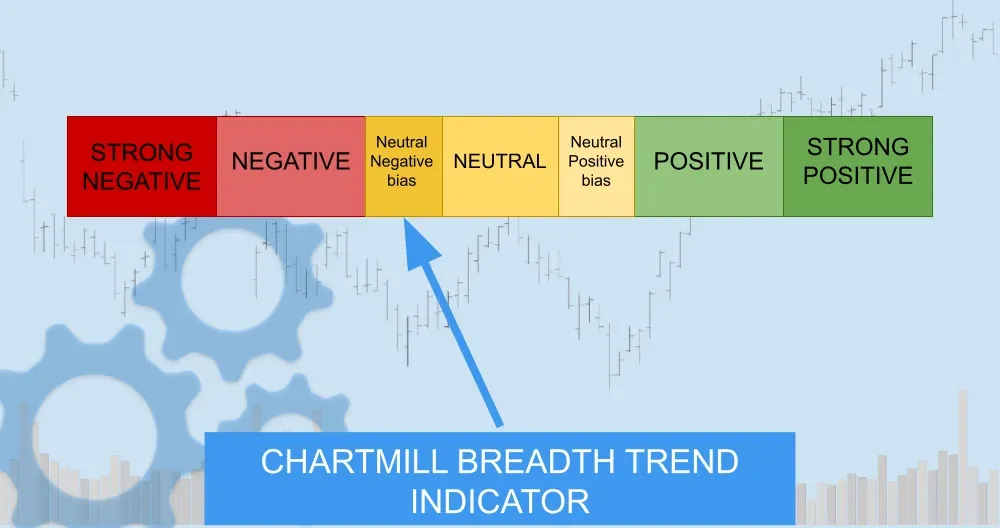
Why the rating stays neutral (negative bias)
Despite today’s sharp breadth deterioration and QQQ’s weekly downgrade to neutral, the broader market hasn’t fully rolled into a confirmed negative regime yet: SPY and IWM remain in weekly uptrends, and ~58% of stocks are still above their 200-day moving average, which is more consistent with a pullback/transition than a broad breakdown.
For now, the evidence supports a defensive bias, but not a full “negative” trend call until longer-term structure and new-low expansion confirm it.
Kristoff
Next to read: The $200 Billion AI Gamble: Big Tech’s Capex Binge Rattles Wall Street