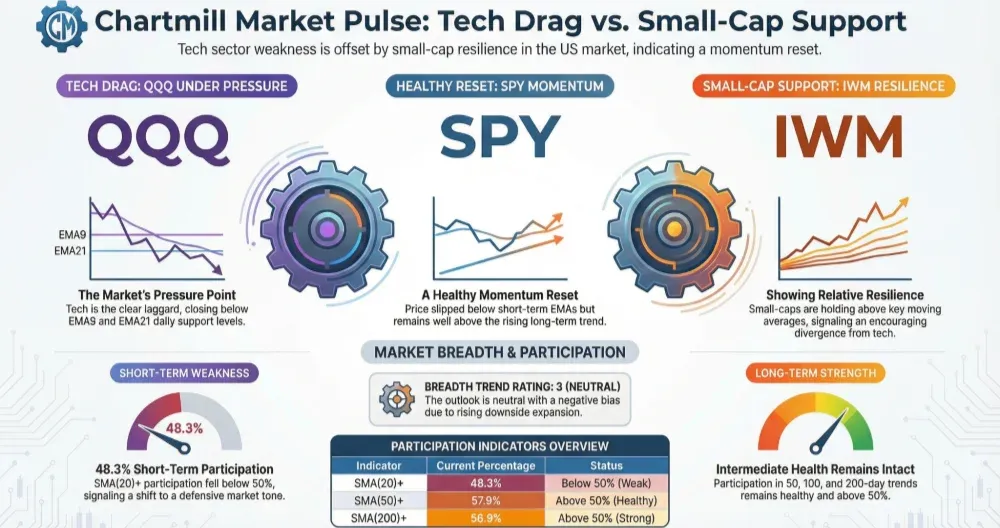
Tuesday’s tape showed a familiar split: large-cap tech weakened (QQQ) and dragged the “average stock” lower, while small-caps (IWM) held up better. Under the hood, short-term breadth slipped back below key thresholds (SMA(20)+ < 50%) and downside expansion picked up, but the intermediate picture (50/100/200-day participation and 1–3 month trends) remains constructive enough to keep the bigger trend intact.
Index overview (SPY, QQQ, IWM)
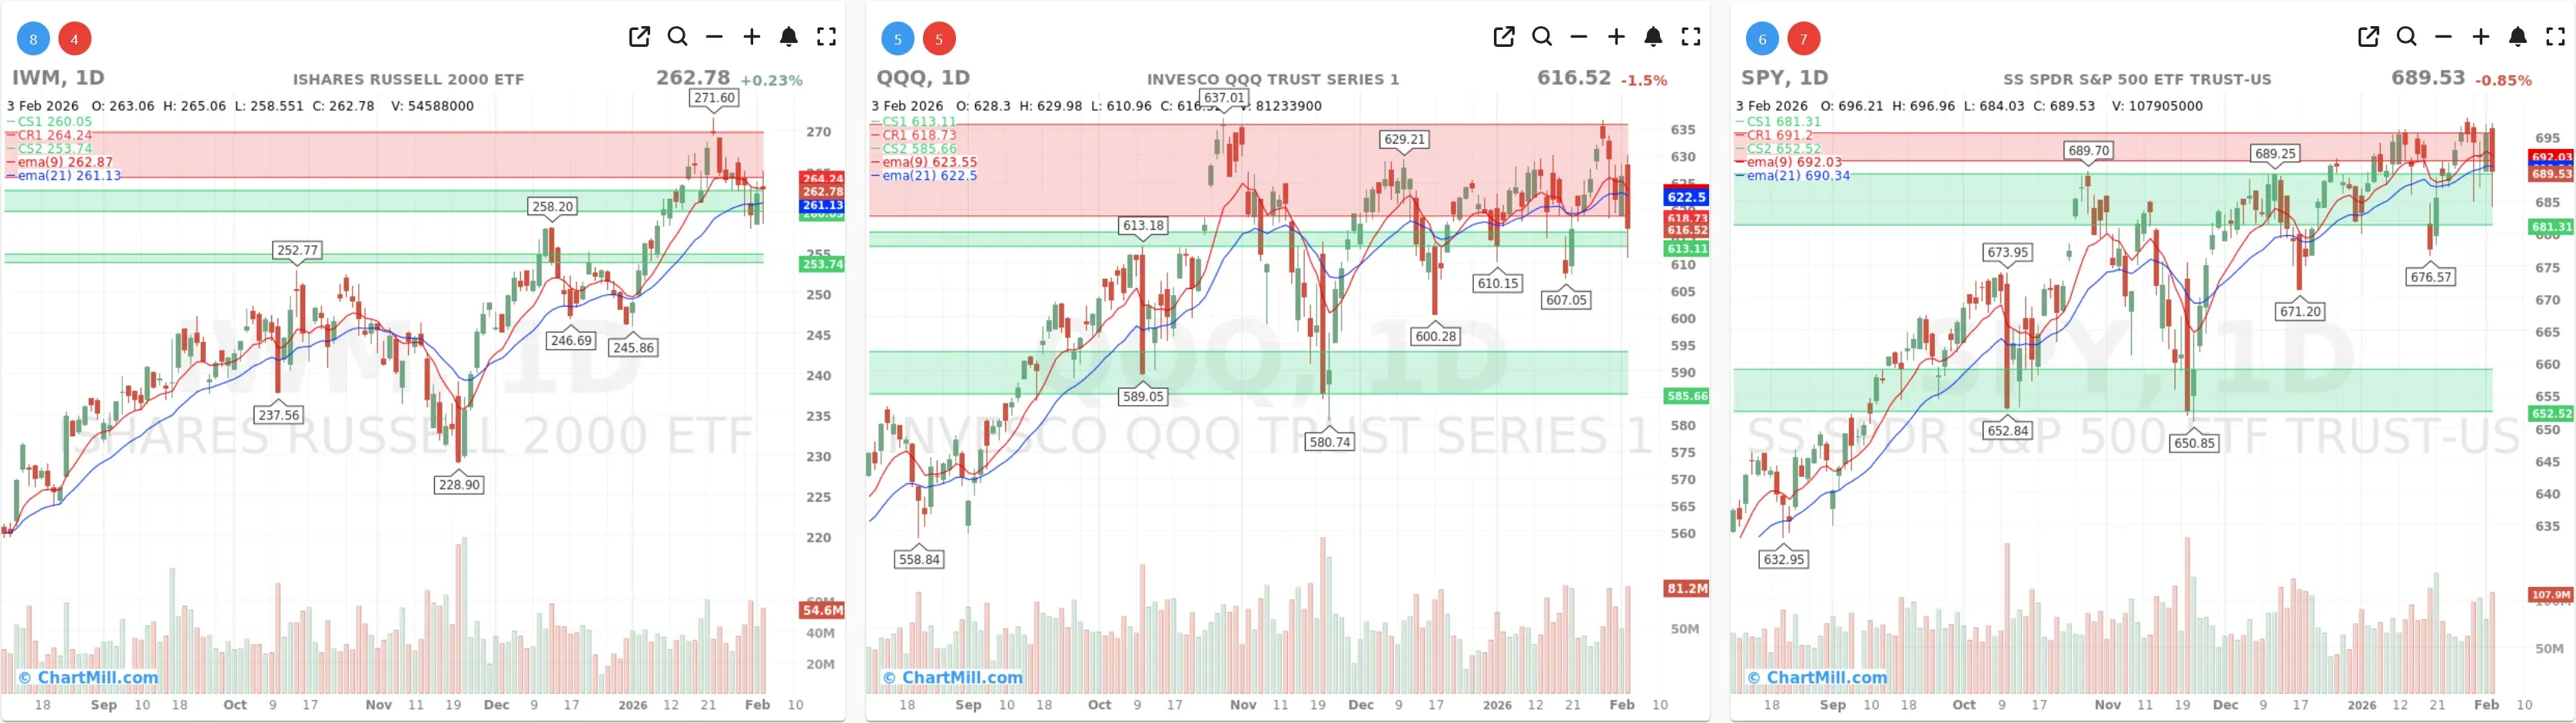
Short Term (Daily)
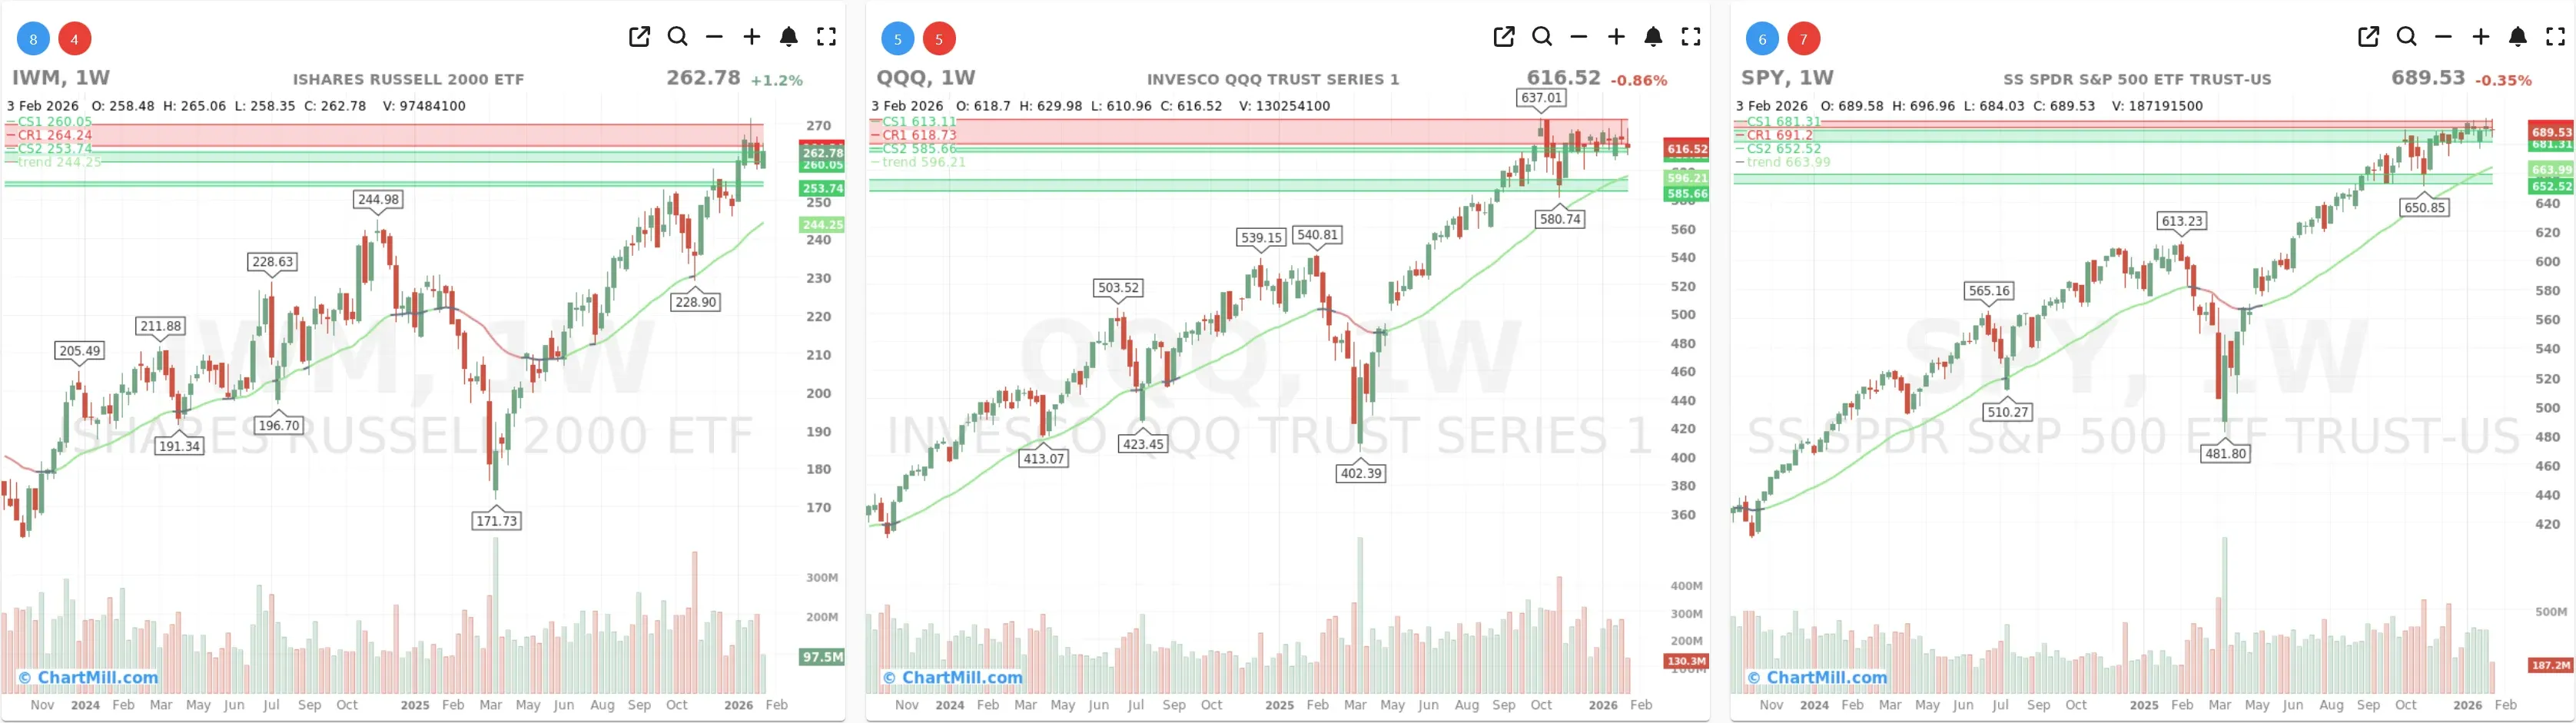
Long Term (Weekly)
SPY - short-term momentum cools
SPY closed lower on the day and slipped back under its EMA9 and roughly around/below the EMA21, which is a typical “momentum reset” signal after an extended advance. The pullback is still happening within the broader uptrend, and the weekly structure remains strong (price still well above the rising long-term trend/30-week EMA).
Interpretation: this looks more like a pause/consolidation than an outright trend break, unless weakness persists and participation continues to deteriorate.
QQQ - the pressure point
QQQ was the clear laggard, closing down notably and below both EMA9 and EMA21 on the daily chart. It’s pulling back into a zone that has acted as important support recently.
On the weekly chart, QQQ still sits above the green long-term trend indicator, but the tight cluster near the highs and repeated reactions in the same zone suggest the market is getting more sensitive to supply.
Interpretation: the market’s “engine” is currently hesitating. If QQQ fails to stabilize near support, breadth typically has a hard time improving meaningfully.
IWM - relative resilience
IWM finished slightly higher and is still holding above the EMA21 (and very close to the EMA9). The chart shows consolidation near recent highs rather than distribution. On the weekly timeframe, IWM remains above the green long-term trend indicator, which reinforces the idea that small-caps are not breaking down with tech.
Interpretation: this is an encouraging divergence. If IWM can keep holding up while QQQ stabilizes, breadth could “repair” quickly.
Market breadth (10-day view)

Daily breadth weakened again
-
Advancing stocks (day): 47.8% vs 56.6% the prior session
-
Declining stocks (day): 49.1% (a slight edge to decliners)
-
Downside expansion increased: Decliners >4%: 8.2% vs 3.5% prior day
-
Upside expansion improved slightly: Advancers >4%: 5.6% vs 4.3%
Takeaway: the market didn’t collapse, but risk-off tails widened—more stocks saw sharp downside moves. That’s usually what you see when leadership (often QQQ) is under pressure.
Participation slipped below a key short-term line
-
SMA(20)+: 48.3% (down from 51.1%) → now below 50%
-
SMA(50)+: 57.9% (still healthy, but lower than recent highs)
-
SMA(100)+: 54.5%
-
SMA(200)+: 58.9%
Takeaway: this is the most important shift today. Short-term participation fell back under 50%, which often coincides with choppier price action and more failed breakouts. But the 50/100/200-day participation remains above 50%, so the market is cooling—not breaking.
New highs still lead, but new lows are rising
-
New Highs: 8.6% (up from 5.7%)
-
New Lows: 4.5% (up from 2.5%)
Takeaway: this is a classic “mixed tape” signature: some stocks are still pushing to fresh highs, but internal stress is building as more names start printing new lows too. That aligns well with what we see in the index split (QQQ weak, IWM steadier).
Weekly breadth turned more defensive
- Advancing (week): 37.6% vs Declining (week): 61.4% (also weaker than the prior session’s already-negative weekly split)
Takeaway: this confirms that the market’s short-term tone is drifting defensive. Even if the major indices don’t drop sharply, this kind of weekly skew often shows up as rotation, chop, and narrower leadership.
1–3 month trends still support the bigger picture
-
Advancing (month): 58.4% vs Declining (month): 41%
-
Advancing (3 months): 59.8% vs Declining (3 months): 39.3%
Takeaway: medium-term breadth remains constructive. That’s why the weekly charts still look fine: we’re seeing short-term damage, but not a broad market trend break.
What changed versus the previous trading day (Feb 2)
Yesterday’s setup hinted at stabilization: daily breadth was positive and downside expansion was contained. Today, the stabilization attempt didn’t follow through:
-
Daily breadth flipped from net positive to slightly negative
-
SMA(20)+ fell back below 50%
-
Decliners >4% jumped sharply (a meaningful deterioration)
-
Weekly breadth became even more lopsided to decliners
-
Meanwhile, IWM held up, which prevented the picture from turning outright bearish
In short: the market is still trying to rotate, but tech weakness is keeping overall breadth from improving.
Breadth trend rating (1–7)
Rating: 3 — neutral, negative bias
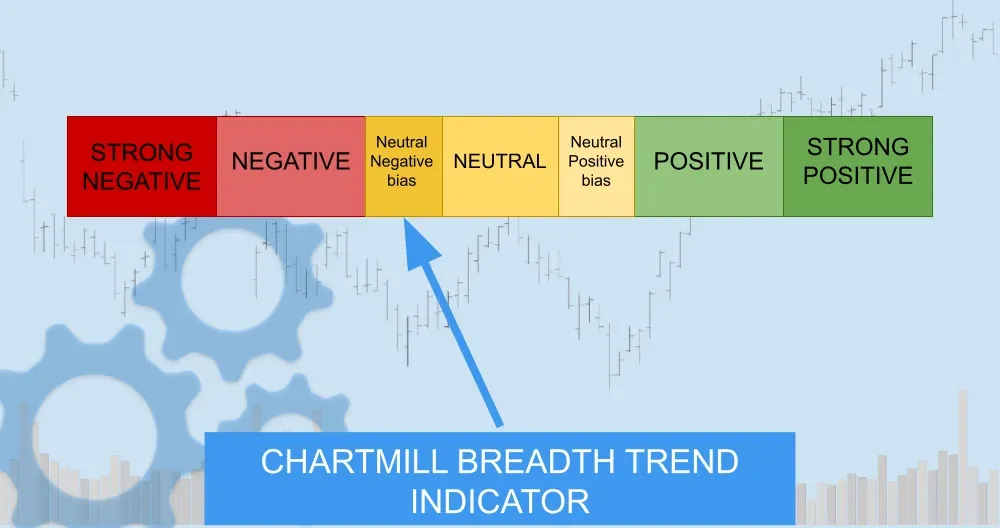
The long-term and intermediate participation metrics are still okay, but the loss of short-term participation (SMA20+ < 50%), the rise in downside expansion, and the weak weekly breadth skew keep the near-term tone defensive.
For this to improve, you’d typically want to see QQQ stabilize and daily breadth push back above the 50% line with fewer >4% decliners.
Kristoff
Next to read: AI Panic Hits Software, PayPal Faceplants, Walmart Joins the $1T Club