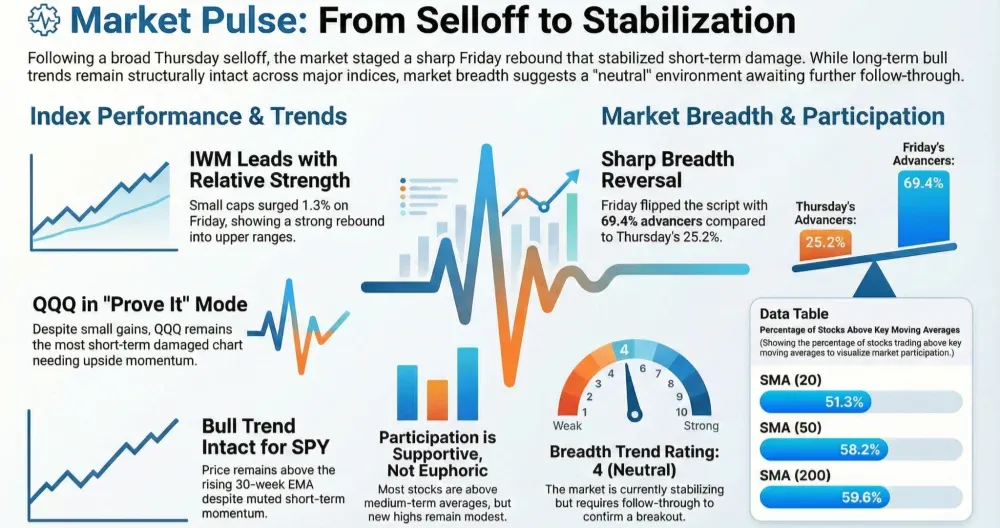

After Thursday’s broad selloff, market internals snapped back sharply on Friday with a clear tilt toward advancers. The rebound helps stabilize the short-term damage, but participation is still more “repair mode” than “all-clear,” with only modest expansion in new highs and a still-choppy week-to-date backdrop.
Index overview (SPY, QQQ, IWM)
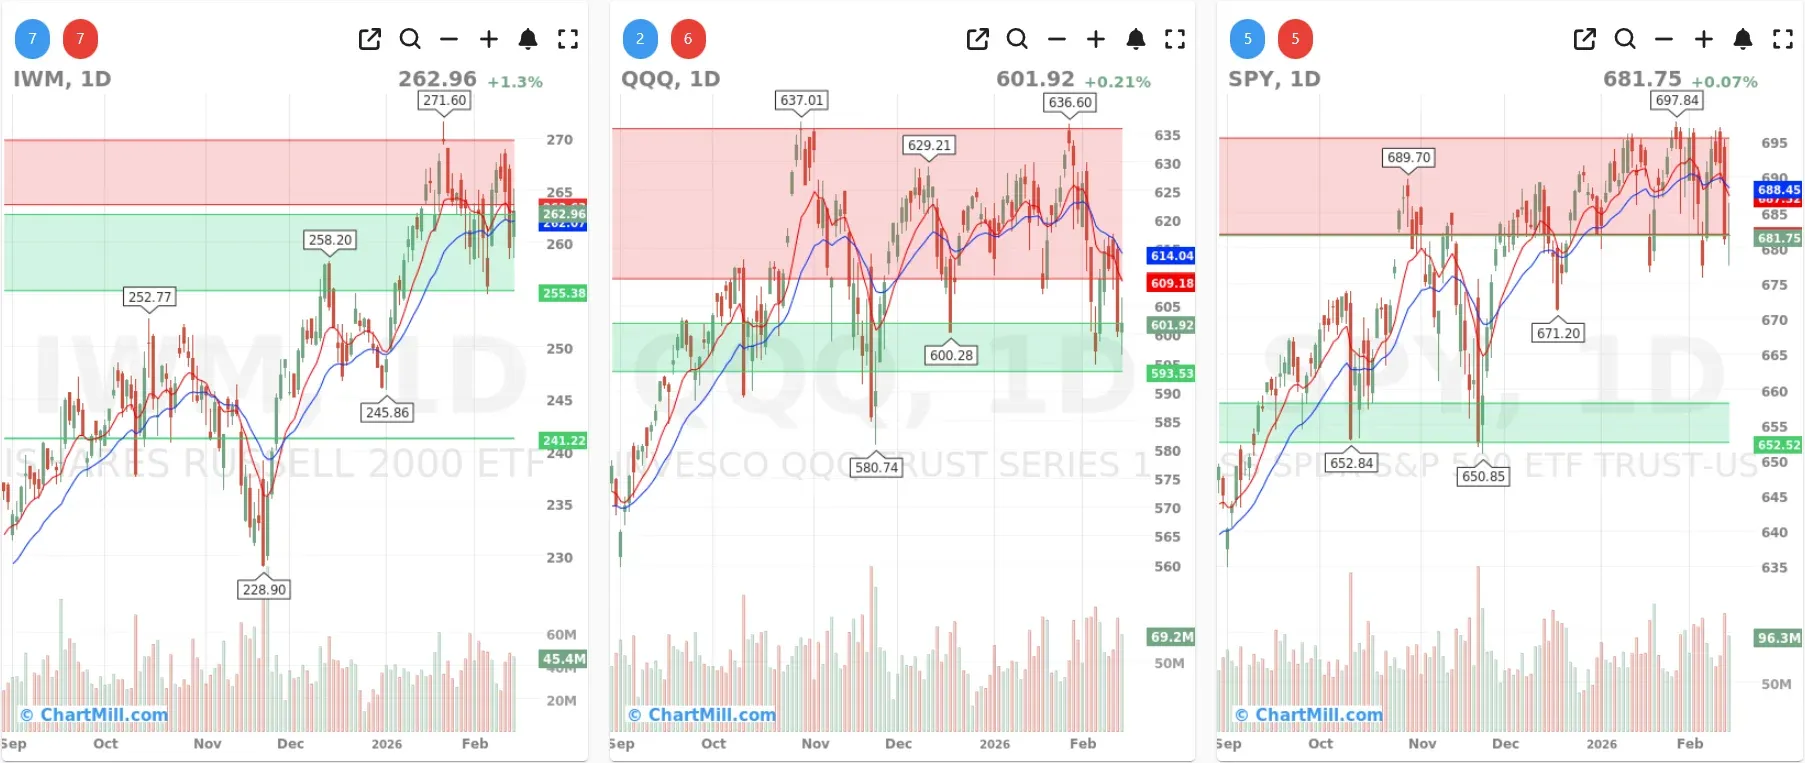
Short Term (Daily)
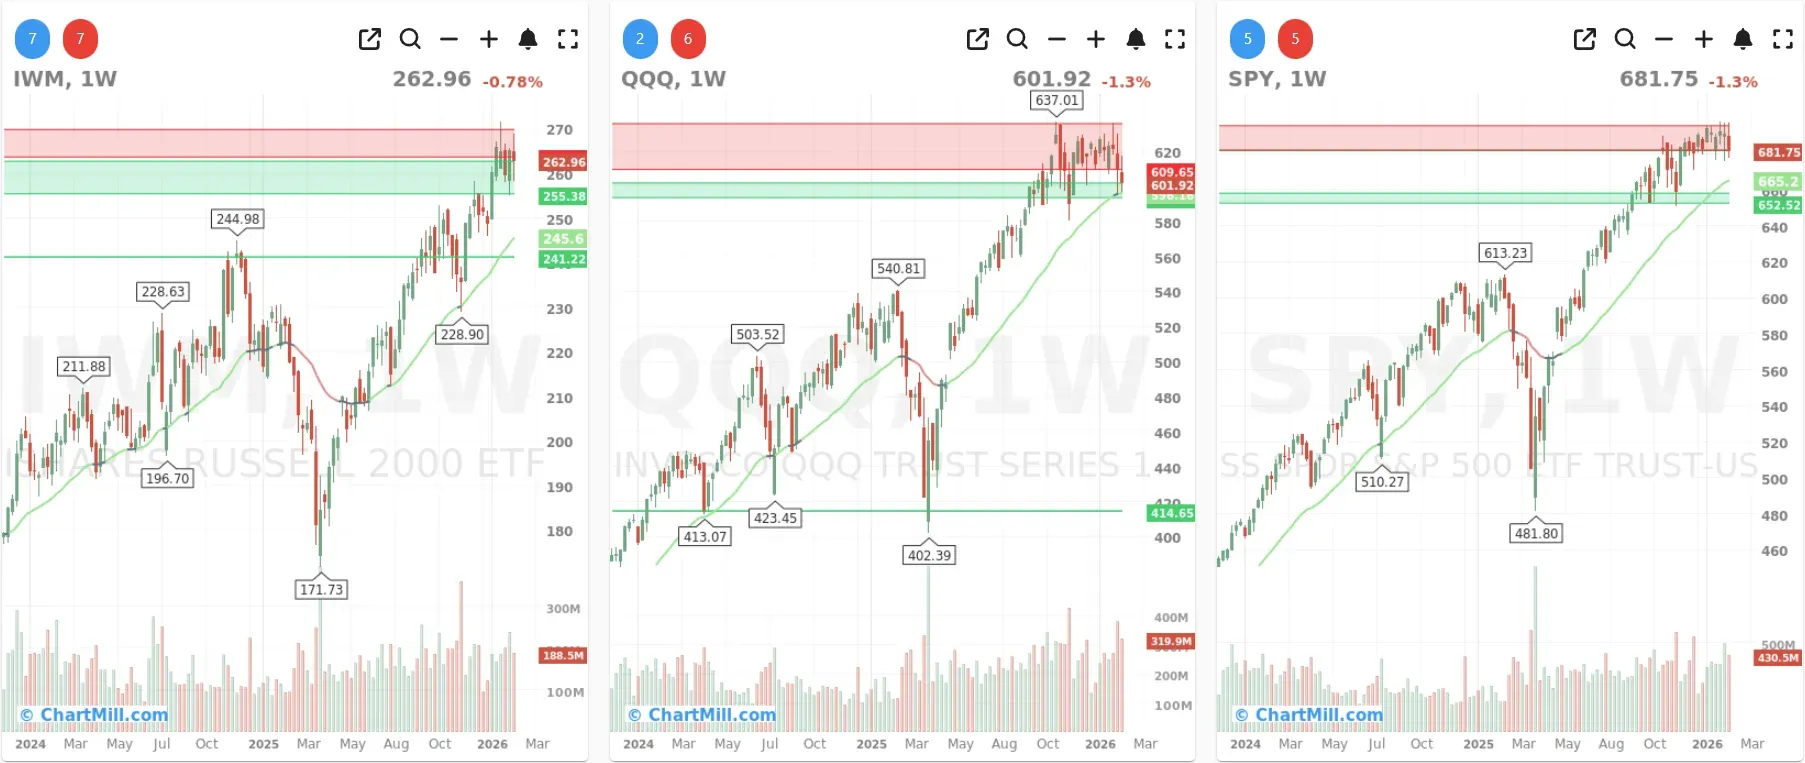
Long Term (Weekly)
SPY
SPY ended essentially flat on the day (+0.07%), continuing to digest near the upper end of its recent range. On the daily chart, price remains in a consolidation band just under/around prior highs, with the short-term averages (EMA9/EMA21) still clustered nearby, typical of a market that’s pausing rather than breaking down.
On the weekly chart, the longer-term structure remains constructive: price is still well above the rising 30-week EMA (green Trend Indicator), despite a slightly negative week. Net: bull trend intact, short-term momentum muted.
QQQ
QQQ managed a small gain on Friday (+0.21%), but compared to SPY and IWM it still looks like the most “damaged” short-term chart. The daily view shows QQQ trying to rebound after a sharp drop into the lower part of its range, but it remains below/near the short-term moving averages, suggesting the bounce is still a recovery attempt rather than renewed trend momentum.
Weekly trend remains positive structurally (still above the 30-week EMA), but this week’s pullback keeps QQQ in “prove it” mode: it needs follow-through to rebuild upside momentum.
IWM
IWM was the clear relative strength leader on Friday (+1.3%). The daily chart shows a strong rebound back into the upper area of its range, with price holding up well versus its short-term averages. This is the kind of action you want to see if the market is rotating back toward broader participation.
Weekly trend remains positive (above a rising 30-week EMA). Even with a slightly negative week, IWM’s resilience is a constructive breadth tell—as long as it continues.
Market breadth (10-day view)

A dramatic day-to-day reversal
Thursday was a textbook “risk-off” breadth day (Adv Day 25.2% vs Decl Day 72.4%, with Decliners >4% at 11.3%). Friday flipped that script: Adv Day surged to 69.4% while Decl Day dropped to 27.9%. That’s a hard reset in short-term tone.
This kind of whipsaw often shows up in volatile, range-bound markets: sellers press, markets snap back, and the real signal becomes whether follow-through appears in the days after.
####** Participation is improving, but not “breakout strong”**
% above key moving averages is supportive but not euphoric:
-
SMA(20)+ 51.3% (barely back above the line)
-
SMA(50)+ 58.2%, SMA(100)+ 58.3%, SMA(200)+ 59.6% (medium/longer-term participation still healthy)
New Highs vs New Lows improved in a risk-friendly way:
-
NH 4.5% vs NL 1.7% (good: fewer stocks breaking down)
-
But NH is still modest, reinforcing the idea that we’re stabilizing.
Zooming out: the week is still mixed
Weekly breadth remains slightly defensive with Decl Week 50.4% edging Adv Week 48.6%. That aligns with what we see in the indexes: strong longer-term trends, but short-term action that’s still choppy and headline-sensitive.
Breadth Trend Rating: 4 — Neutral
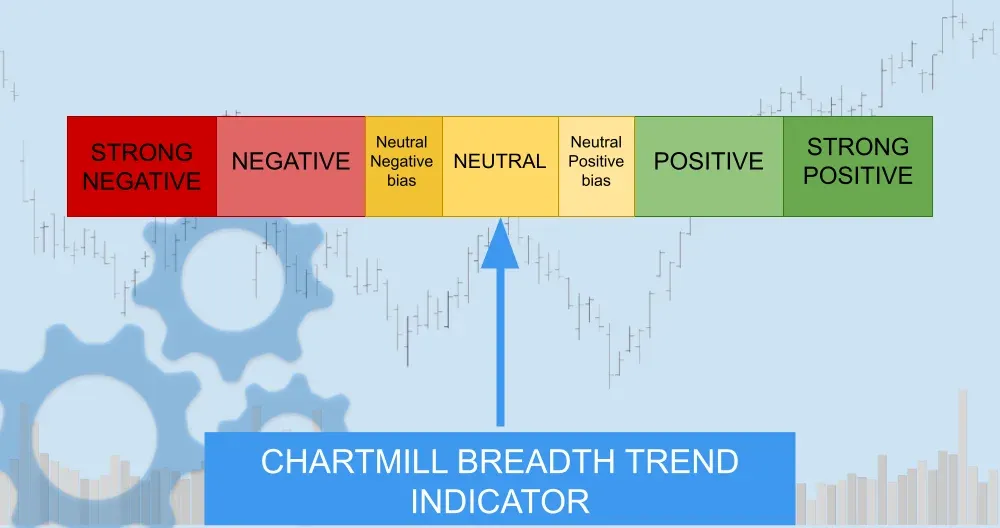
Friday delivered a powerful breadth rebound after Thursday’s selloff, helping stabilize the short-term damage. Still, with weekly breadth slightly tilted toward decliners and new highs remaining modest, the market remains best classified as neutral until we see follow-through.
Kristoff - ChartMill
Next to read: Inflation Cools but AI Heat Still Blisters: A Post-Holiday Market Diagnostic