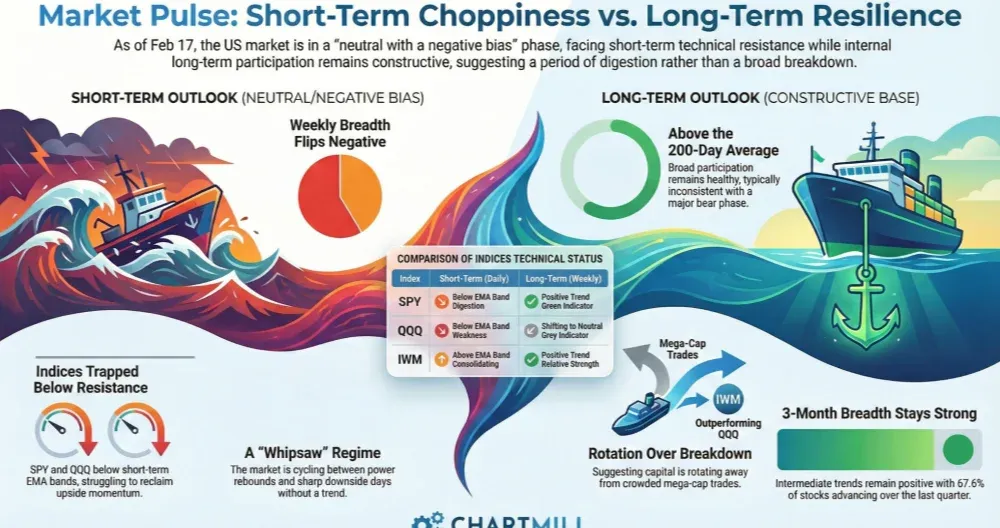

Tuesday’s breadth cooled back to “coin-flip” territory after last week’s strong rebound day, while SPY and QQQ remain trapped beneath overhead resistance and below their short-term EMA bands. Under the surface, longer-term participation is still constructive (≈60%+ above the 200D), but the short-term tape is turning choppier again, especially on a weekly breadth basis.
Index overview (SPY, QQQ, IWM)
Short Term (Daily)

Long Term (Weekly)
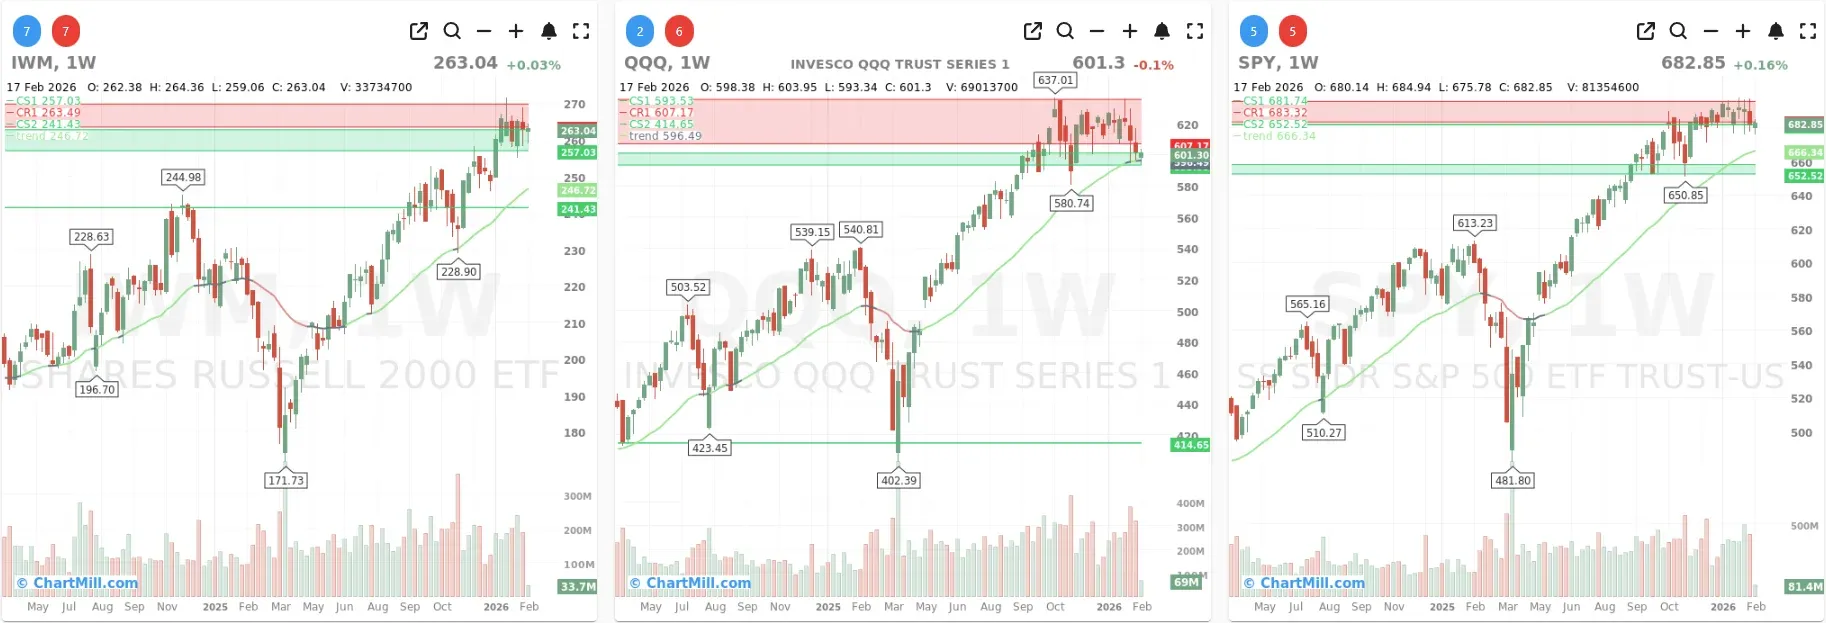
SPY
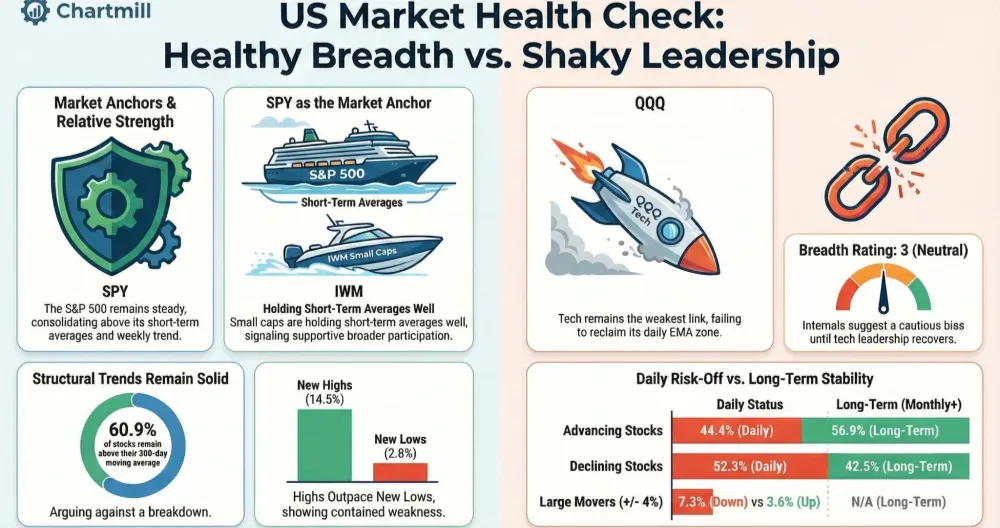
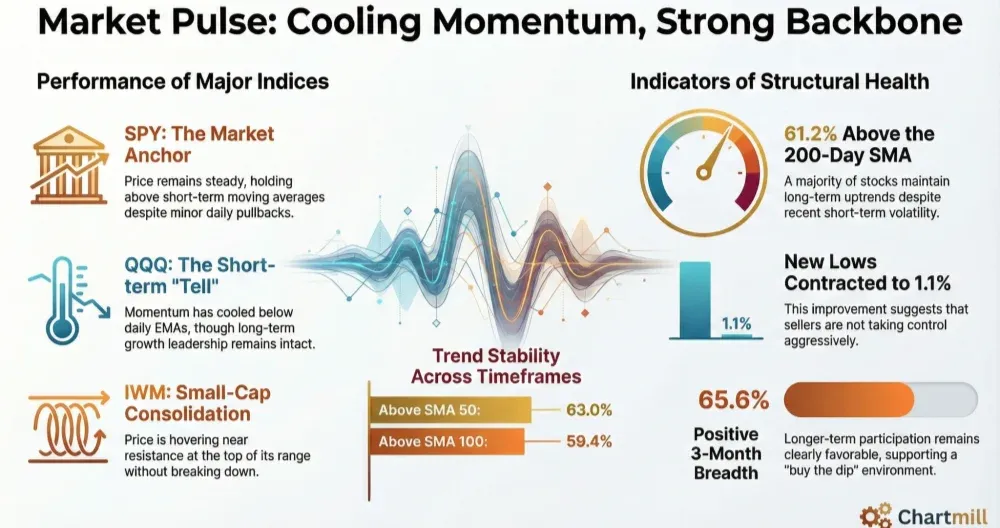
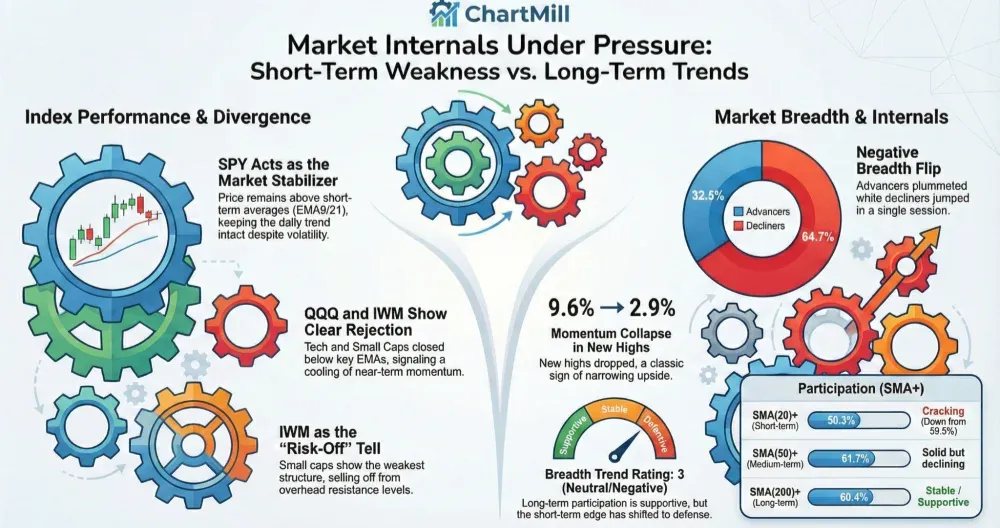
Daily: Price is still below the EMA9/EMA21 band, showing fading short-term momentum after repeated tests near the upper resistance zone (~690–698). The structure still looks like a sideways digestion near highs, but the inability to reclaim the short EMA band keeps SPY in “wait-and-see” mode.
Weekly: The longer-term trend remains positive (Trend Indicator/30-week EMA is still green), and price is holding well above the trend line. However, the weekly candles show stalling under resistance, consistent with breadth losing short-term traction.
QQQ
Daily: The clearest sign of short-term weakness: QQQ is below EMA9 and EMA21, and trading inside a wide consolidation range. Momentum has shifted from “buy dips” to “prove it first,” with price leaning toward the lower part of the range.
Weekly: Trend Indicator is shifting to grey, QQQ is pressing down toward the trend line, indicating the start of a neutral long-term trend (confirmation needed on friday's close) . If QQQ can’t stabilize quickly, it tends to show up first in breadth (as we’re seeing now).
IWM
Daily: IWM is still sitting on/just above the EMA band, holding up better than QQQ. It’s consolidating near a well-defined resistance zone in the mid/high-260s.
Weekly: Trend Indicator remains green, with price comfortably above the trend line. This relative stability vs. QQQ hints at rotation away from the most crowded growth/mega-cap trade, rather than a broad market breakdown.
Market breadth (10-day view)
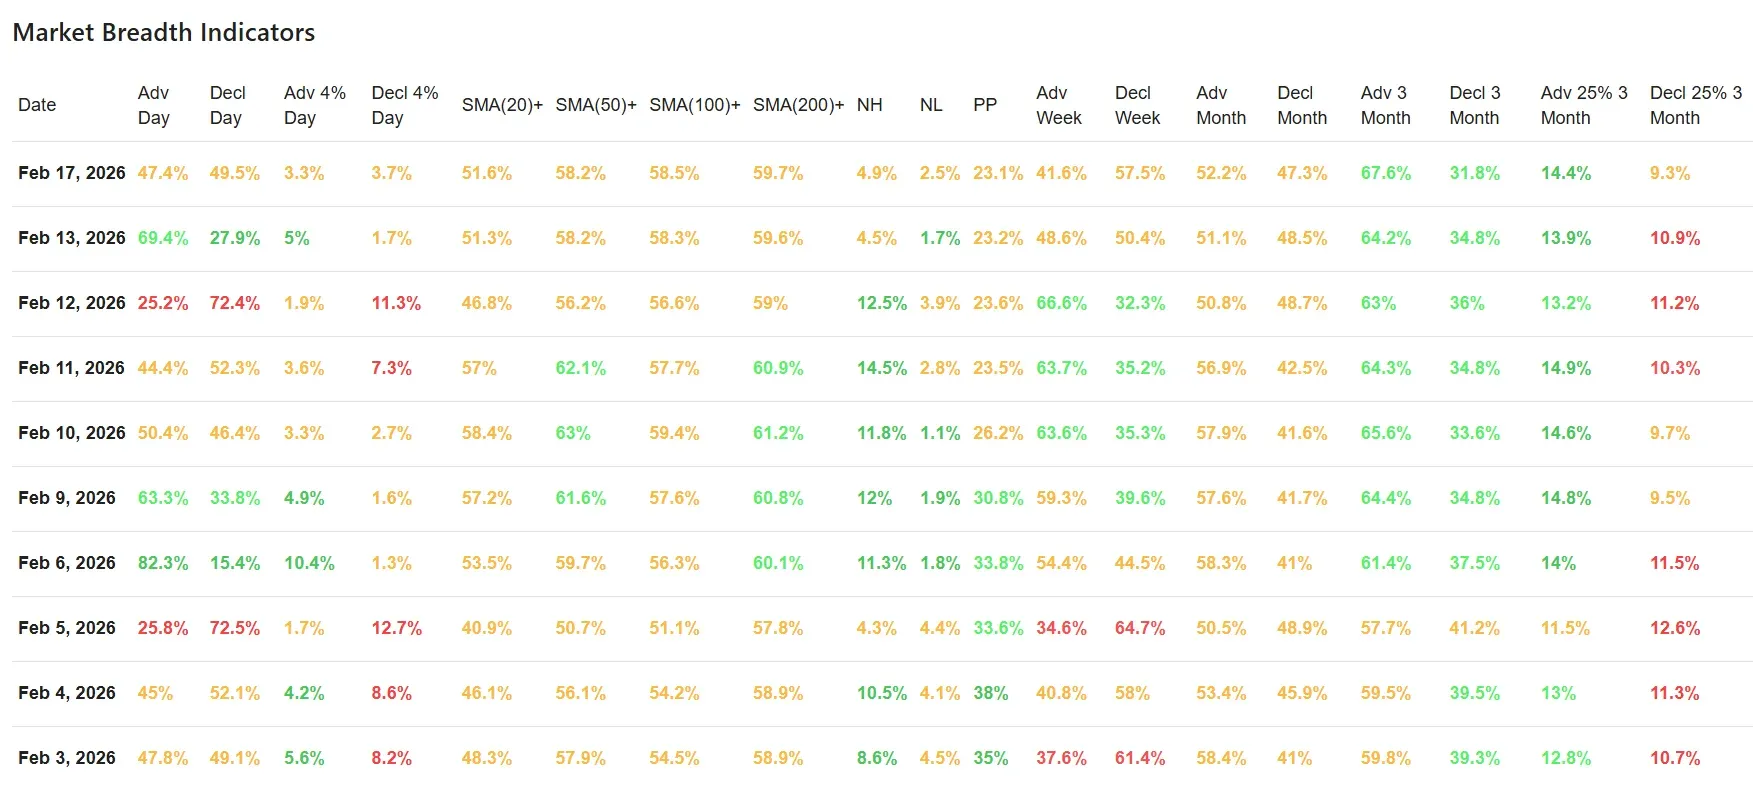
1) Daily advance/decline: momentum faded again
Feb 17: Adv 47.4% vs Decl 49.5% → essentially flat-to-slightly negative day.
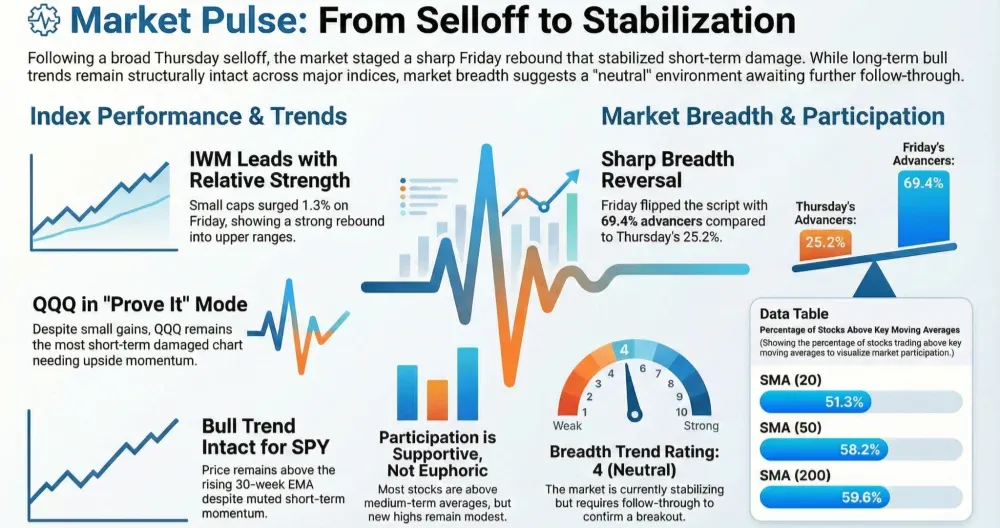
This is a clear cooling versus the prior trading day in your dataset (Feb 13), which was a strong upside breadth day (Adv 69.4% / Decl 27.9%).
Pattern vs. the prior day: Friday looked like a “breadth rebound that could restart upside momentum.” Tuesday did not confirm that. Instead, it reverted to indecision, consistent with the index charts stalling under resistance.
Extreme moves (+/-4%): balanced, but still fragile
Feb 17: Adv +4%: 3.3% vs Decl -4%: 3.7% (slightly more downside extremes).
Over the last 10 sessions, the tape has been bi-polar:
-
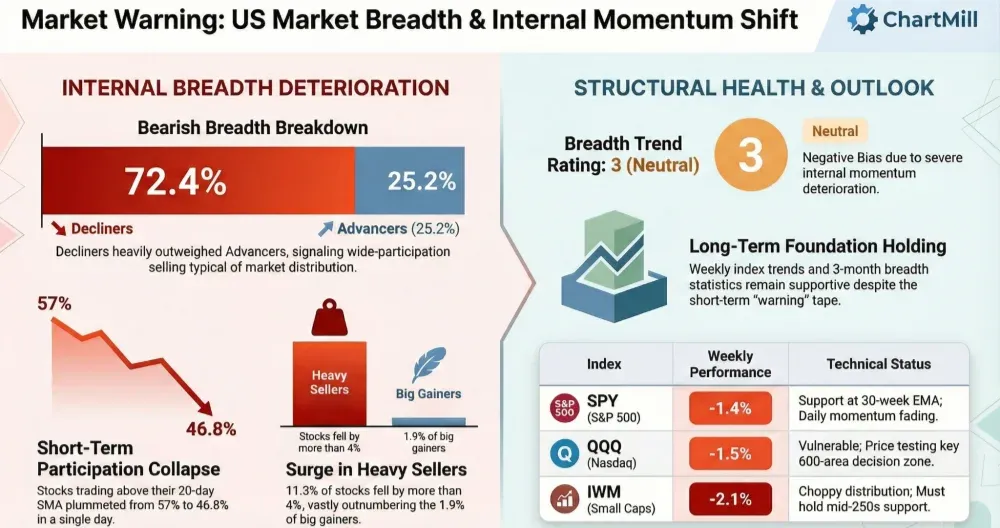
Very weak downside days: Feb 5 and Feb 12 had ~72% decliners and double-digit -4% decliners.
-
Power rebound days: Feb 6 (82.3% adv) and Feb 13 (69.4% adv).
Interpretation: This is not a smooth trending environment. It’s a rotation/whipsaw regime, where rebounds happen—but follow-through is inconsistent.
3) Participation (percent above moving averages): longer-term still OK, short-term choppy
-
Above 20D: 51.6% (barely positive)
-
Above 50D: 58.2%
-
Above 100D: 58.5%
-
Above 200D: 59.7%
This is an important “tell”: the market is not internally broken. Roughly ~60% of stocks remain above the 200D, which is typically inconsistent with a broad bear phase.
But the 20D number hovering near 50% matches what we see in SPY/QQQ: short-term trend is softening.
4) New highs / new lows: still net positive, but not “thrusting”
Feb 17: NH 4.9% vs NL 2.5% → still positive, but modest.
Earlier in the period, NH was materially stronger (double-digit readings), which aligned with the stronger upside phases.
Interpretation:
Leadership is still present, but it’s narrowing—and that’s exactly what QQQ’s chart is hinting at.
5) Multi-day breadth (week/month/3-month): short-term negative, longer-term positive
- Weekly breadth (Feb 17): AdvWeek 41.6% vs DeclWeek 57.5% → negative.
-Monthly breadth: AdvMonth 52.2% vs DeclMonth 47.3% → still slightly positive.
-3-Month breadth: Adv3Month 67.6% vs Decl3Month 31.8% → clearly positive.
- Big movers over 3 months: Adv25% 14.4% vs Decl25% 9.3% → still constructive.
Interpretation:
The short-term damage/softness is real (weekly breadth negative), but the intermediate trend remains intact. This is consistent with: “market digestion near highs,” not a confirmed breakdown.
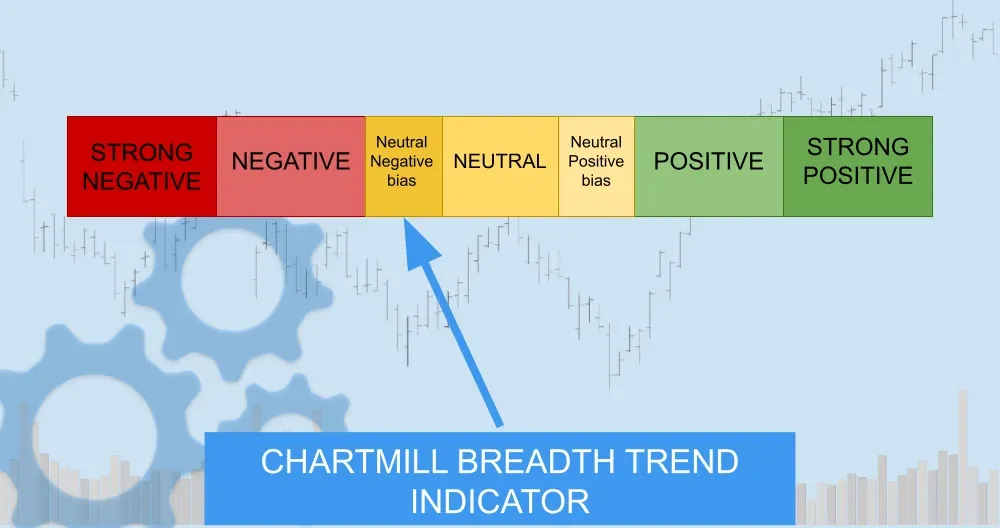
Breadth trend rating (1–7)
Rating: 3 — neutral, with a negative bias
(-) Short-term breadth failed to confirm the prior upside day and weekly breadth flipped clearly negative.
(-) SPY/QQQ are below their short EMA bands and still capped by resistance.
(+) Longer-term participation remains supportive (~60% above 200D; 3-month breadth strong), so this is still a stall/rotation warning.
Practical read (what the data is saying in plain language)
We’re seeing a market that can still rally, but is increasingly selective and headline-sensitive, with fast reversals. The longer-term structure remains constructive, yet short-term conditions are drifting toward “risk management first” until SPY/QQQ can reclaim their EMA bands and breadth improves beyond the ~50/50 zone.
Kristoff - ChartMill
Next to read: AI Anxiety Meets a Thrifty Consumer: Wall Street’s Post-Holiday Reality Check