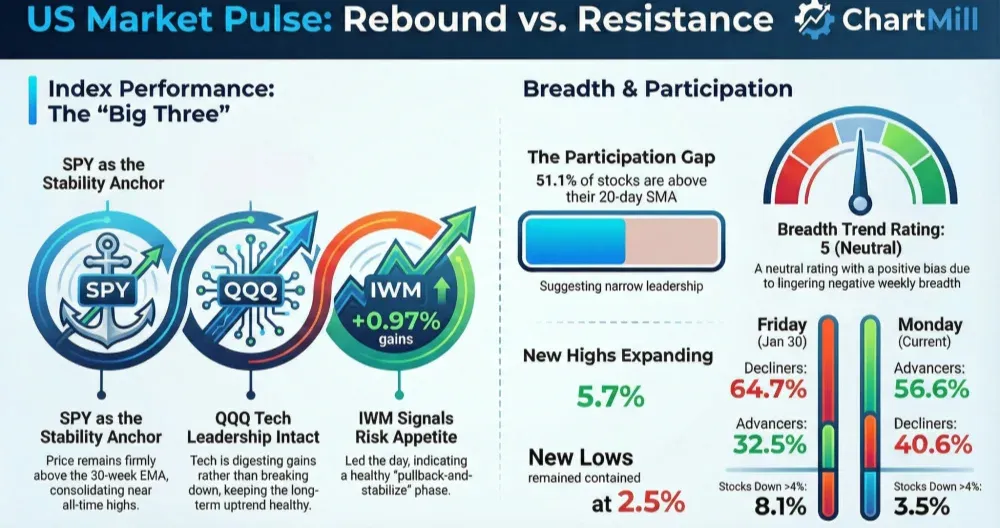
Monday’s tape leaned risk-on again: SPY, QQQ, and IWM all closed higher and stayed in well-defined uptrends on both the daily and weekly timeframes. Breadth improved meaningfully versus Friday’s “decliners-dominated” session, but the weekly breadth balance is still negative and the % of stocks above key moving averages hasn’t expanded, suggesting this rebound is real, yet not fully “broad and powerful”.
Index overview (SPY, QQQ, IWM)
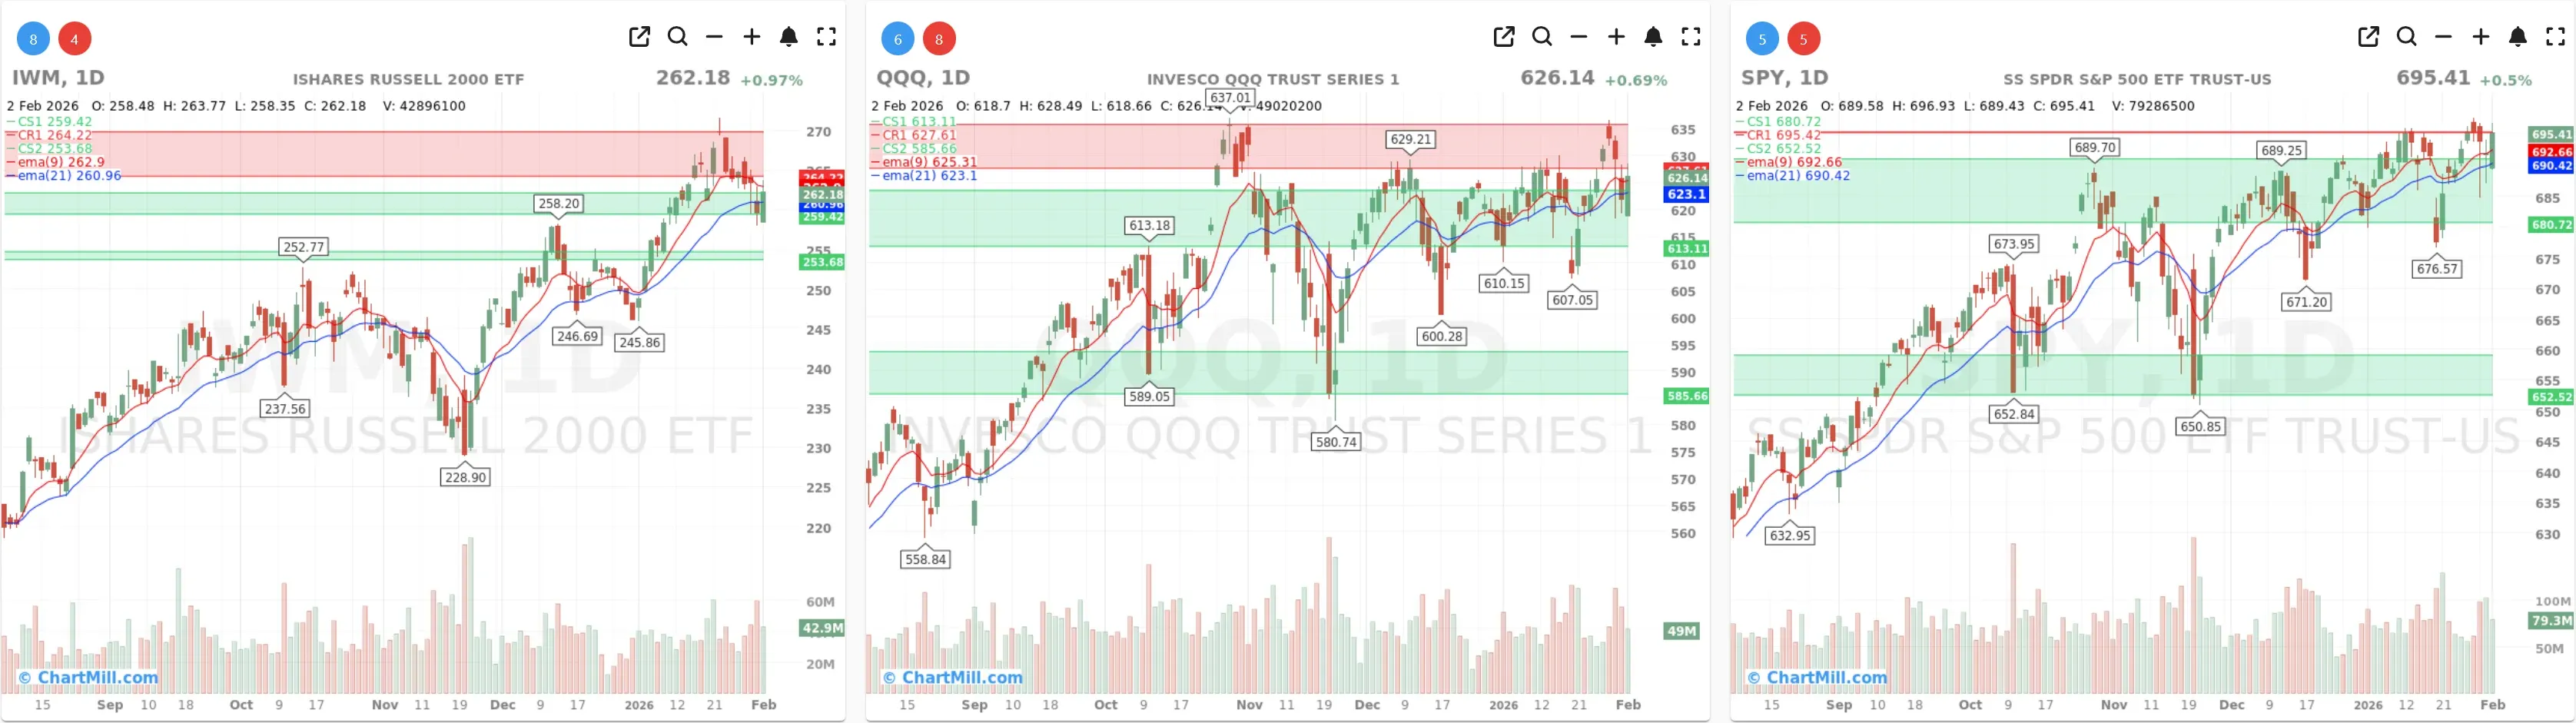
Short Term (Daily)
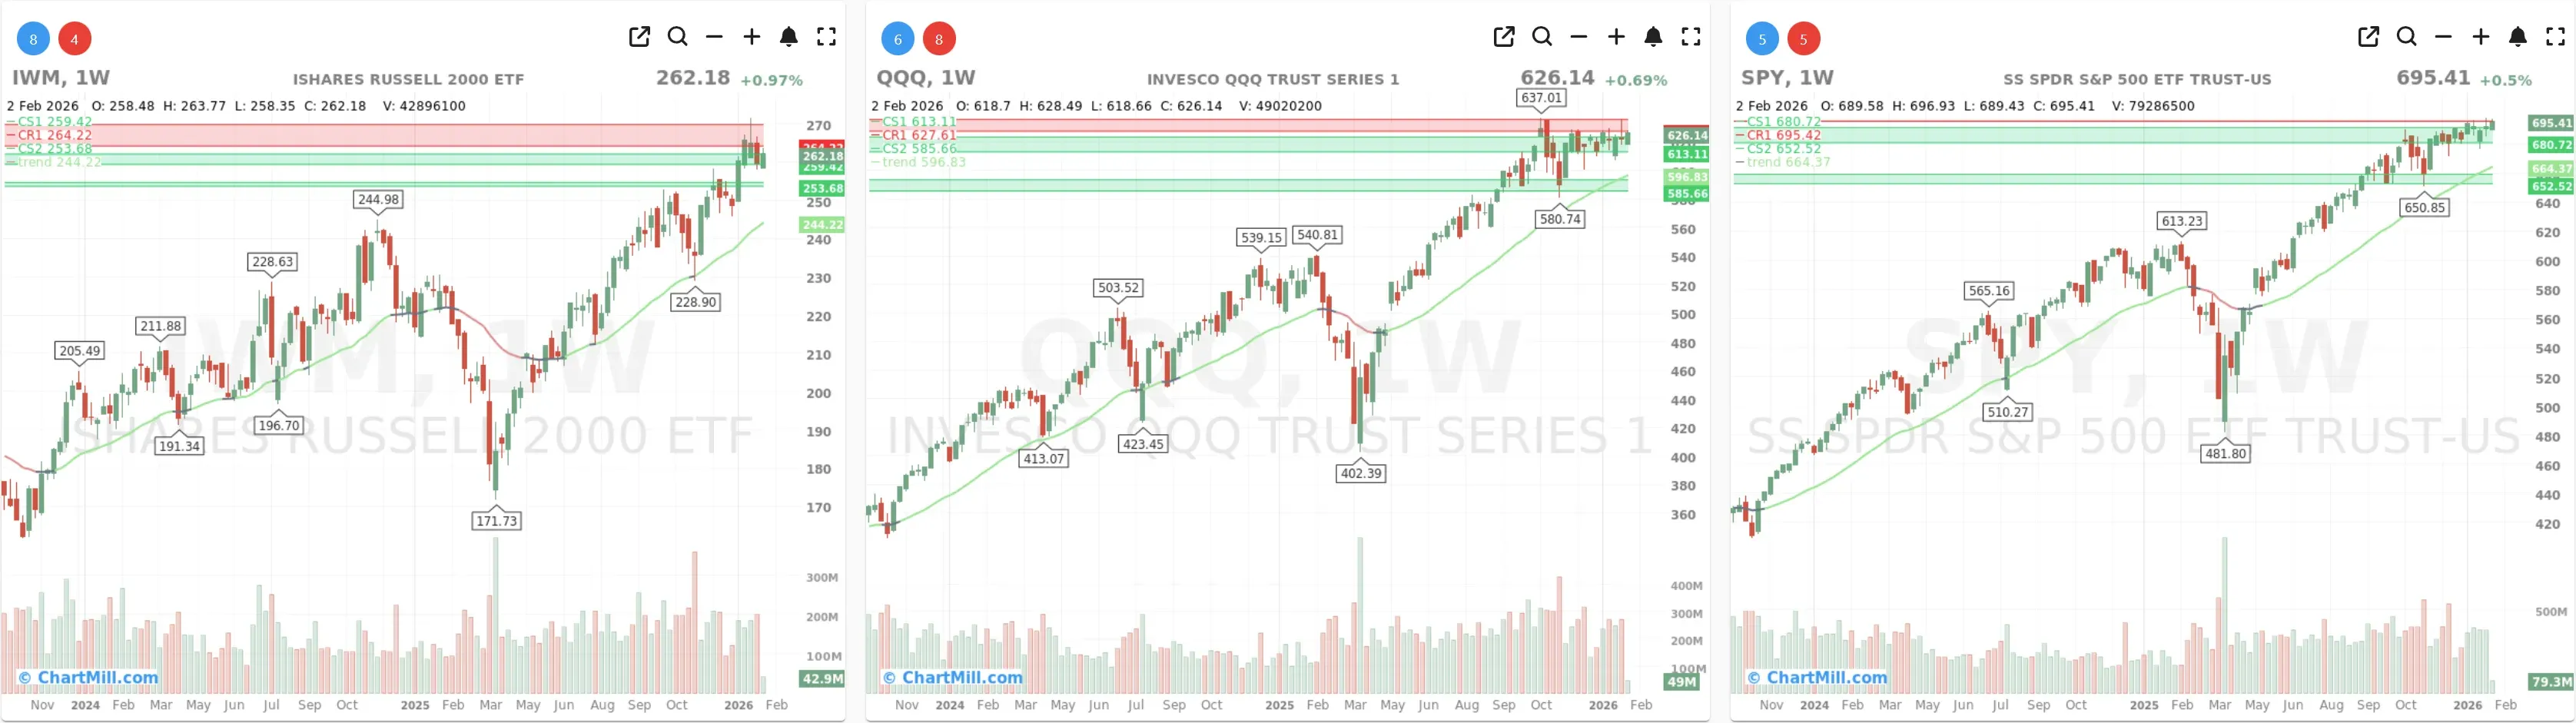
Long Term (Weekly)
SPY
Daily: SPY finished +0.5%, holding above both EMA9 and EMA21. Price action remains a grind-up near the top of the recent range, with pullbacks staying contained and quickly bought.
Weekly: The long-term picture remains constructive: price is firmly above the 30-week EMA and the trend backdrop stays bullish. The market is still behaving like a trend that’s consolidating near highs, not rolling over.
Takeaway: SPY continues to act as the “stability anchor.” As long as dips are defended around the short-term EMAs, the path of least resistance remains sideways-to-higher.
QQQ
Daily: QQQ closed +0.69%, back above EMA9/EMA21 and pushing toward the upper area of its recent range. The pattern still looks like tightening consolidation with buyers stepping in on weakness.
Weekly: QQQ remains strong structurally, well above the 30-week EMA, and still in a long-term uptrend. It’s not exploding higher, but it also isn’t breaking down, more “digesting gains” than “distribution.”
Takeaway: Tech leadership is intact, but the real confirmation would be broader participation (see breadth section). Right now, it’s supportive but not a decisive “all-clear.”
IWM
Daily: IWM led on the day (+0.97%) and bounced back toward its short-term trend zone. It’s hovering around EMA9 and remains above EMA21, which fits a healthy “pullback-and-stabilize” phase after the recent run.
Weekly: Small caps still look constructive on the bigger timeframe, above the 30-week EMA and pressing into a notable resistance area near prior highs. Some hesitation near that ceiling is normal.
Takeaway: IWM showing relative strength on the day is a positive “risk appetite” tell. The next question: can it turn this into follow-through, or does it keep chopping under resistance?
Market breadth (10-day view)
What changed vs Friday (Jan 30)?
Friday’s breadth was clearly defensive:
-
Advancers: 32.5% vs Decliners: 64.7%
-
Big down day pressure: 8.1% of stocks down >4%
Monday reversed a good chunk of that internal damage:
-
Advancers: 56.6% vs Decliners: 40.6%
-
Big movers improved: 4.3% up >4%, while only 3.5% down >4%
Interpretation: This is exactly the type of “snap-back” you want to see after a weak breadth day: fewer heavy selloffs, more upside thrust, and a better adv/dec profile. It doesn’t automatically mean the all-clear, but it does suggest Friday’s weakness didn’t immediately cascade.
Participation: improving short-term, still mixed underneath
Moving-average participation (trend health)
Despite the better day-to-day breadth, the “how many stocks are in uptrends?” metrics remain stuck rather than expanding:
-
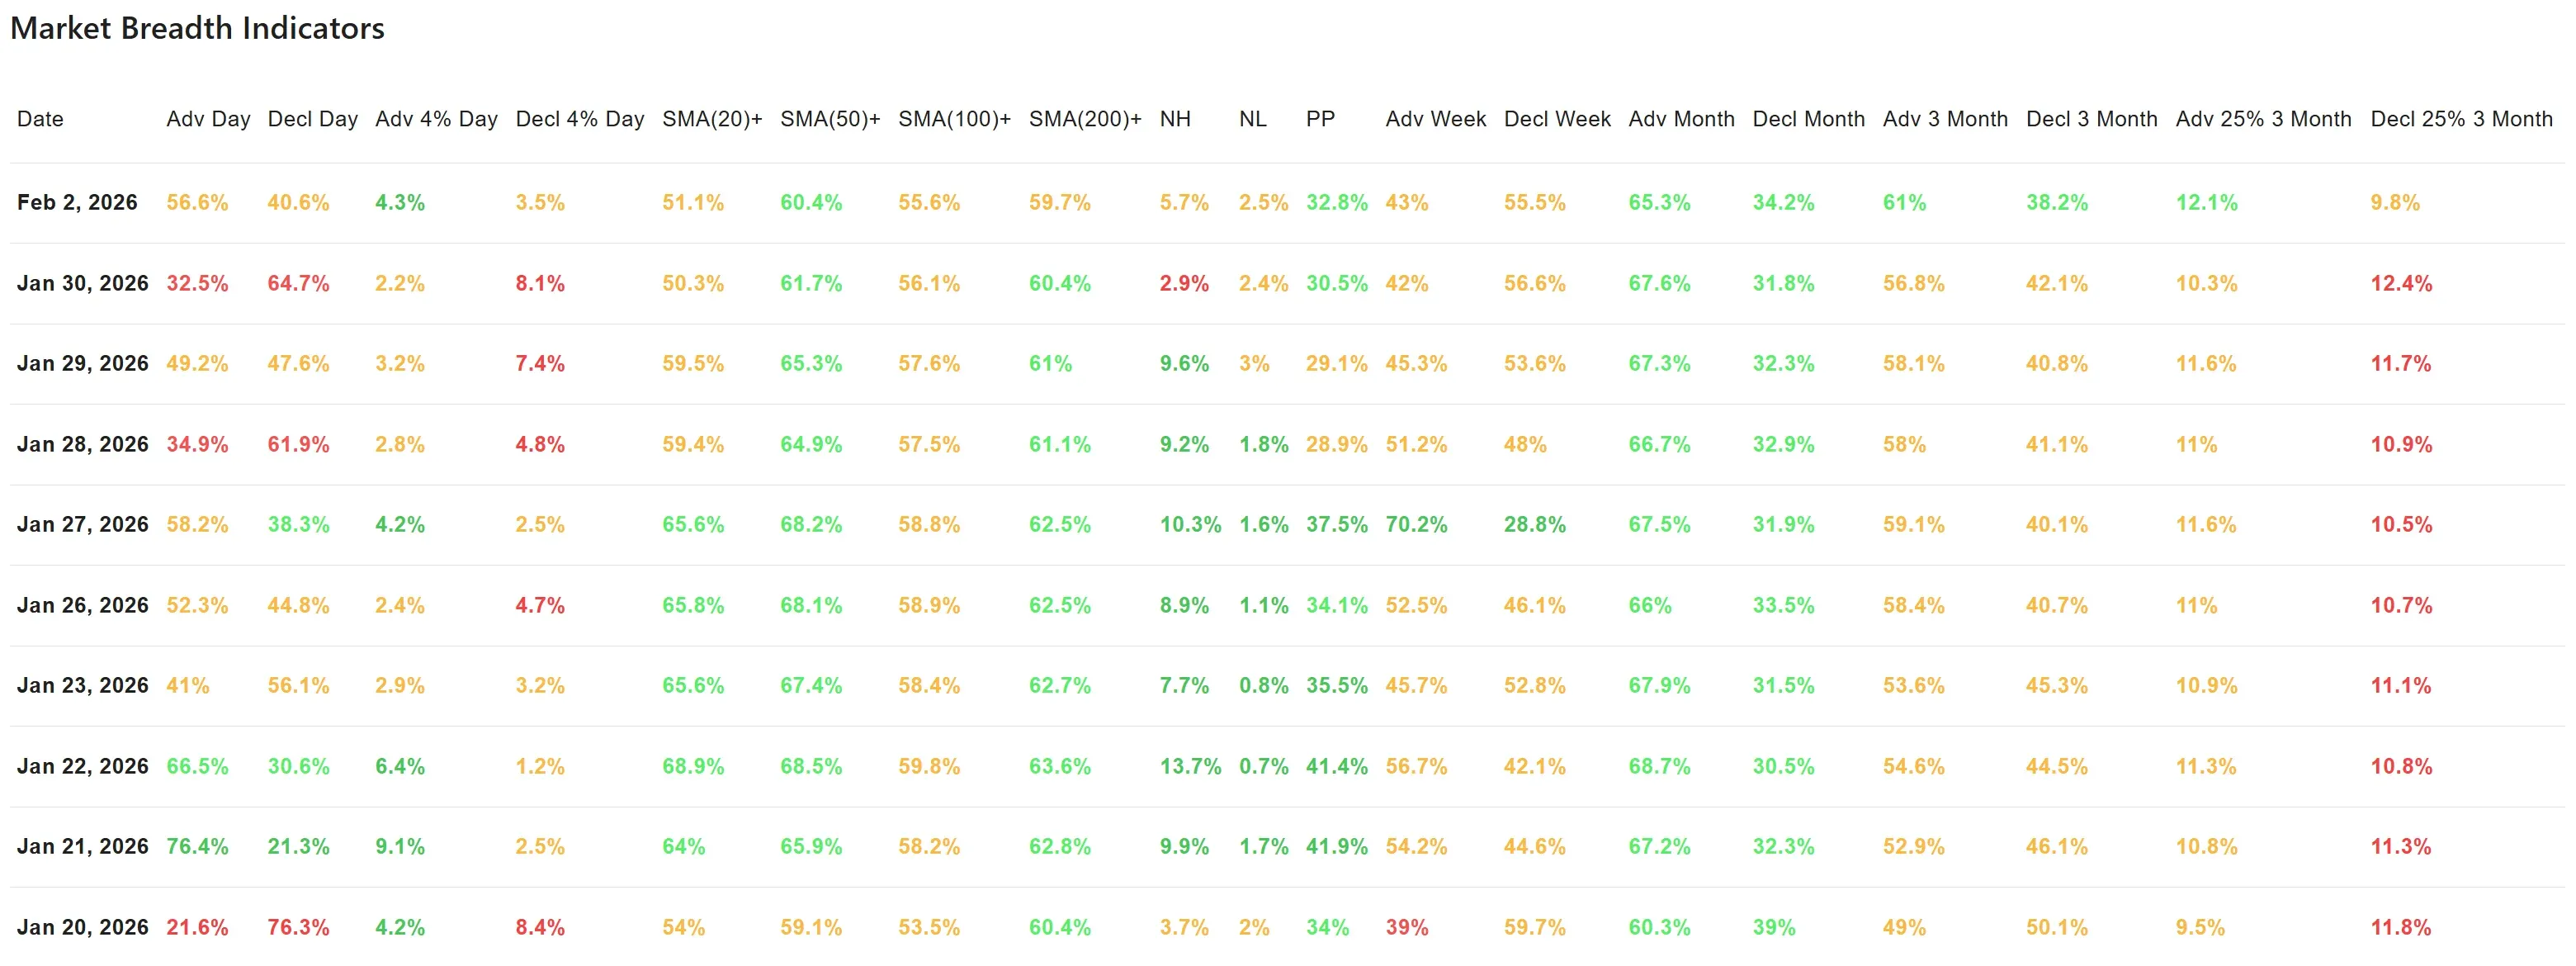
SMA(20)+: 51.1% (barely above the 50/50 line)
-
SMA(50)+: 60.4% (slightly lower than Friday’s 61.7%)
-
SMA(100)+: 55.6% (also marginally softer)
-
SMA(200)+: 59.7% (still solid, but not improving)
Interpretation: The rebound is happening while participation is not broadening materially. That often points to:
-
leadership still carrying indices, and/or
-
rotation under the surface (some groups up, others still repairing)
This aligns with the chart behavior: indices holding up well, but not showing a “fresh expansion leg” yet.
New Highs / New Lows
-
New Highs (NH): 5.7% (up from 2.9% Friday)
-
New Lows (NL): 2.5% (roughly unchanged)
Interpretation: More stocks are reclaiming new-high territory again, while new lows are not accelerating. That’s supportive. If this continues for a few sessions (NH staying elevated and NL staying contained), it usually strengthens the odds that the uptrend remains intact.
Multi-day breadth: still the main “yellow flag”
Here’s the key restraint:
- Adv Week: 43% vs Decl Week: 55.5%
So even after Monday’s improvement, the weekly balance remains negative. This fits the story we’ve been tracking recently: sharp day-to-day swings, but the market still working through a short-term digestion phase.
Longer horizons are better:
-
Adv Month: 65.3% (still strong, though off Friday’s 67.6%)
-
Adv 3 Month: 61% (improved vs Friday’s 56.8%)
Big winners vs big losers (3M):
-
Adv 25%: 12.1%
-
Decl 25%: 9.8% (better than Friday’s 12.4%)
Interpretation: Intermediate-term conditions remain constructive. The short-term breadth “engine,” however, is still not firing on all cylinders—yet.
Breadth trend rating (1–7)
Rating: 5 — Neutral, with a positive bias.

Why: The indices remain in uptrends and Monday’s breadth bounce meaningfully repaired Friday’s damage (fewer heavy decliners, healthier adv/dec, better NH). But the lack of expansion in moving-average participation and the still-negative weekly breadth keep this from moving into a clean “positive/very positive” regime.
Bottom line
This looks like a market that absorbed a weak breadth day and quickly re-stabilized, which is constructive. To upgrade the breadth view, we’d want to see the next step: weekly breadth turning back in favor of advancers and SMA(20)+ / SMA(50)+ pushing higher—confirming that the rally is widening beyond a smaller leadership group.
Kristoff
Next to read: Manufacturing Wakes Up, Stocks Party On