After Monday’s strong participation, Tuesday saw a clear cooling: advancers slipped back toward a 50/50 split and upside thrust (4% movers) faded.
Still, the backbone of breadth remains constructive, most stocks stay above key moving averages and multi-week/month participation continues to lean positive. Net: short-term momentum softened, but the broader uptrend structure is still holding.
Index overview (SPY, QQQ, IWM)
Short Term (Daily)
Long Term (Weekly)

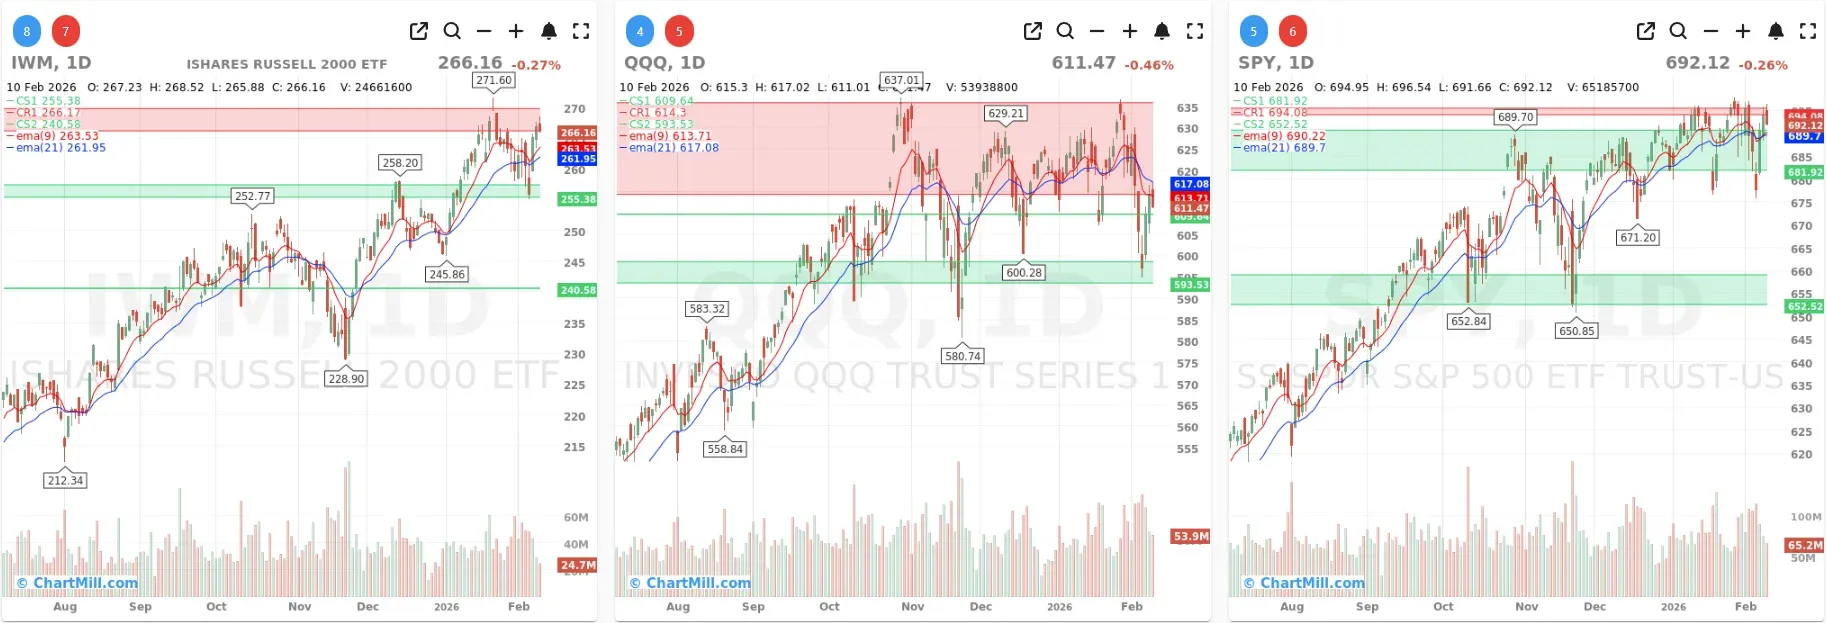
SPY
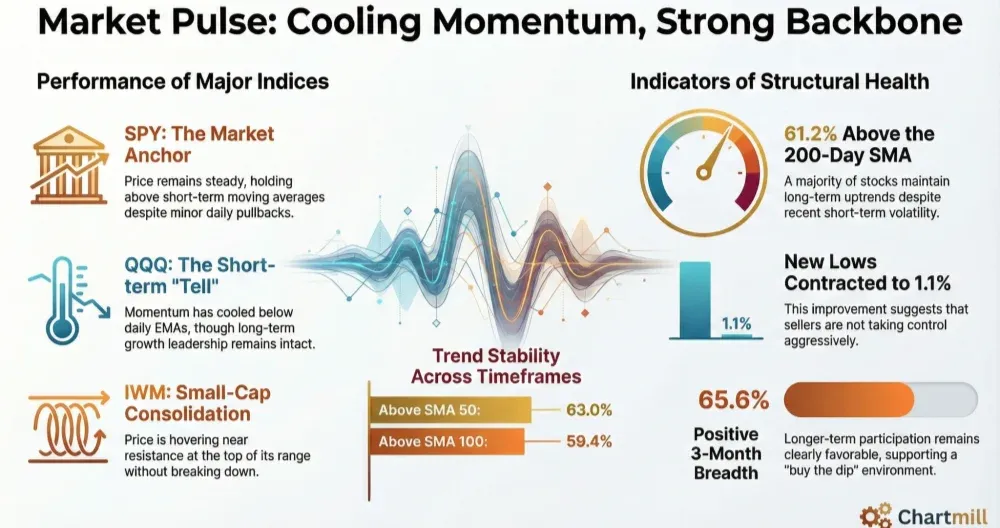
SPY gave back a modest -0.26% on the day, but technically this remains the steadiest of the three. Price is still holding above both EMA9 and EMA21, keeping the short-term trend intact despite the minor pullback. On the weekly chart, the ChartMill Trend Indicator remains green (positive) and price continues to consolidate near the upper zone, more of a digestion phase than a breakdown at this stage.
Takeaway: SPY is still acting as the market’s “anchor”: slight daily weakness, but trend structure remains constructive.
QQQ
QQQ was the weakest of the group, down -0.46%, and this matters because it aligns with what the breadth table is hinting at: participation is still okay, but short-term momentum is cooling. On the daily chart, QQQ is back below EMA9 and EMA21, which signals that near-term control shifted away from buyers again after Monday’s recovery attempt. Weekly trend is trying to get green again (final verdict after friday's close), but price is stuck in a broad consolidation zone below the prior highs, growth leadership is intact long-term, yet currently less decisive short-term.
Takeaway: QQQ is the “tell” right now: still in a long-term uptrend, but short-term breadth and price action both softened.
IWM
IWM slipped -0.27%, but it continues to hold above EMA9 and EMA21 on the daily chart, which is relatively constructive. Weekly trend remains green, and price is hovering near the top of its range, showing strength, but also some hesitation near resistance.
Takeaway: Small caps are not breaking down; they’re consolidating near highs, with short-term structure still okay.
Market breadth (10-day view)
Participation (Adv/Decl)
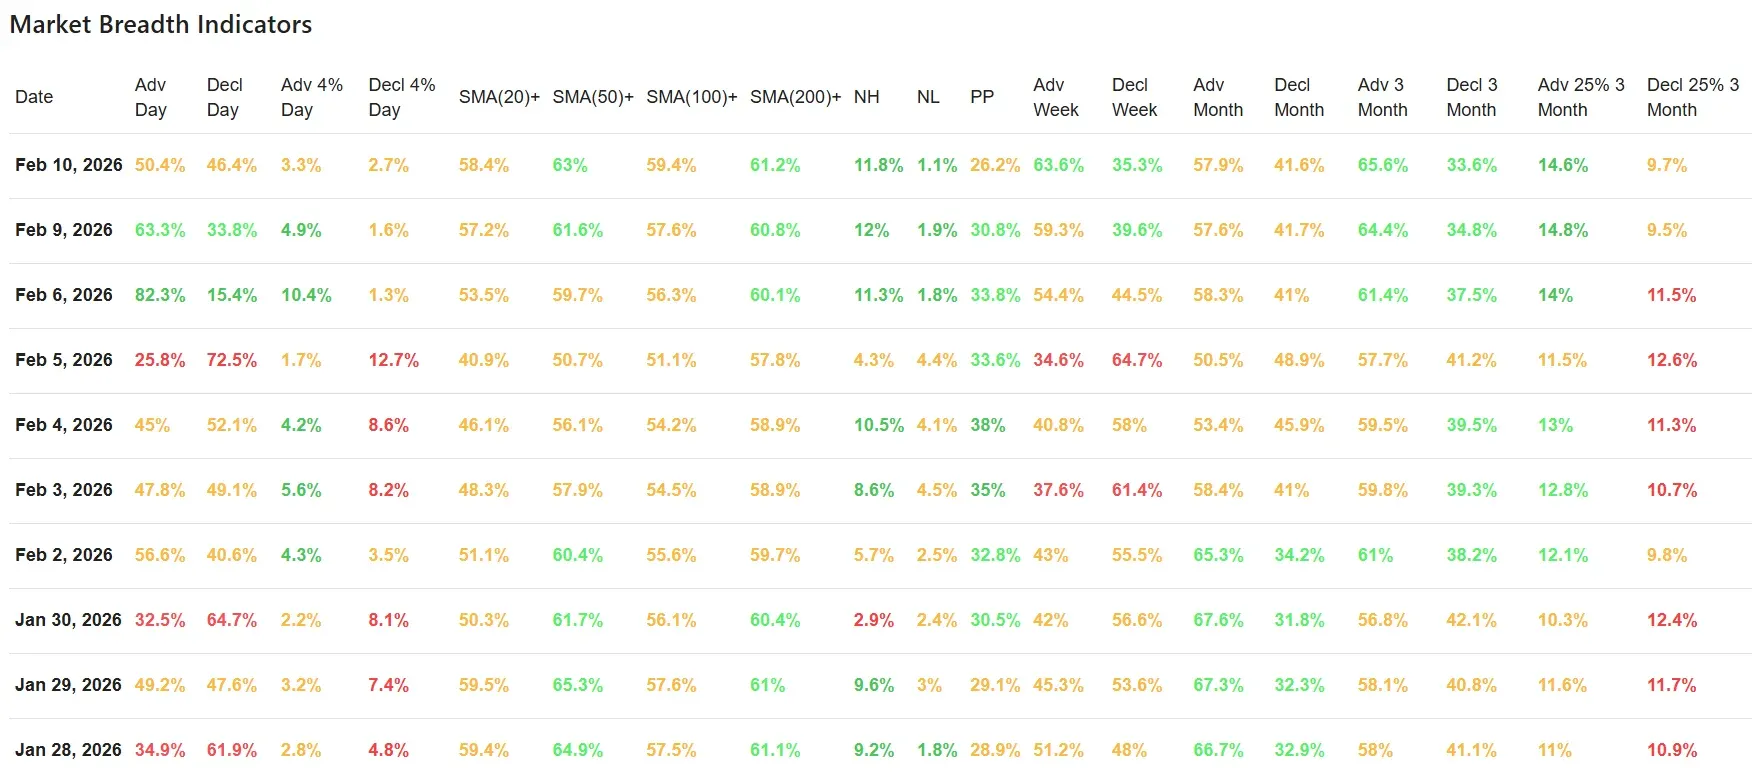
After Monday’s strong “risk-on” read, Tuesday reverted closer to neutral:
-
Advancing stocks: 50.4% (down from 63.3% Monday)
-
Declining stocks: 46.4% (up from 33.8%)
So the market didn’t flip into heavy distribution, but it did lose the broad push that supported Monday’s rebound.
Context vs. prior day: This is a classic follow-through failure in breadth terms: not a collapse, just less participation behind the tape.
Thrust (4% movers)
The “impulse” component cooled notably:
-
Adv +4%: 3.3% (from 4.9%)
-
Decl -4%: 2.7% (from 1.6%)
Upside momentum faded and downside volatility picked up, still not extreme, but it’s a clear step back from Monday’s improvement.
Trend Health (Stocks above moving averages)
This remains the most supportive area of the dataset:
-
Above SMA20: 58.4% (up from 57.2%)
-
Above SMA50: 63.0% (up from 61.6%)
-
Above SMA100: 59.4% (up from 57.6%)
-
Above SMA200: 61.2% (slightly up from 60.8%)
Even with a weaker day, the “market backbone” is still strong: a majority of stocks remain above all key trend measures, including the long-term SMA200.
Interpretation: Short-term sentiment can wobble, but the broader structure still supports dips being corrective rather than trend-breaking.
New Highs / New Lows
-
New Highs: 11.8% (slightly down from 12.0%)
-
New Lows: 1.1% (improved from 1.9%)
This is an important nuance: despite the weaker day, new lows actually contracted. That’s not what you typically see when sellers are taking over aggressively.
Multi-day / Multi-week Perspective
Even though Tuesday cooled, the “bigger picture” still leans constructive:
-
Weekly: Adv 63.6% vs Decl 35.3% (still favorable)
-
Monthly: Adv 57.9% vs Decl 41.6% (mildly favorable)
-
3-Month: Adv 65.6% vs Decl 33.6% (clearly favorable)
So, compared with the prior day’s “breadth rebound,” today looks more like consolidation after improvement than a full reversal back into defense.
Conclusion
Tuesday’s data is best described as a cooling day, not a breakdown day. Breadth participation slipped back toward neutral and downside volatility increased a bit, matching the softer close in SPY/QQQ/IWM and especially the short-term weakness in QQQ.
But the underlying trend health remains supportive: most stocks are still above their key moving averages, new lows stayed contained, and the weekly/monthly/3-month participation metrics continue to lean positive. In other words: the market is pausing, not unraveling.
Breadth Trend Rating (1–7)

Short-term thrust cooled, but the broader participation and trend structure remain constructive enough to keep the bias slightly positive.
Kristoff - ChartMill
Next to read: AI Anxiety Rattles Wall Street's Old Guard