

(All data & visualisations by ChartMill.com)
Daily Market Trend Analysis – September 04, 2025 (After Market Close)
Strong upward Moves, SPY and QQQ close to All Time Highs.
Short Term Trend
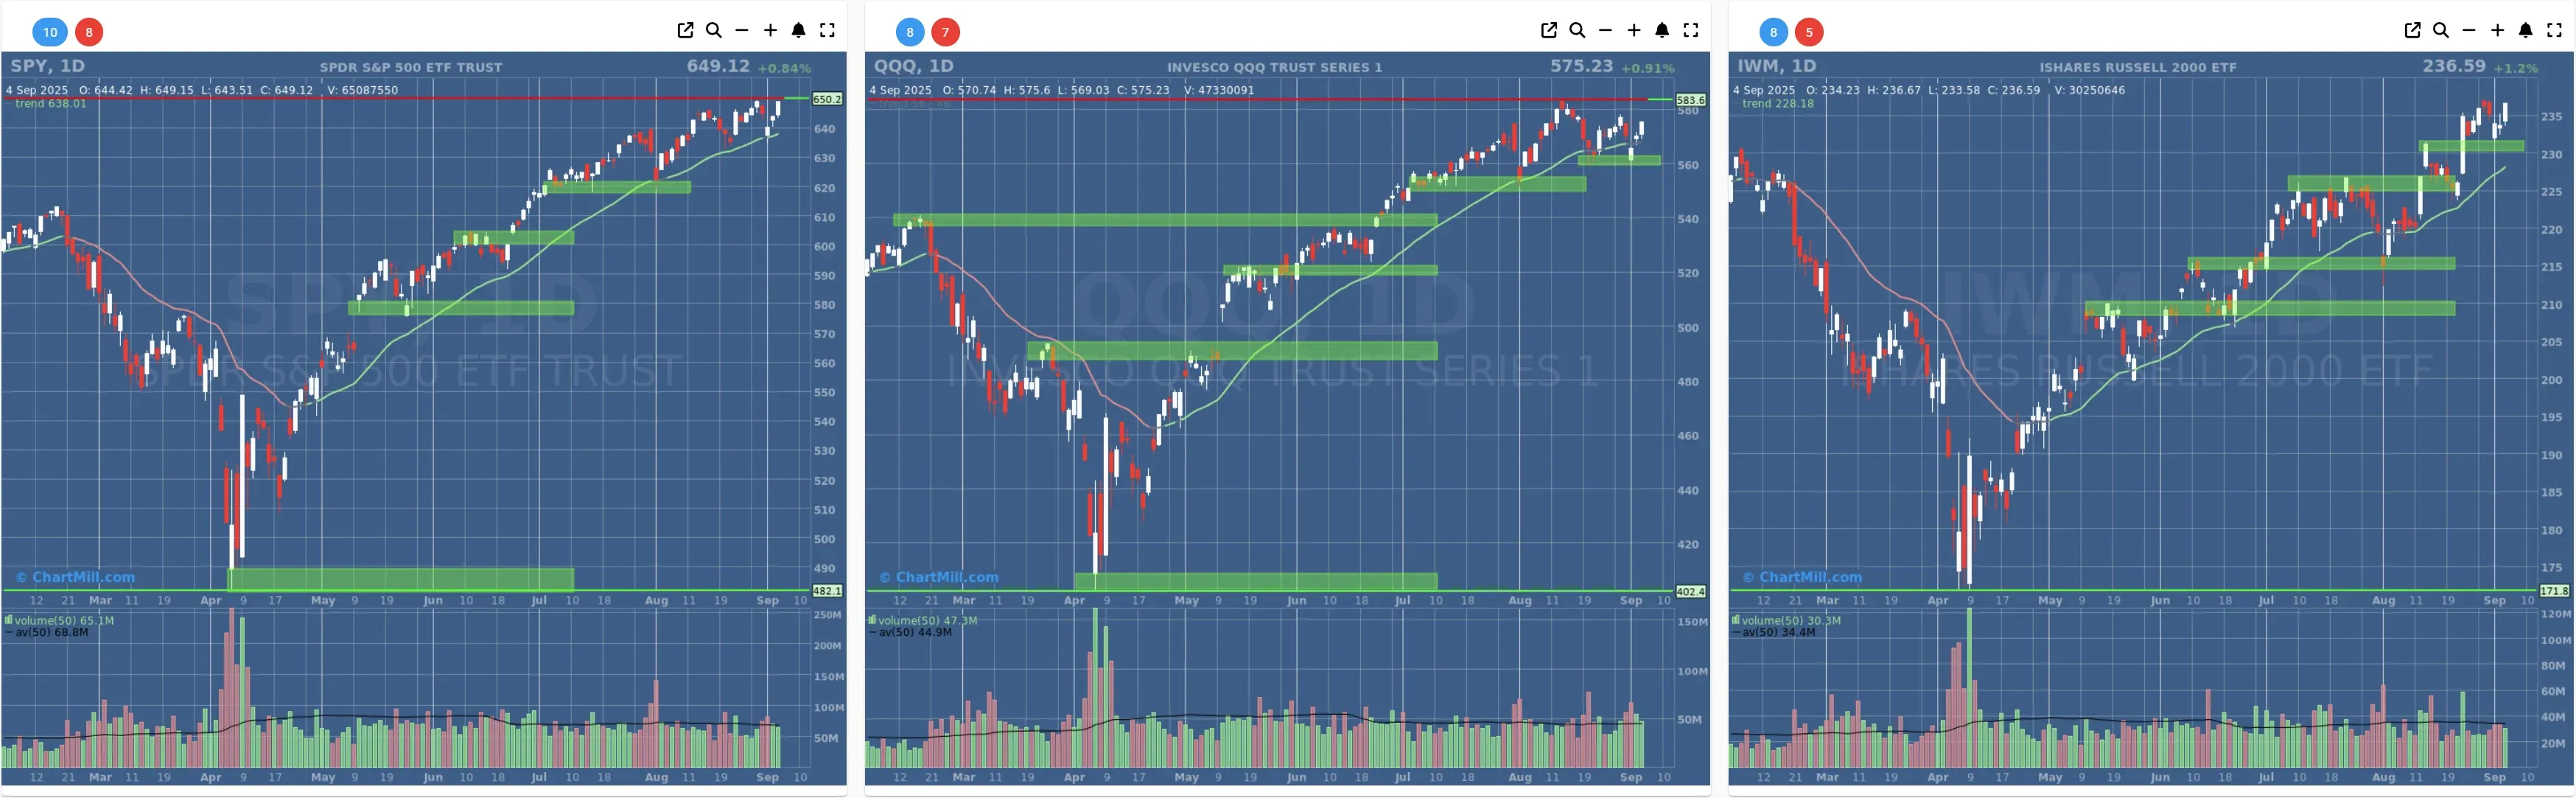
- Short-Term Trend: CHANGE - Positive (from Neutral)
- Next Support at $640 - $630
- Next Resistance at $650
- Volume: At Average (50)
- Pattern: Up Day - At Resistance - Closed at HOD
- Short-Term Trend: Neutral (no change)
- Next Support at $560
- Next Resistance at $583
- Volume: Slightly Above Average (50)
- Pattern: Up Day - Closed at HOD
- Short-Term Trend: Positive (no change)
- Next Support at $225 - $230
- Next Resistance at $237
- Volume: At Average (50)
- Pattern: Up Day - At Resistance - Closed at HOD
Long Term Trend
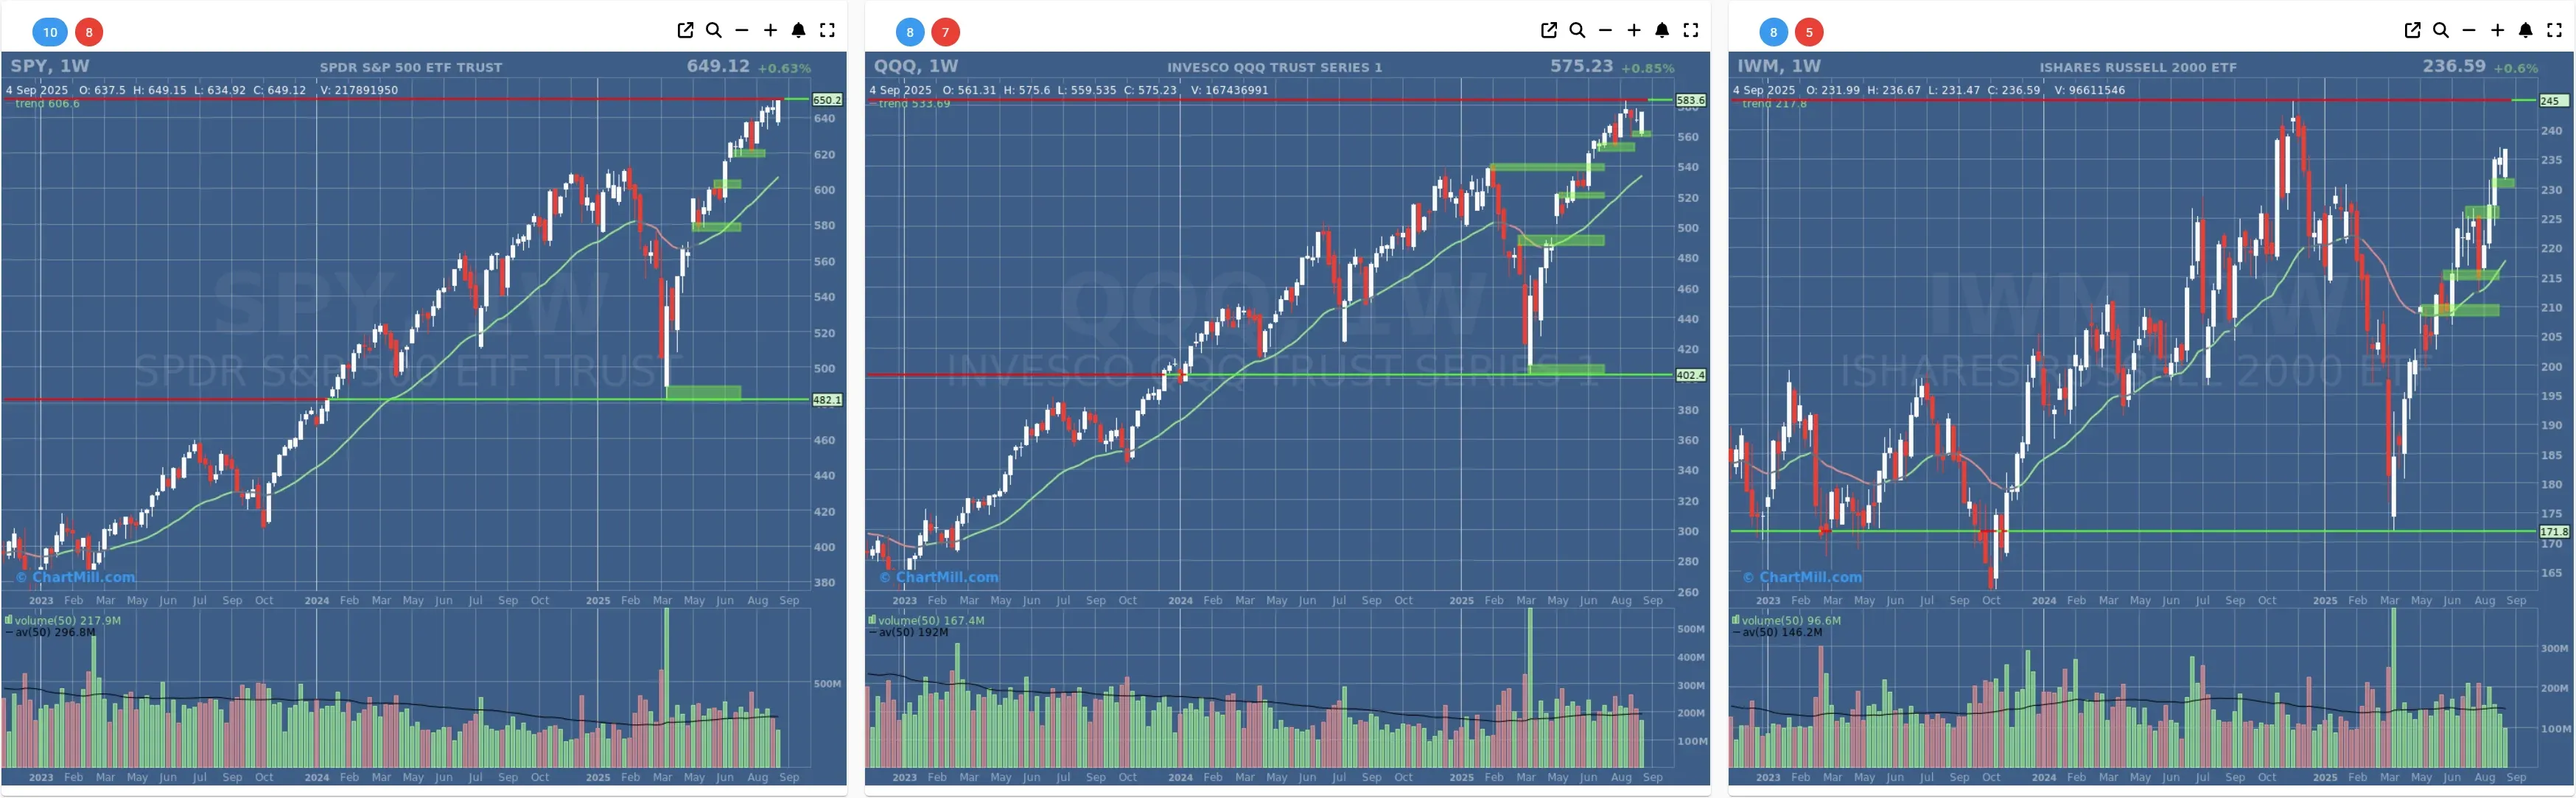
- Long-Term Trend: Positive (no change)
- Long-Term Trend: Positive (no change)
- Long-Term Trend: Positive (from neutral)
Daily Market Breadth Analysis – September 04, 2025 (After Market Close)
Stronger advancing participation lifts breadth indicators into positive territory, reversing Tuesday’s deep setback
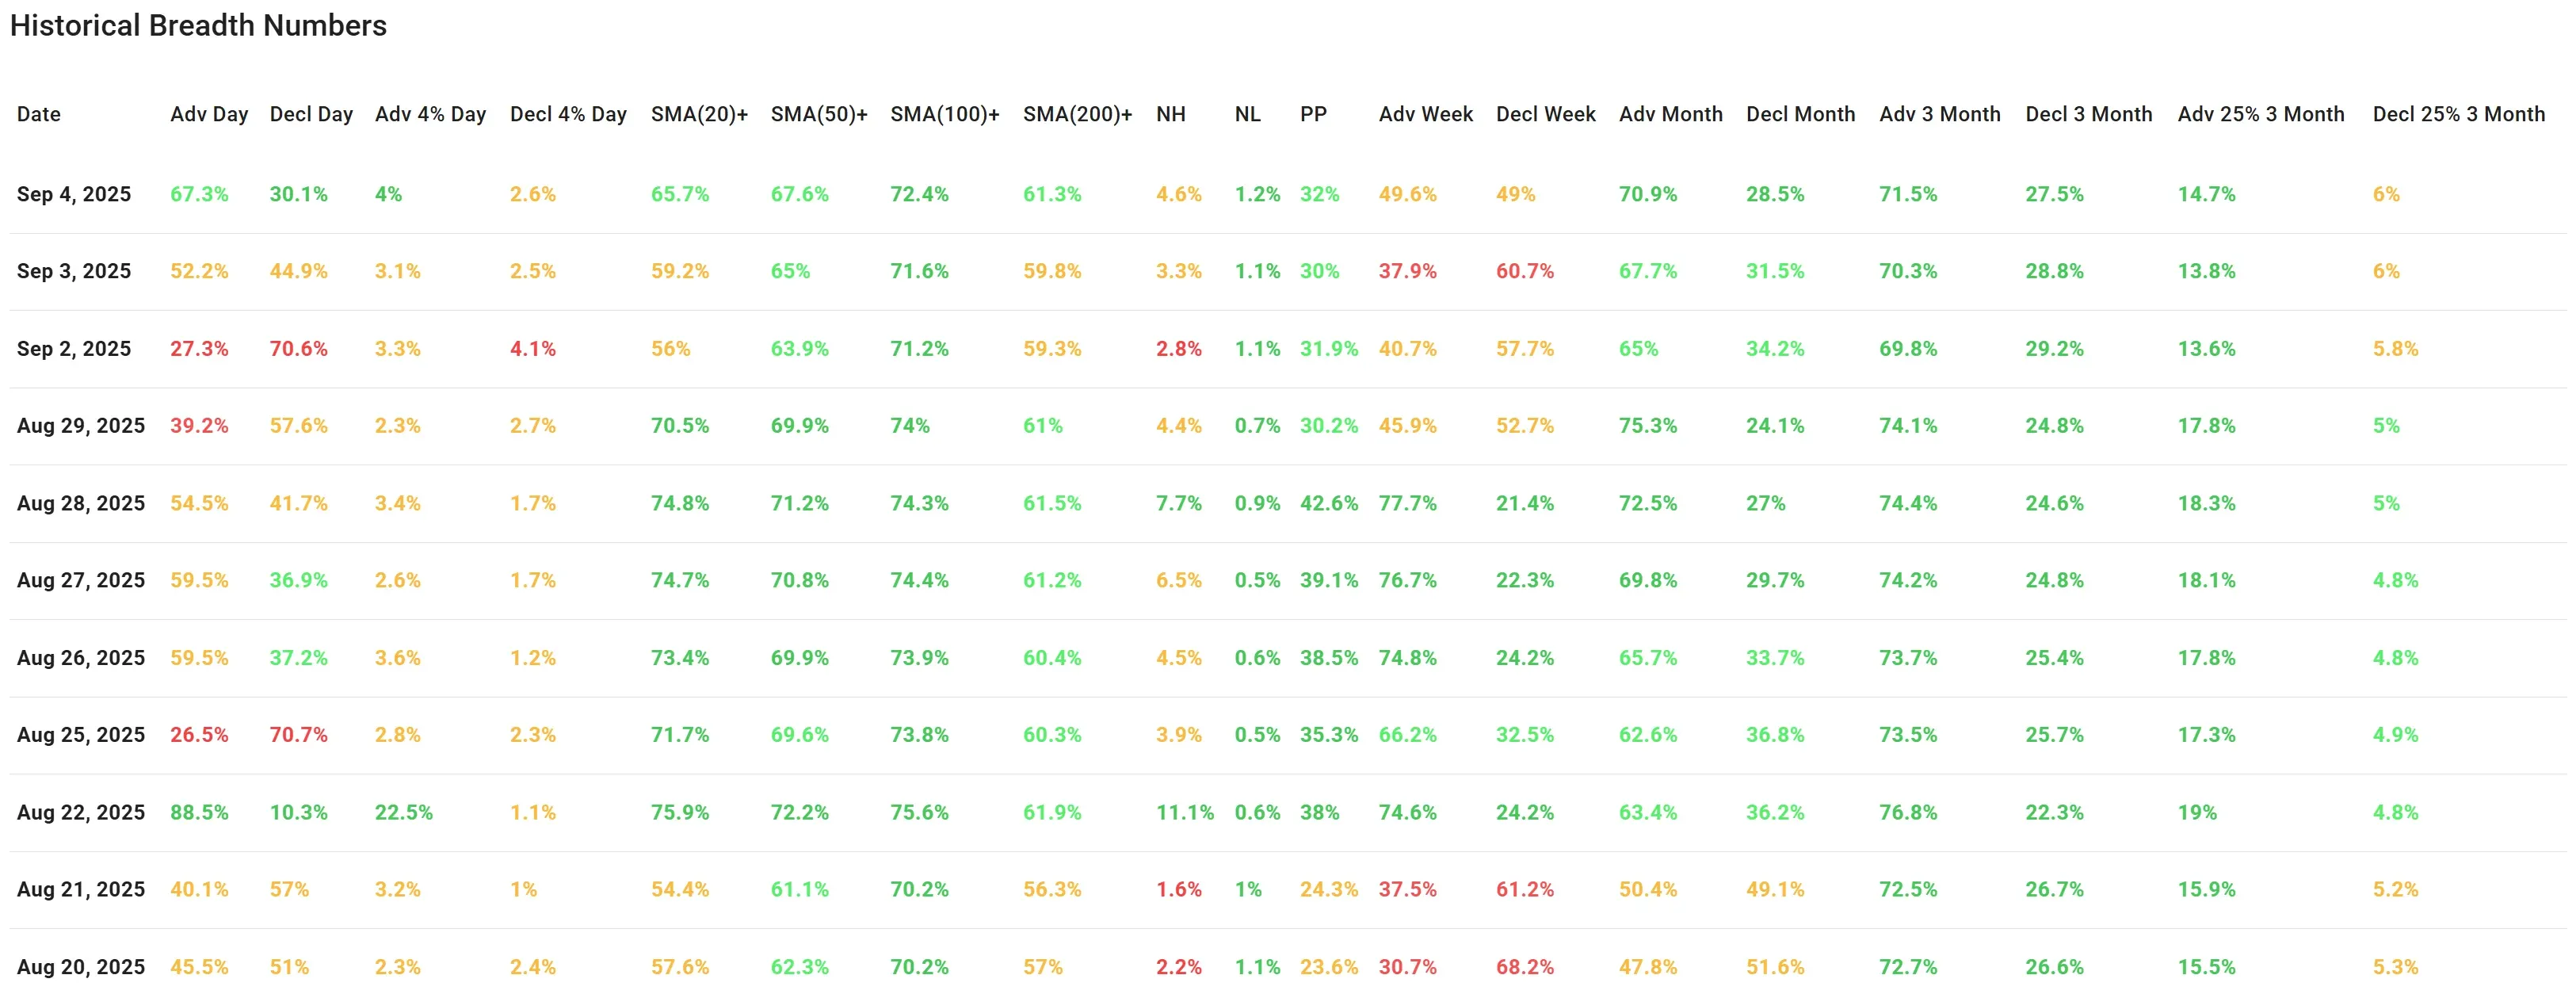
After a turbulent start to the week, market breadth rebounded strongly on September 4. Advancing stocks made up 67.3% of all issues, more than double Tuesday’s weak 27.3% reading and also a clear improvement from Wednesday’s more balanced 52.2% vs. 44.9% split.
Decliners fell back to 30.1%, while only 2.6% of stocks registered significant losses greater than 4%.
Short-term momentum confirmed the shift. The percentage of stocks above their 20-day SMA rose from 59.2% to 65.7%, while those above the 50-day SMA ticked up to 67.6%.
Mid- to longer-term metrics also held steady: over 72% of stocks remain above their 100-day SMA, and more than 61% above the 200-day. These levels indicate that the broader market trend has not been structurally damaged despite recent volatility.
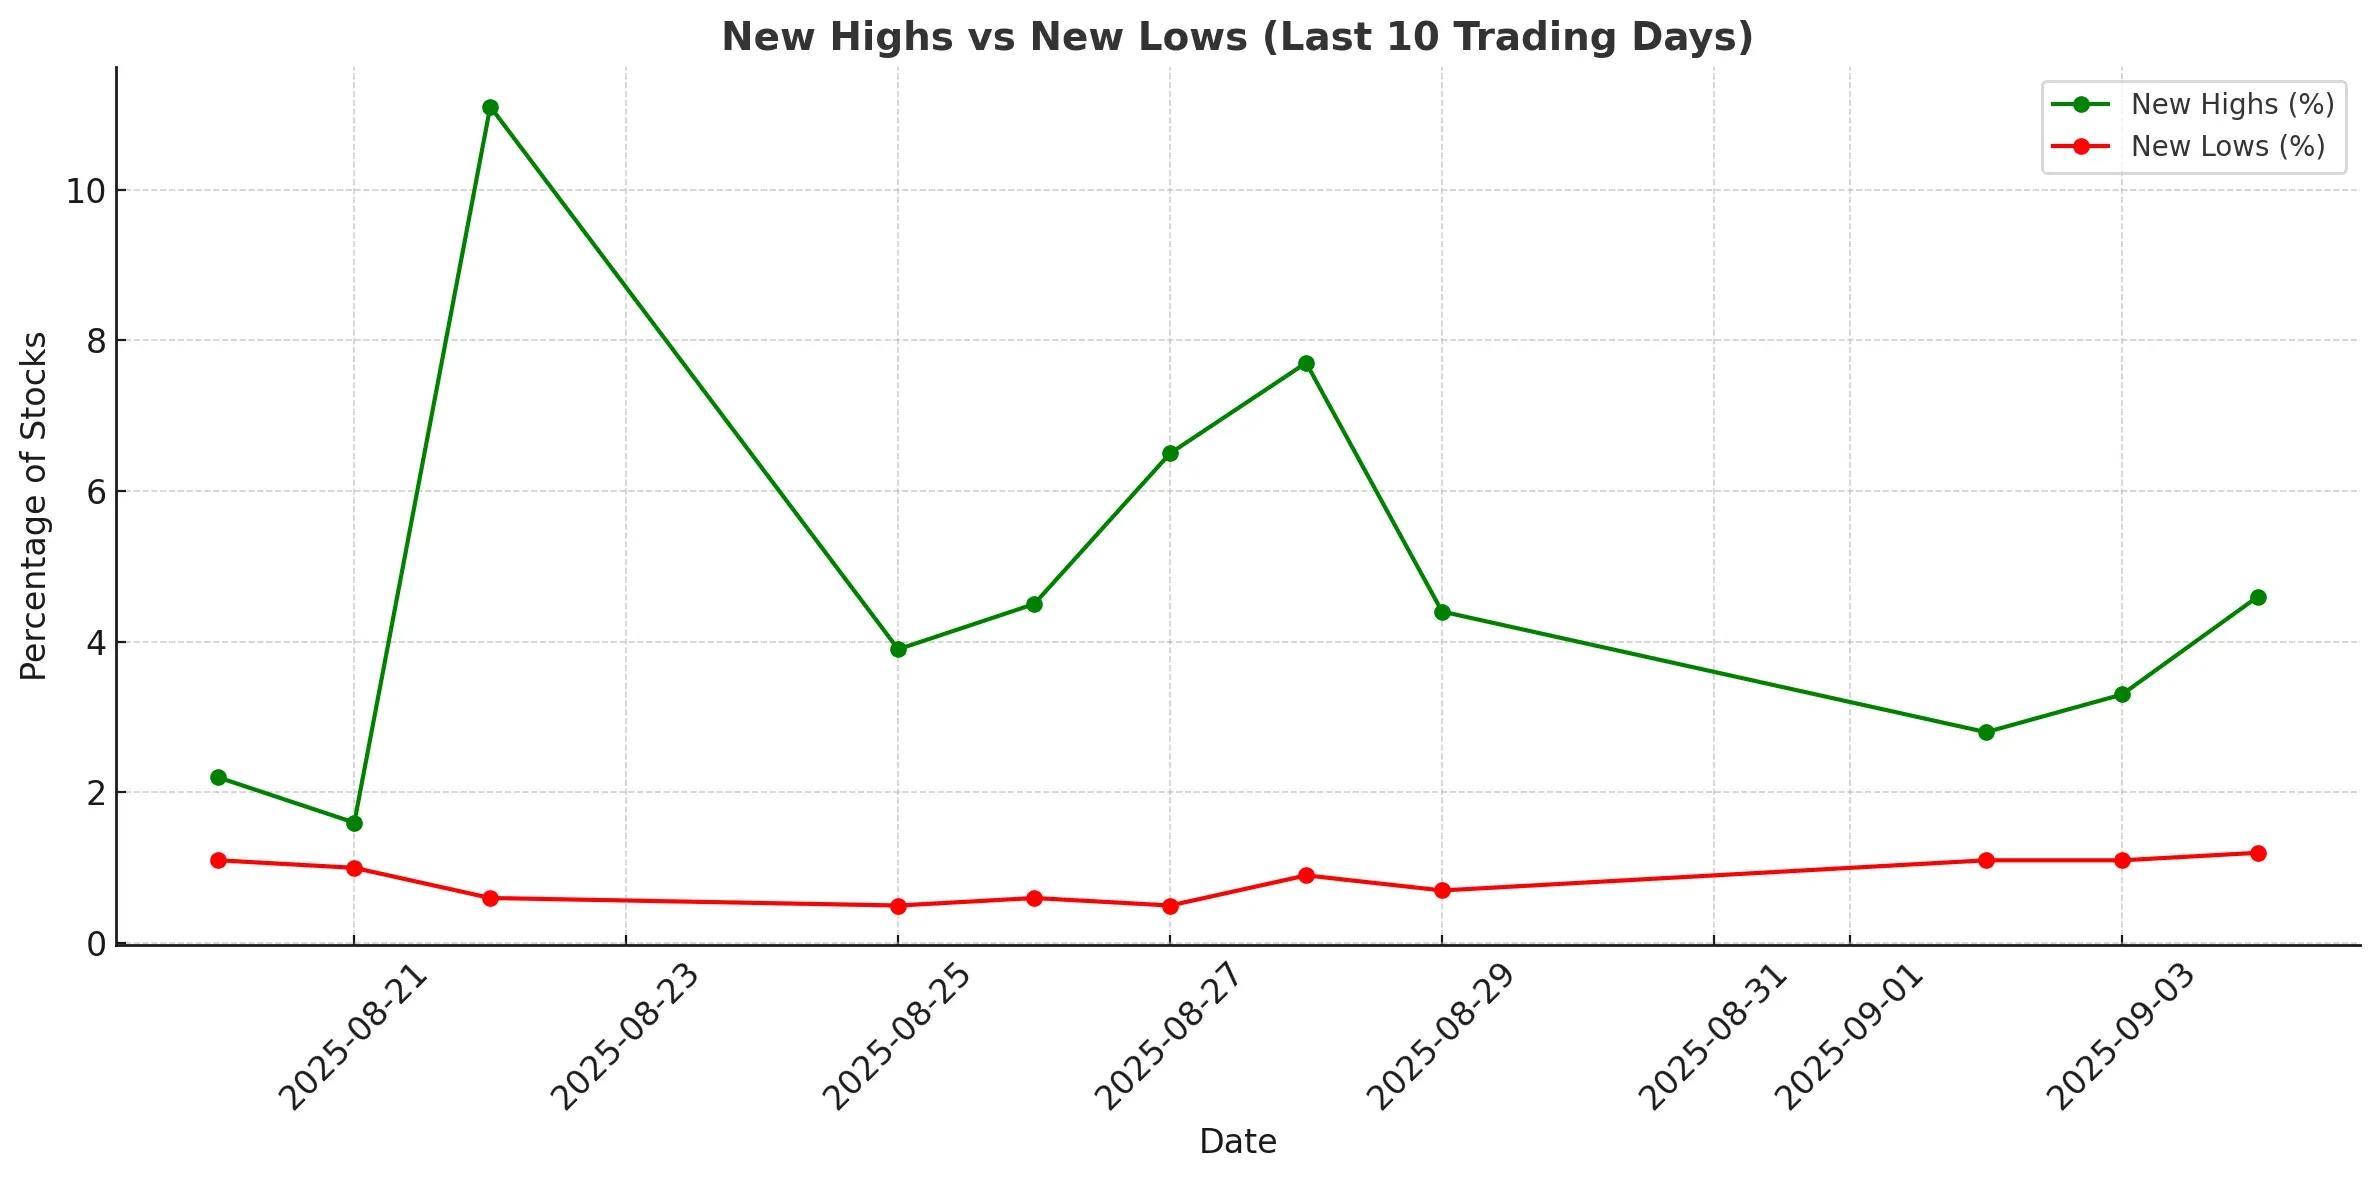
New highs versus new lows improved modestly, with 4.6% of stocks posting fresh highs compared to just 1.2% at new lows. The proportion of Pocket Pivots (PP) over the past 10 days climbed back to 32%, recovering from Wednesday’s dip to 30%.
On a weekly basis, advances and declines are now almost evenly matched (49.6% vs. 49%), a sharp improvement from Tuesday’s heavily skewed 40.7% advances against 57.7% declines. Monthly and three-month breadth figures remain comfortably in positive territory, with advancing stocks dominating across most horizons.
Comparison to previous days:
-
Tuesday, September 2, was one of the weakest breadth days in weeks, with breadth collapsing across nearly all categories.
-
Wednesday offered signs of stabilization but remained fragile.
-
Thursday’s data confirmed a convincing recovery, suggesting that Tuesday’s washout may have been more of a shakeout than the start of a broader breakdown.
Overall rating of current breadth trend: 4 (positive).
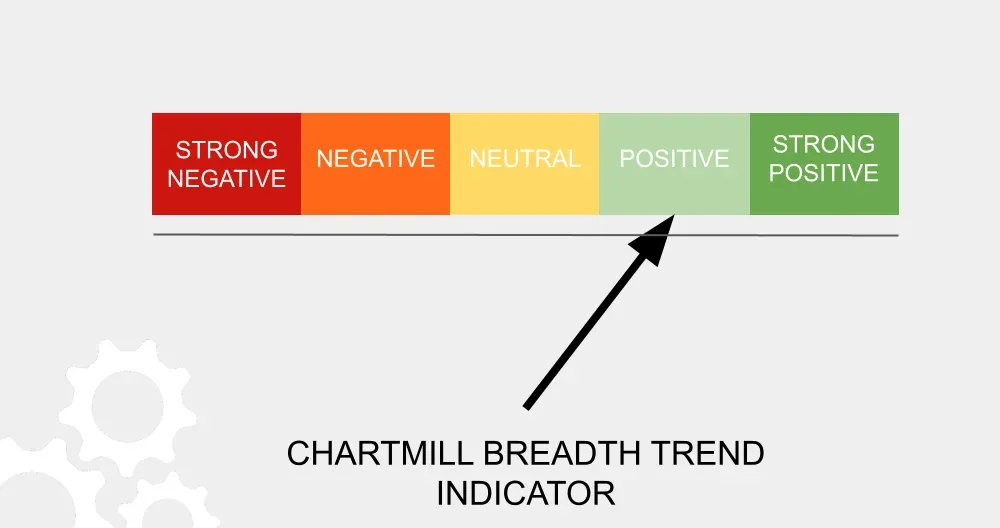
Breadth has reasserted strength, with short-term measures back above key thresholds and longer-term participation intact. While the market is not yet at “very positive” extremes, the data clearly reflects a healthy recovery from the earlier setback.
Kristoff - ChartMill
Next to read: Market Monitor News, September 05 BMO