

(All data & visualisations by ChartMill.com)
Daily Market Trend Analysis – June 16, 2025 (After Market Close)
Non-confirmed Long Term Trend Change Alert for the Russel 2000 (IWM). Friday we know for sure (close of the current weekcandle).
Short Term Trend
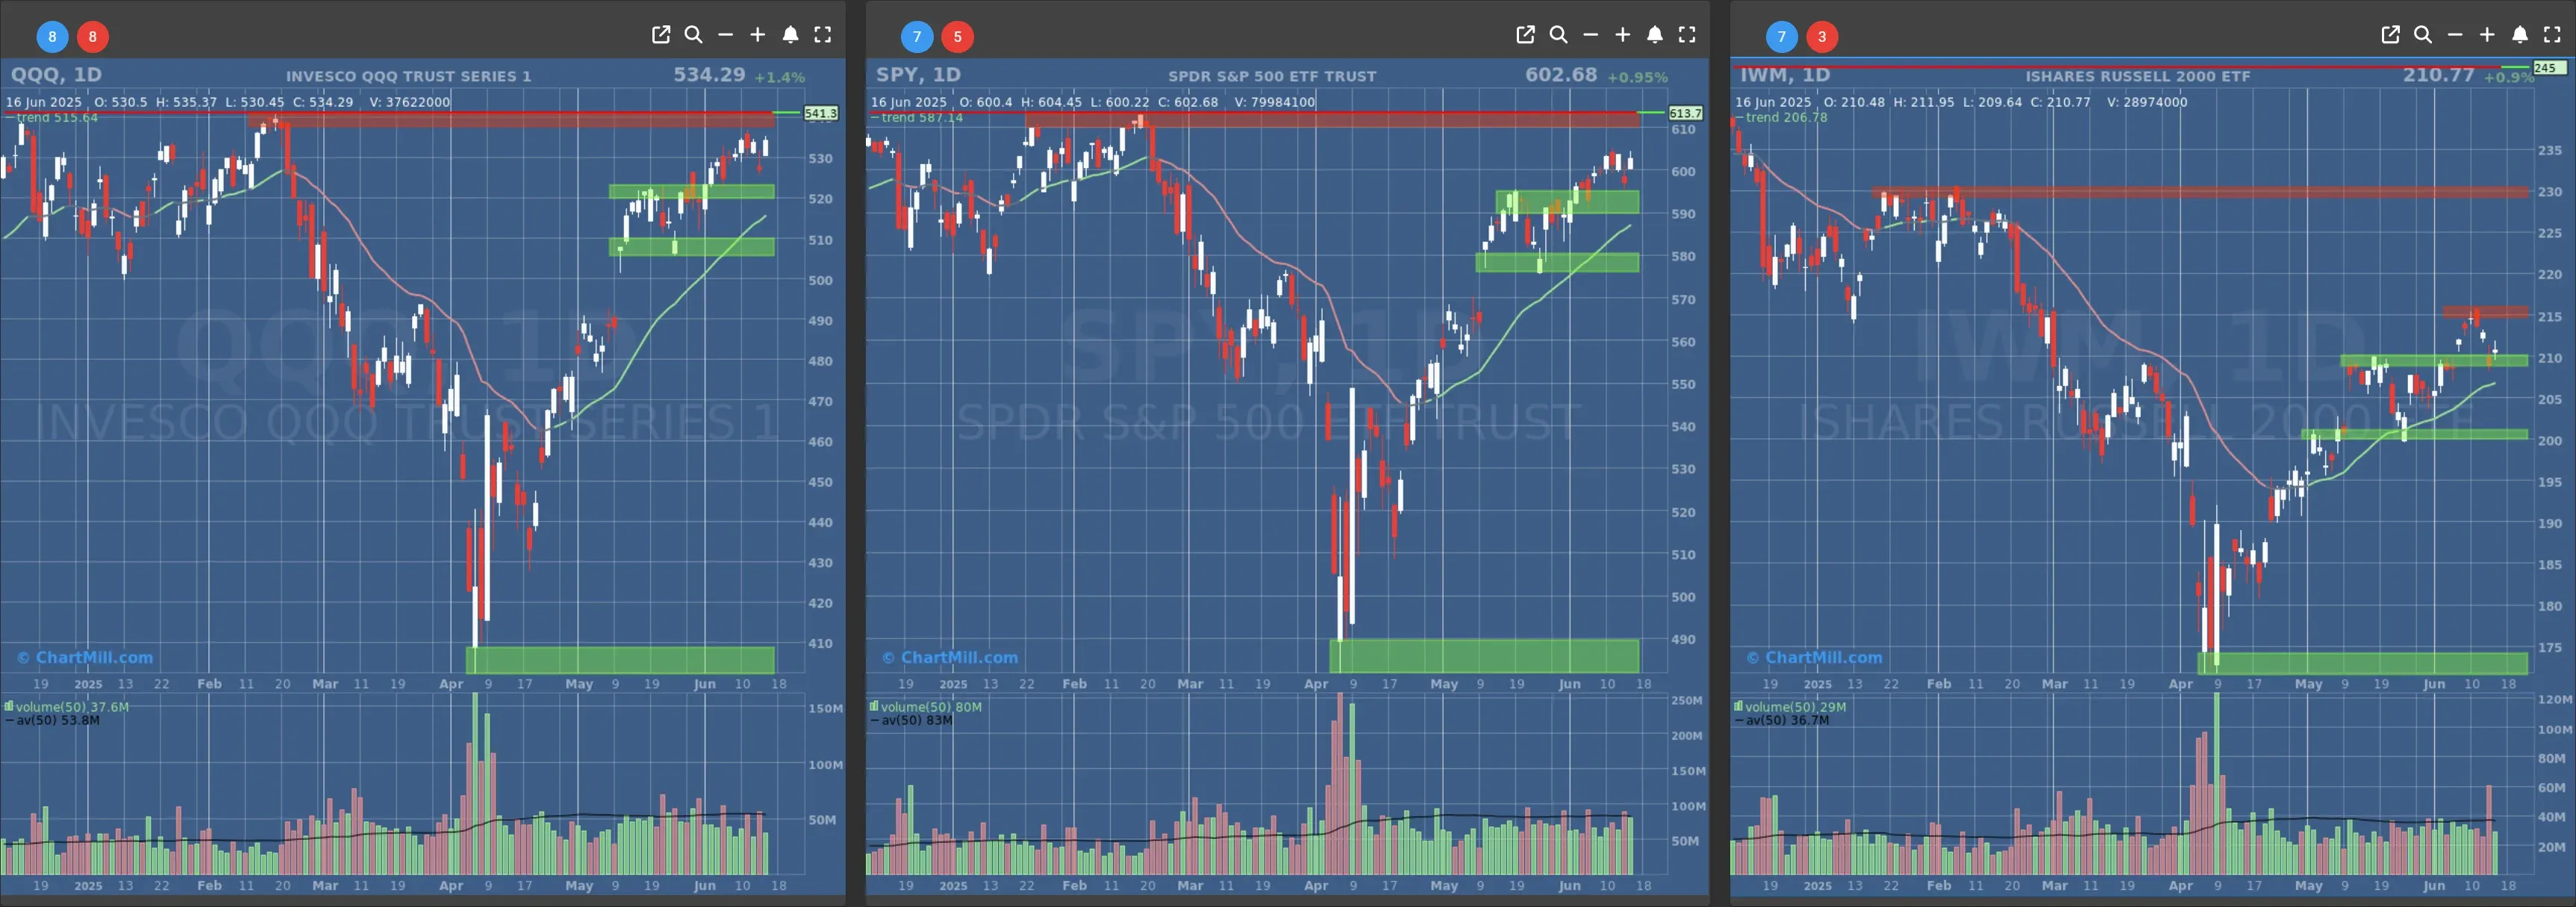
- Short-Term Trend: Bullish (no change)
- Next Support at $580
- Next Resistance at $610
- Volume: At Average (50)
- Pattern: Gap Up, Up Day
- Short-Term Trend: Bullish (no change)
- Next Support at $520
- Next Resistance at $540
- Volume: Below Average (50)
- Pattern: Gap Up, Up Day
- Short-Term Trend: Bullish (no change)
- Next Support at $210 & $205
- Next Resistance at $215 & $230
- Volume: Far Above Average (50)
- Pattern: Gap Up, Doji Candle
Long Term Trend
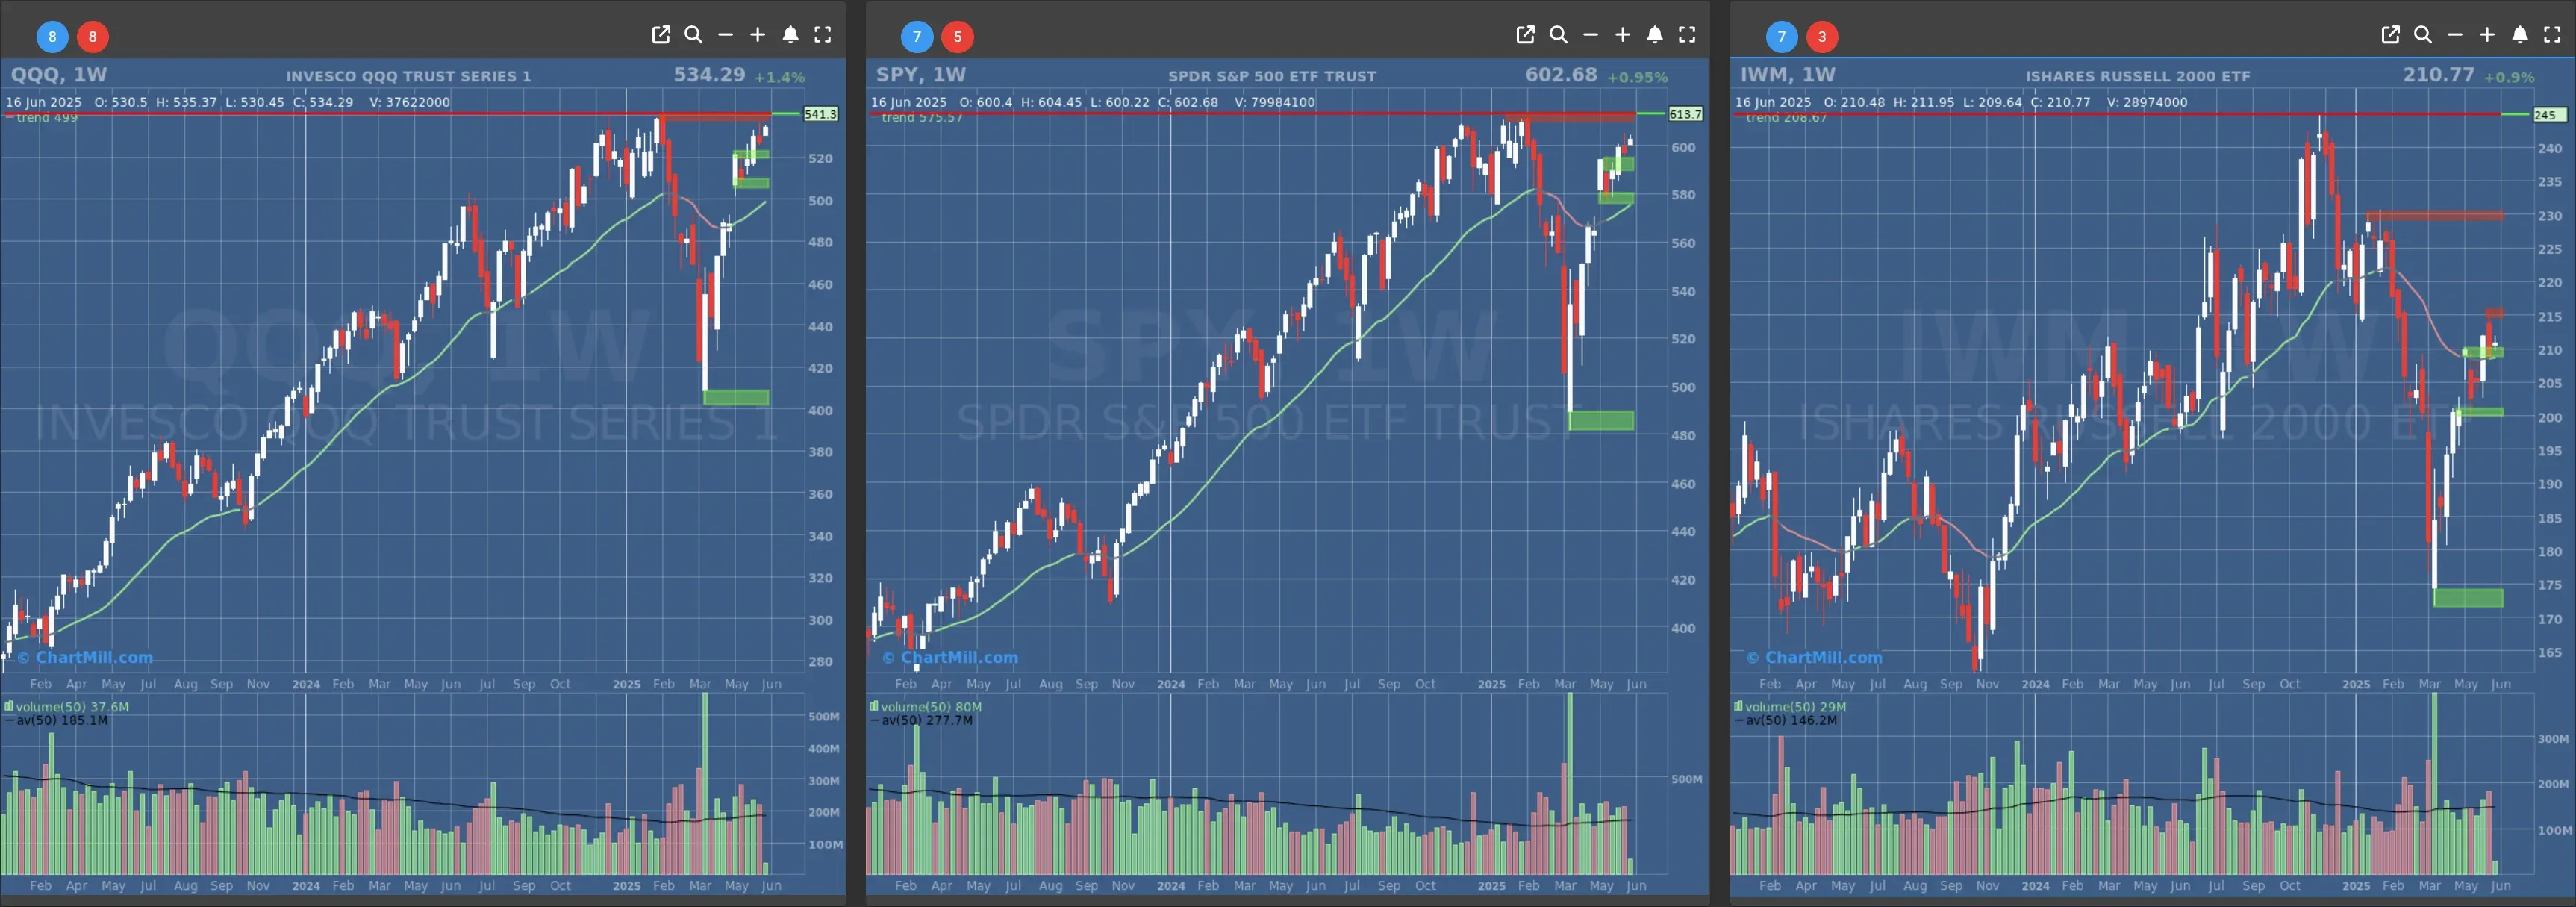
- Long-Term Trend: Positive (no change)
- Long-Term Trend: Positive (no change)
- Long-Term Trend: Positive (changed from neutral) - not confirmed, weekcandle closes on friday
Daily Market Breadth Analysis – June 16, 2025 (After Market Close)
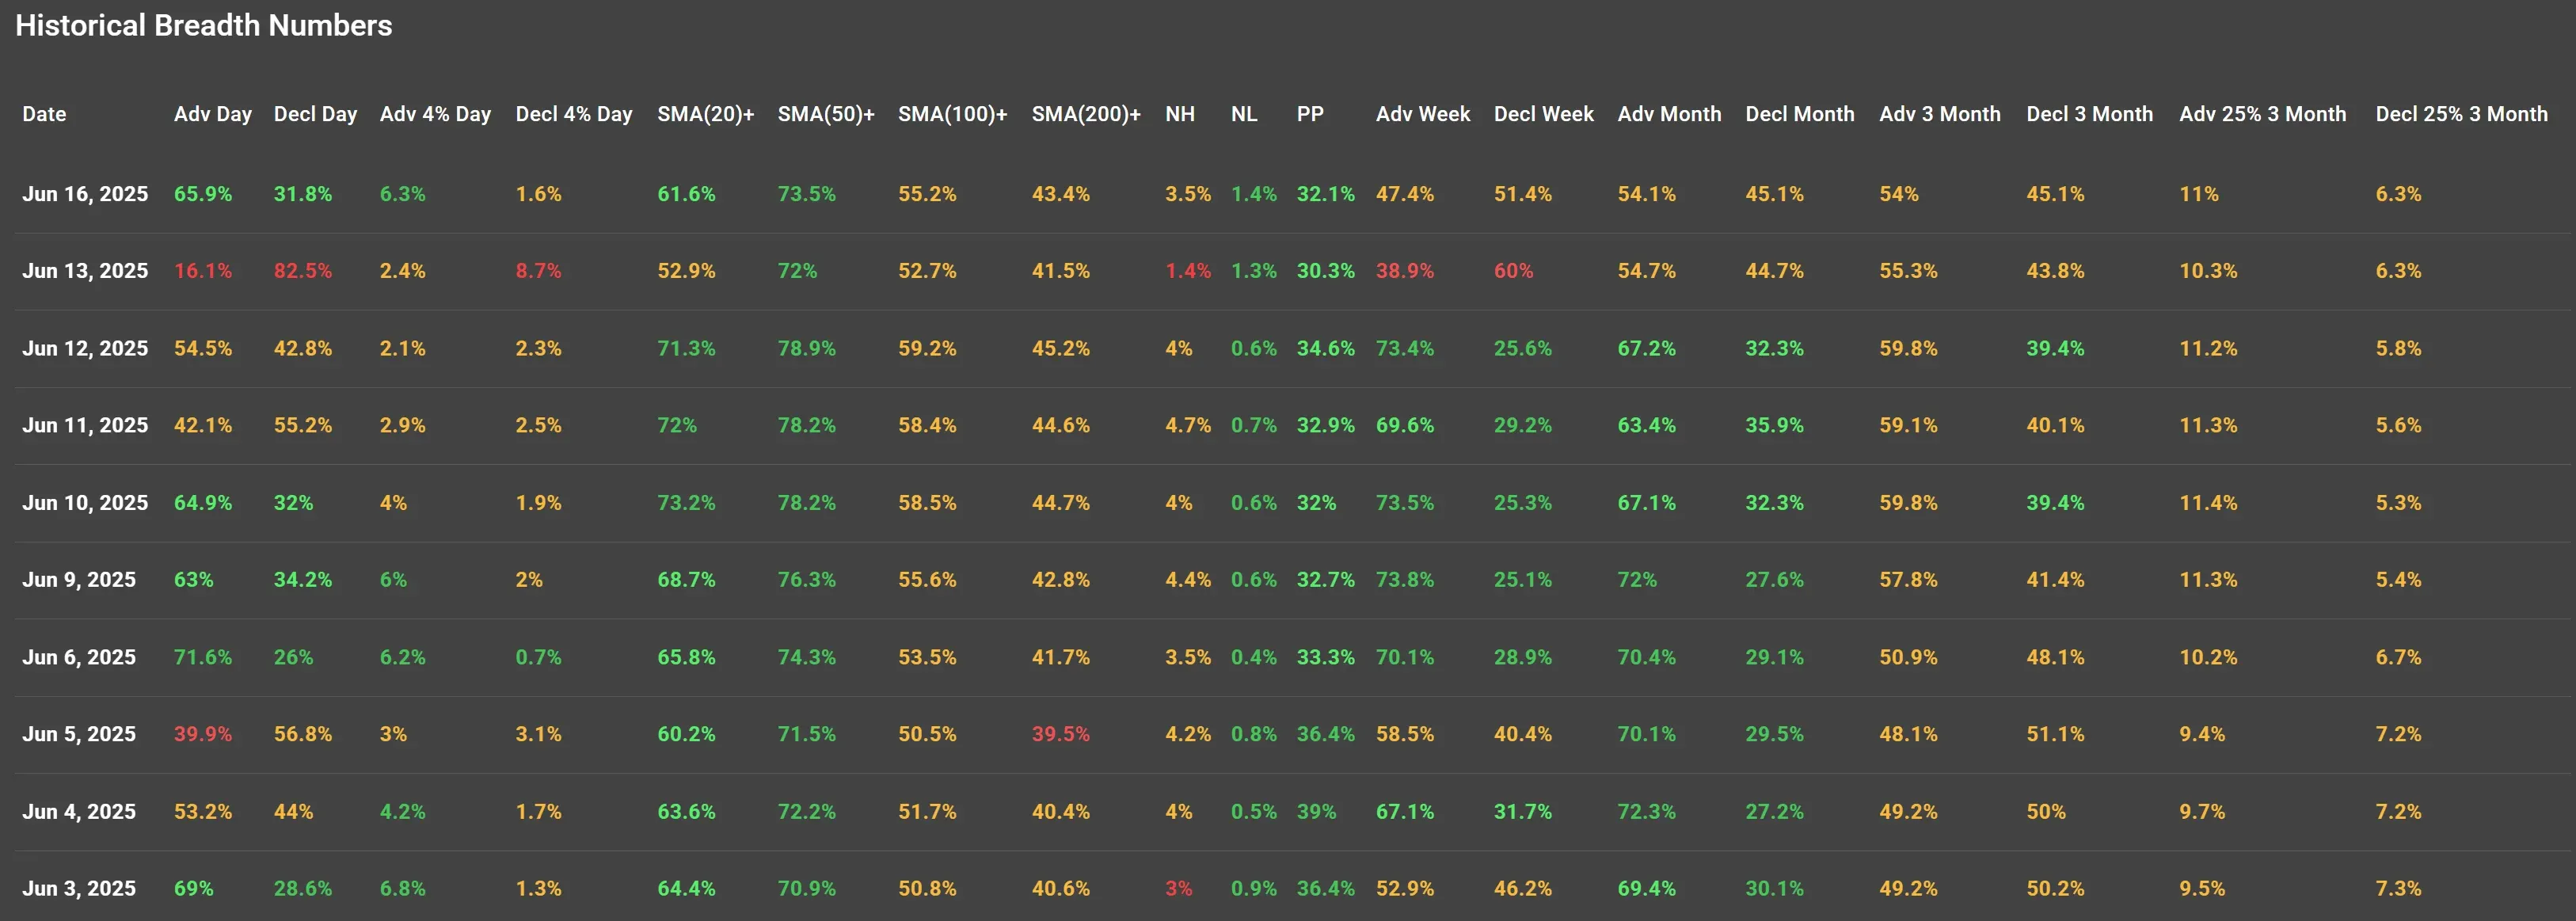
After Friday’s washout (June 13), where decliners trounced advancers (82.5% vs. a meager 16.1%), Monday’s session (June 16) brought a solid snapback. 65.9% of stocks advanced, while just 31.8% declined, a dramatic shift and a clear sign that buyers stepped back in with conviction. Compared to Friday’s carnage, this was a full-blown rebound.
The market doesn’t lie, but it doesn’t shout either. You’ve got to listen carefully.
Even more telling: the percentage of stocks above their 20-day and 50-day SMAs rebounded to 61.6% and 73.5%, respectively. Those are healthy breadth readings, suggesting that Friday’s sell-off didn’t do lasting technical damage.
The longer-term breadth (SMA 200+) held steady around 43.4%, which is still a bit underwhelming but not unusual during short-term pullbacks in bull runs.
The weekly trend also perked up. Advancing stocks over the past week edged up to 47.4%, nearly matching decliners at 51.4%.
We’re not back to “breadth thrust” territory yet, but it’s a constructive shift from Friday’s deteriorating internals.
Continuation or Fluke?
Looking at the progression since June 3 (see charts), breadth has generally remained supportive, especially above the 50-day SMA line, which hovered around or above 70% for most of the period. Friday was the outlier, not the trend. Monday’s bounce reasserted that.
Last week I noted that despite a growing number of stocks falling below key moving averages, the broader trend hadn’t cracked. That’s now been validated, at least for the short term.
Key Visual Takeaways
Chart 1 shows the sharp reversal from Friday’s negative breadth into Monday’s rally, with advancing stocks regaining leadership.
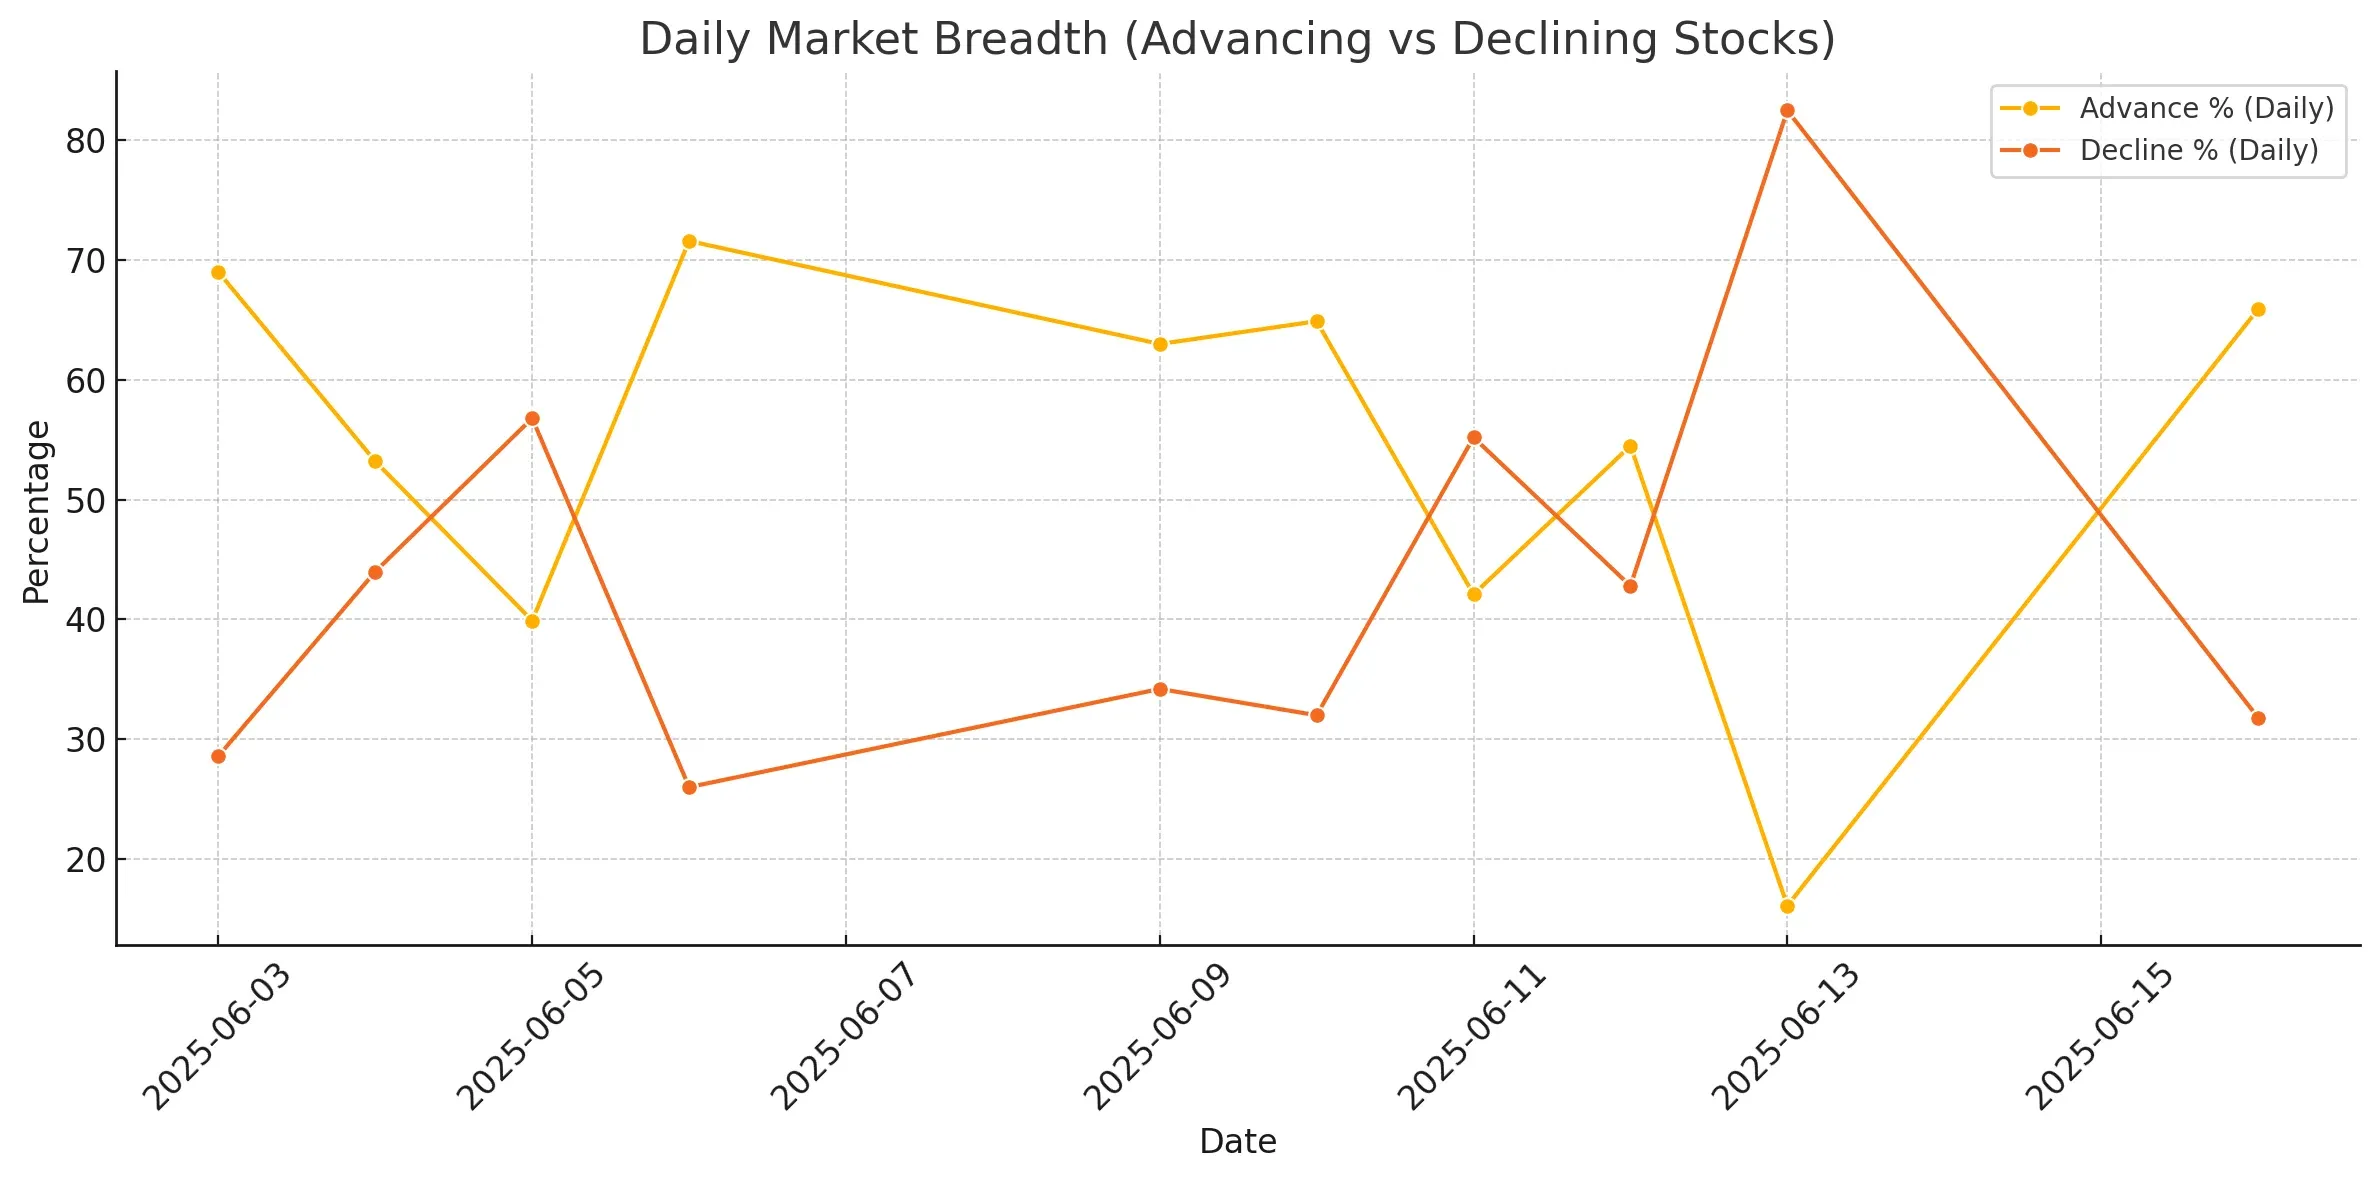
Chart 2 demonstrates stability in the number of stocks above their 50-day and 200-day SMAs. The dip on June 13 was brief and shallow, supporting the idea that we’re still in a bullish structure—though with pockets of volatility.

Final Thoughts
Friday’s breadth collapse raised some eyebrows, but Monday erased a lot of that doubt. The bounce was broad, not narrow. If this rally holds, it could mark the start of another leg higher. But be warned: breadth needs to keep expanding to avoid another round of chop or worse.
Bottom line: The market passed an important stress test. But this isn’t the time to be complacent, it’s the time to be selective, alert, and disciplined. The next few sessions will tell us whether Monday’s reversal was just a dead-cat bounce or the start of renewed strength.
Kristoff - Co-founder, ChartMill
Next to read: Market Monitor News, June 17