Triangle Chart Patterns
What Is a Triangle?
In technical analysis, a triangle is a common chart pattern that signifies a period of consolidation in the price of an asset. It is formed by drawing two converging trendlines, creating a shape that resembles a triangle.
Triangle patterns are significant because they provide insights into future price movements and potential breakouts.
Key Points To Remember
- Triangle patterns signify a period of consolidation in the market, where buyers and sellers are in balance.
- The converging trendlines represent decreasing volatility and indecision among traders.
- They often precede significant price movements.
- Triangles can be classified into ascending, descending, and symmetrical patterns.
Understanding Triangle Patterns
Triangle patterns are formed as a result of the market's indecision and the balance between buying and selling pressures. During this period of consolidation, the price oscillates within the converging trendlines, forming a series of higher lows and lower highs.
The convergence of the trendlines represents decreasing volatility as the price range narrows. Traders closely monitor triangle patterns as they often precede significant price breakouts, leading to substantial moves in either direction.
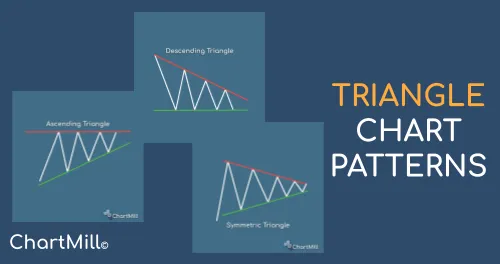
Types of Triangles
There are three main types of triangle patterns:
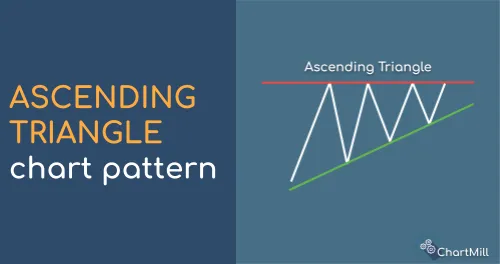
Ascending Triangle
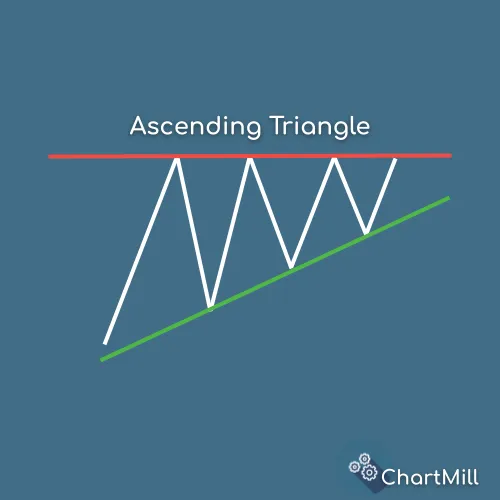
An ascending triangle is a bullish pattern that typically forms during an uptrend. It is characterized by a flat upper trendline and a rising lower trendline.
The flat resistance line indicates that buyers are willing to buy at higher prices, while the rising support line reflects increasing buying pressure. Traders often anticipate a bullish breakout, signaling a potential continuation of the uptrend.
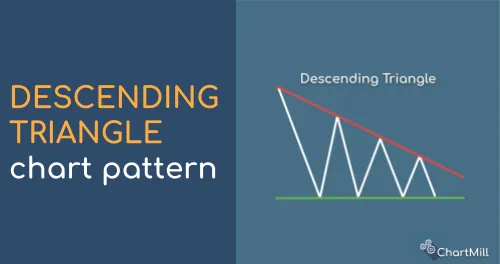
Descending Triangle
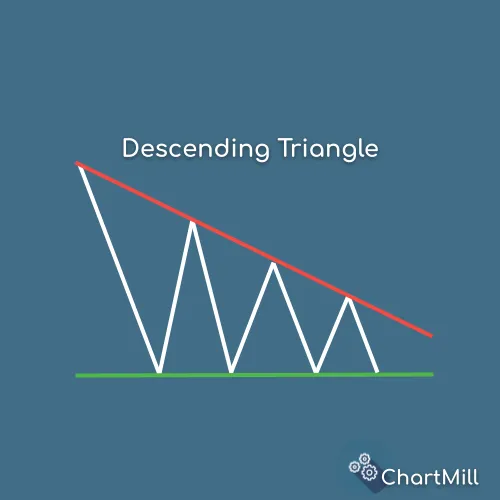
In contrast to the ascending triangle, a descending triangle is a bearish pattern that generally occurs during a downtrend. It features a flat support line and a declining resistance line.
The flat support line suggests that sellers are willing to sell at lower prices, while the descending resistance line indicates persistent selling pressure. Traders often anticipate a bearish breakdown, signaling a potential continuation of the downtrend.
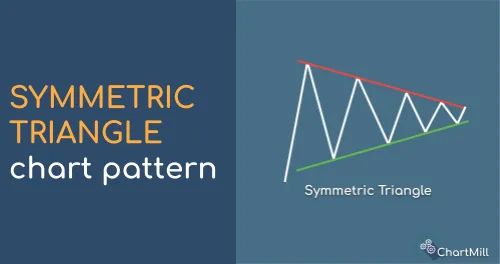
Symmetrical Triangle
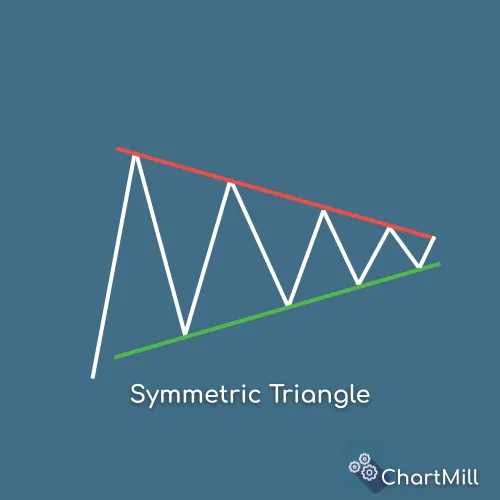
A symmetrical triangle, also known as a coil pattern, is a neutral pattern that can form during both uptrends and downtrends. It is characterized by two converging trendlines of similar slope, with neither line noticeably steeper than the other.
This pattern indicates indecision in the market, with buyers and sellers in balance. Traders typically expect a breakout in either direction, leading to a significant price move.
Symmetrical triangles can be useful in determining potential entry and exit points, as the breakout often results in strong momentum and increased volatility.
Why Do These Patterns Work?
Triangle patterns work due to the underlying psychology and behavior of market participants. Here are a few reasons why these patterns tend to be effective:
-
Convergence of Buying and Selling Pressures: Triangle patterns form as a result of the market's indecision, with buyers and sellers in balance. The converging trendlines represent a gradual reduction in the range of price fluctuations. This convergence indicates that the market is reaching a point where buying and selling pressures are becoming more equal.
-
Period of Consolidation: Triangles represent a period of consolidation or rest in the market. This consolidation occurs as traders reassess their positions, causing the price to move within a tightening range. The reduced volatility during this phase creates a coiled spring effect, where energy builds up for an eventual breakout.
-
Support and Resistance Levels: Triangle patterns are defined by trendlines that act as support and resistance levels. These levels are important psychological barriers where traders are likely to take action. When the price approaches these trendlines, it often triggers buying or selling activity, leading to potential breakouts.
-
Breakout Traders: Traders who specialize in breakout strategies closely monitor triangle patterns. When the price breaks out of the pattern, it often attracts the attention of these traders who seek to capitalize on strong price movements. This influx of trading volume from breakout traders can reinforce the direction of the breakout.
-
Shift in Market Sentiment: Triangle patterns can indicate a potential shift in market sentiment. For example, an ascending triangle suggests increasing buying pressure and optimism, while a descending triangle indicates growing selling pressure and pessimism. Traders interpret these patterns as signals of a potential continuation or reversal of the prevailing trend.
-
Self-Fulfilling Prophecy: Triangle patterns have become widely recognized among traders and investors. This recognition leads to a self-fulfilling prophecy, where a large number of market participants observe the same pattern and react accordingly. As more traders act upon the breakout signals generated by triangle patterns, their effectiveness can be reinforced.
How To Trade Triangle Patterns?
Trading Breakouts
This method involves waiting for a breakout of the triangle pattern.
Traders can enter a trade when the price breaks above the upper trendline in an ascending or symmetrical triangle, or below the lower trendline in a descending or symmetrical triangle.
Entry can be accompanied by an increase in volume, confirming the breakout.
Trading Pullbacks
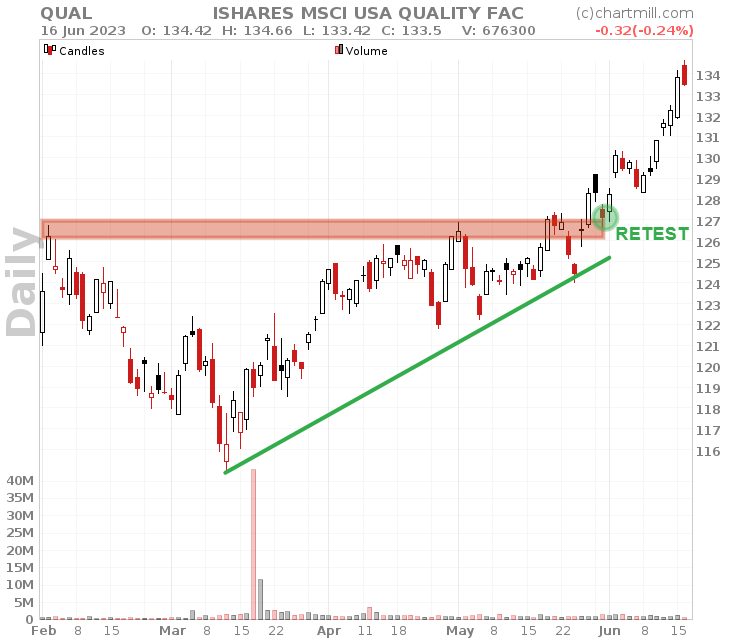
Traders employing this method wait for a pullback or retest of the broken trendline after the breakout. They enter the trade when the price retraces back to the trendline, using it as a support or resistance level.
This strategy aims to catch a favorable entry point with a potentially improved risk-to-reward ratio.
FAQ
What's The Difference Between a Triangle And a Wedge?
A Wedge is similar to a Triangle. It is also formed between two converging support and resistance lines. Yet there is a substantial difference.
For the triangle pattern, one of the two lines is always horizontal. For a bullish triangle formation it is the upper resistance line, for a bearish triangle formation it is the lower support line. In a wedge, both lines always slope upward (rising wedge) or downward (falling wedge).
While both triangles and wedges are chart patterns that represent periods of consolidation, triangles are typically continuation patterns, while wedges are often considered reversal patterns.
What's The Difference Between a Triangle And a Pennant?
A pennant is a symmetrical triangle pattern but on a much shorter time frame. It occurs after a strong price movement after which the price consolidates for a short time.
Pennants share many characteristics with flag patterns except that in a pennant, the flag consists of two lines converging to form a point.
Pennants are usually characterized by a sharp rise or fall in trading volume during the initial price movement, followed by a fall in volume during the consolidation phase.
Traders look for a breakout in the direction of the preceding price trend, often accompanied by an increase in volume, to confirm the pattern and anticipate possible price continuation.
More detailed content on Triangle Patterns
The Ascending Triangle
An ascending triangle is a bullish continuation chart pattern that forms when there is a strong upward trend in the price of an asset. Read more...
The Descending Triangle
The descending triangle is formed by drawing a horizontal line that connects a series of lower highs and a descending trendline that connects a series of equal or slightly lower lows. Read more...
The Symmetrical Triangle
The symmetrical triangle pattern is considered neutral, therefore the probability of the pattern breaking out at the bottom or top is 50/50. Read More...
What is the triangle chart pattern and how to trade it (video)