Bull Flag Trading: How To Do It?
This 'Bull Flag Trading'-guide explains how to take advantage of the pattern, both as a swing and daytrader.
If you are not yet completely familiar with the flag pattern or you want to refresh your knowledge, you can read our article Bull Flag Chart Pattern Explained where the pattern is described in detail.
The importance of volume and momentum
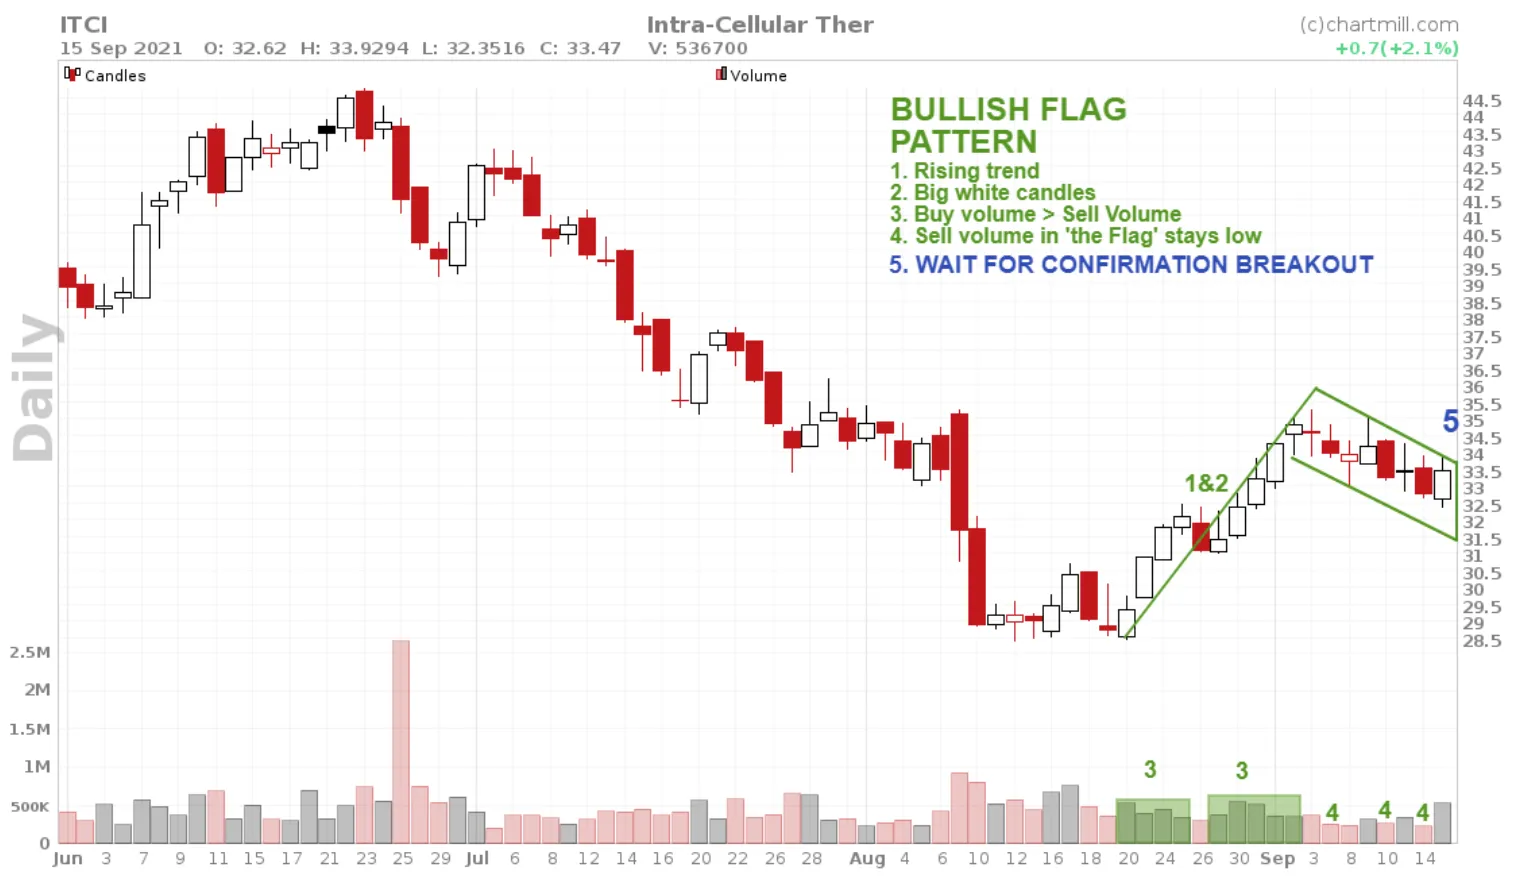
Check out the bullish Flag Pattern in the chart of Entravision Communications Corp. on date of June 30, 2021.
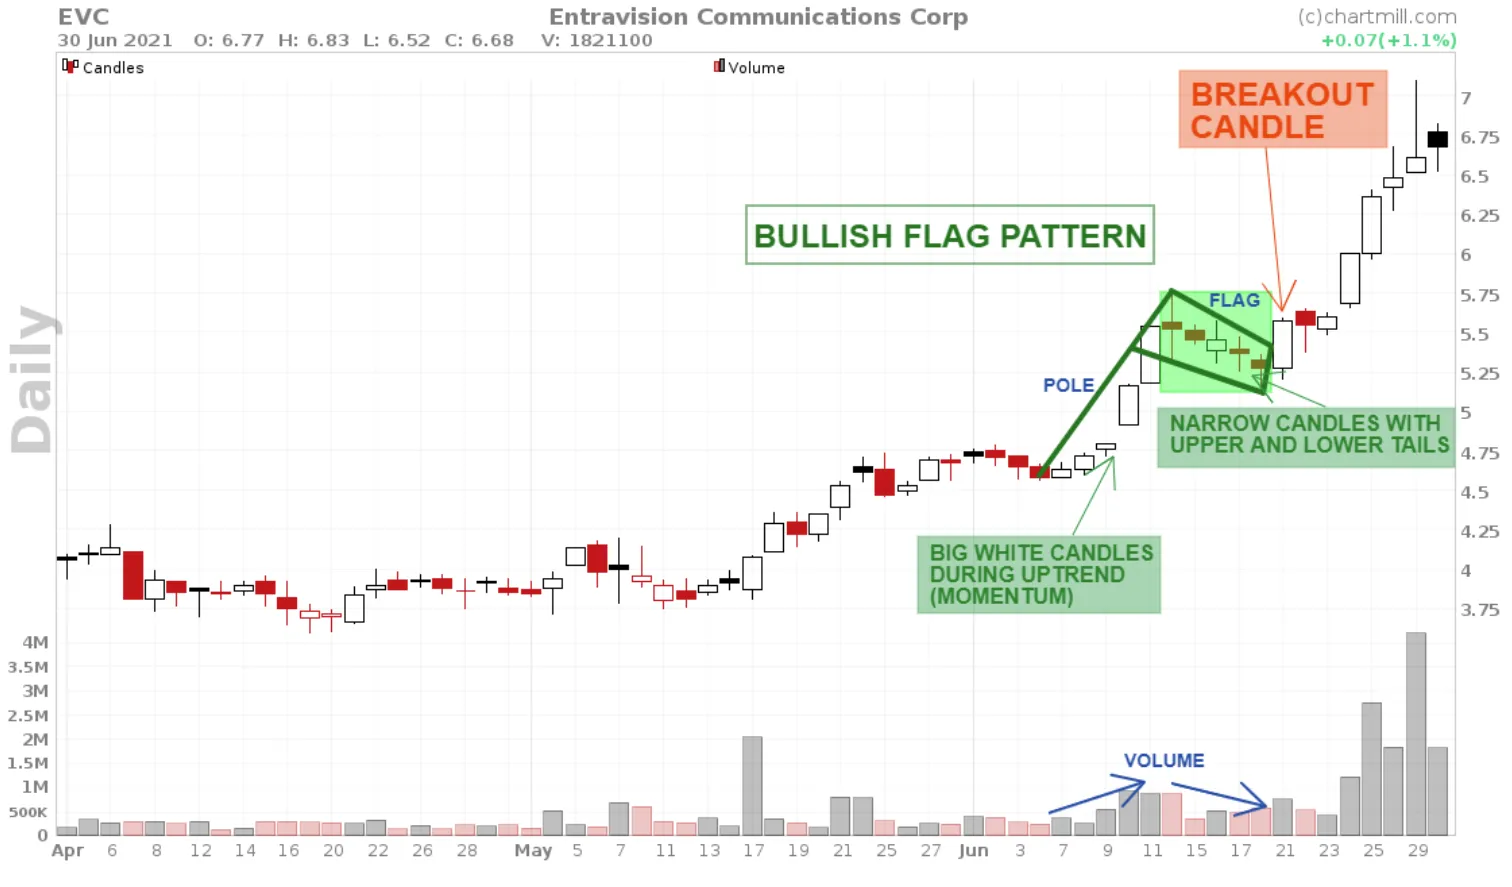
Volume and momentum are the most important characteristics when trading flag patterns (with all technical patterns, by the way). The pattern itself is only an indication, it gives us a potential low-risk setup.
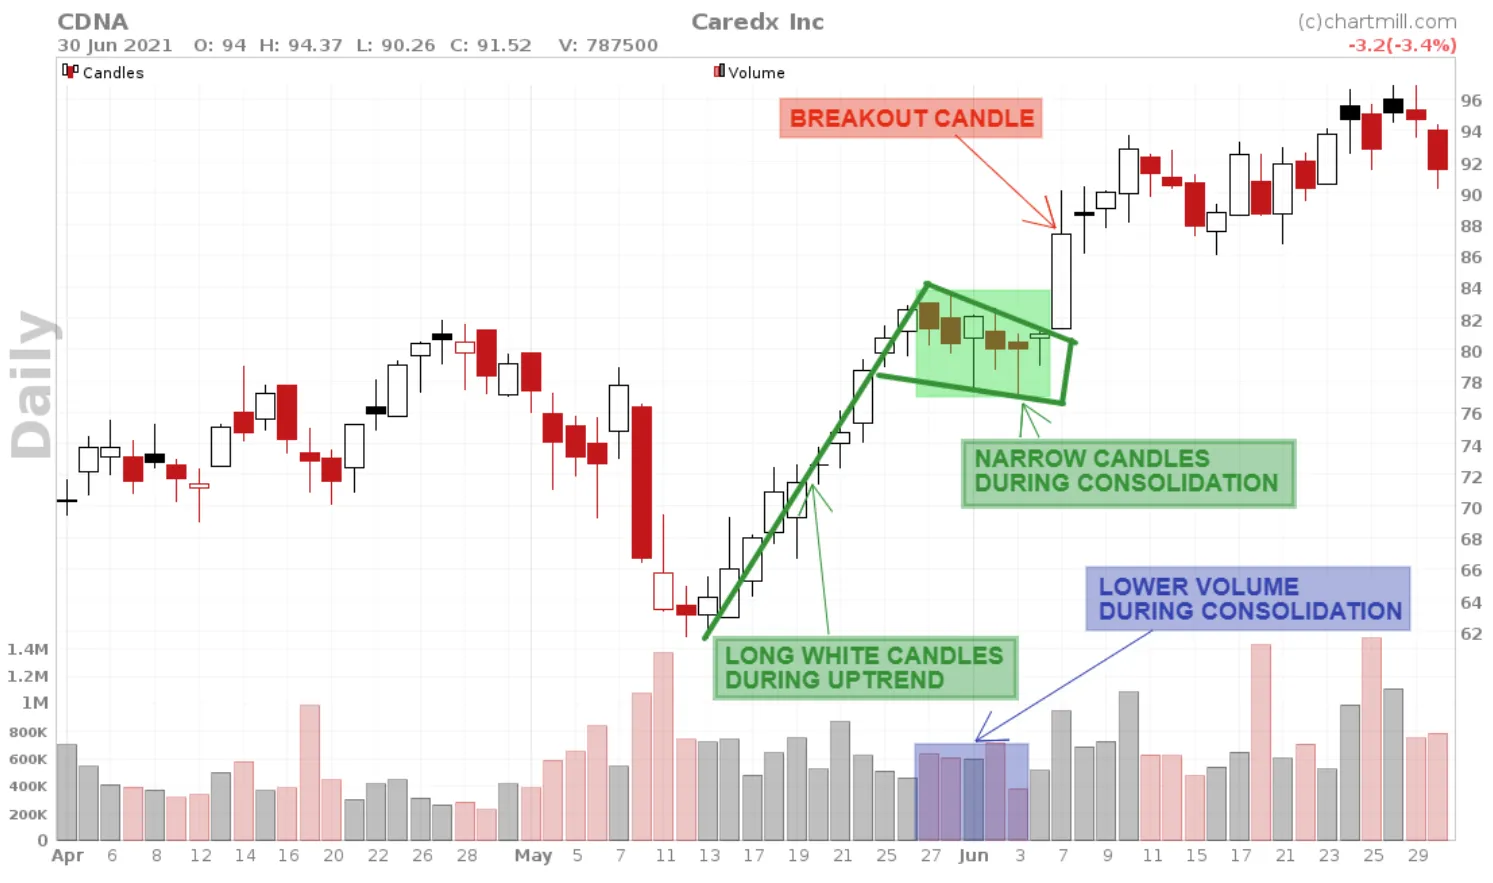
And another example for Caredx Inc. on date of June 7, 2021.
Momentum says something about the speed and force with which the price moves but says nothing about the direction the price is going.
Volume has everything to do with the number of shares that change hands.
This can be measured over a single day or over a longer time period.
When rising momentum and volume occur together, this is important information for the technical trader. After all, you are dealing with a price movement that is gaining strength (momentum), and at the same time, more and more shares are changing hands (volume).
This degree of volatility, combined with technical patterns and sound risk management, offers attractive opportunities to investors.
How NOT to trade this pattern...
The most common mistake is to try to anticipate the breakout move. While the candle is forming and going higher or lower than the outer limits of the flag, a position is already opened assuming that the breakout will take place. Unfortunately, you can't be sure of that.
The fact that the price goes through the lower or upper limits of the flag says nothing about where the final closing price of the candle will be. See the chart below.
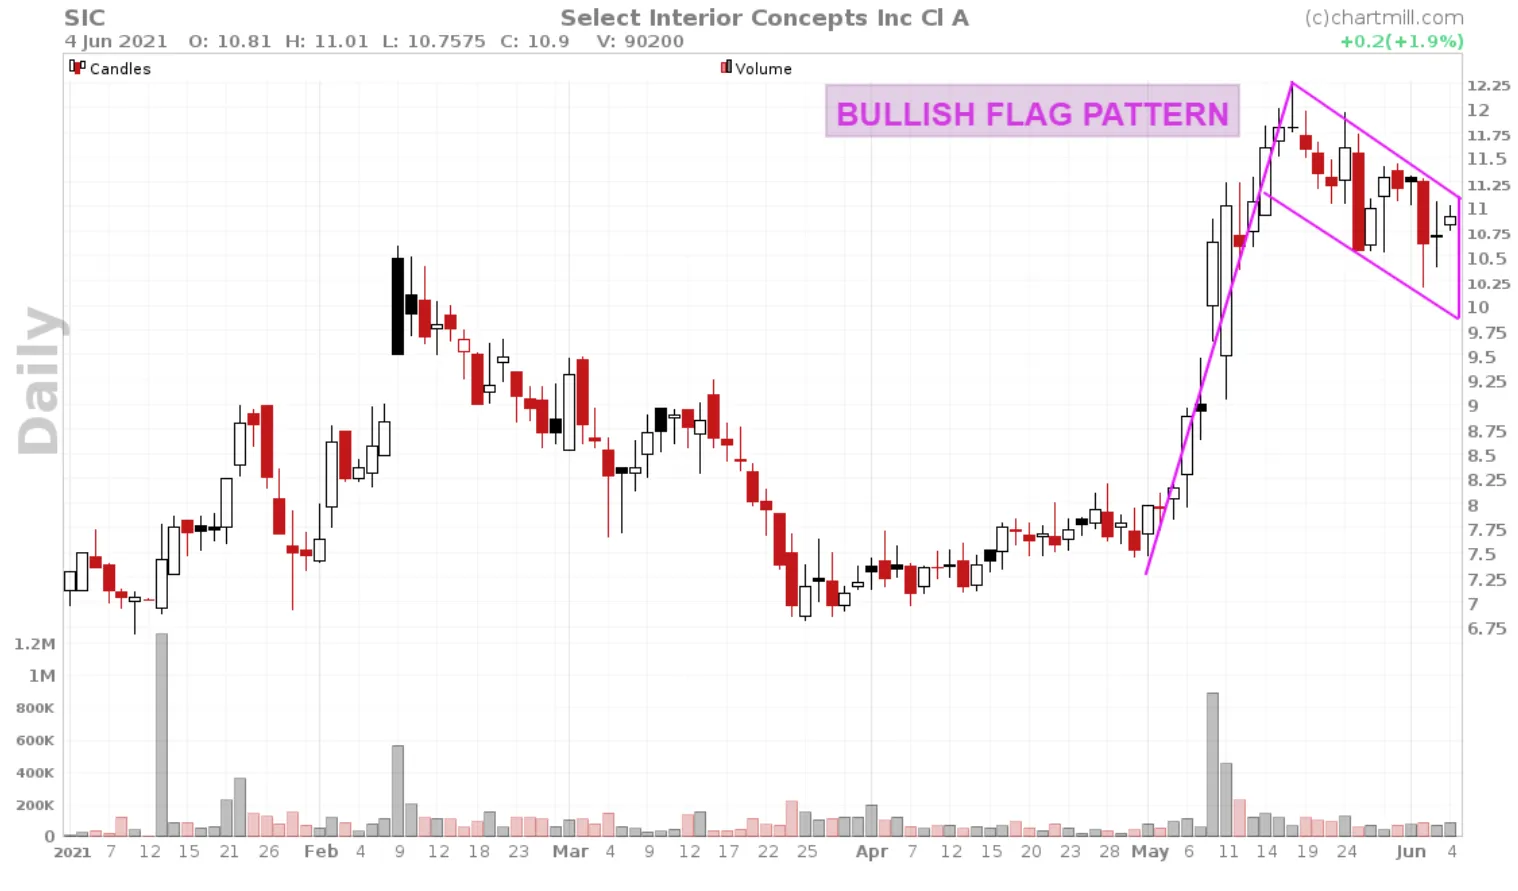
All the elements necessary for a valid bullish flag pattern are present. A strong increase with high volume and considerable momentum, followed by a sideways, slightly declining trading range which forms the actual flag. Nice!
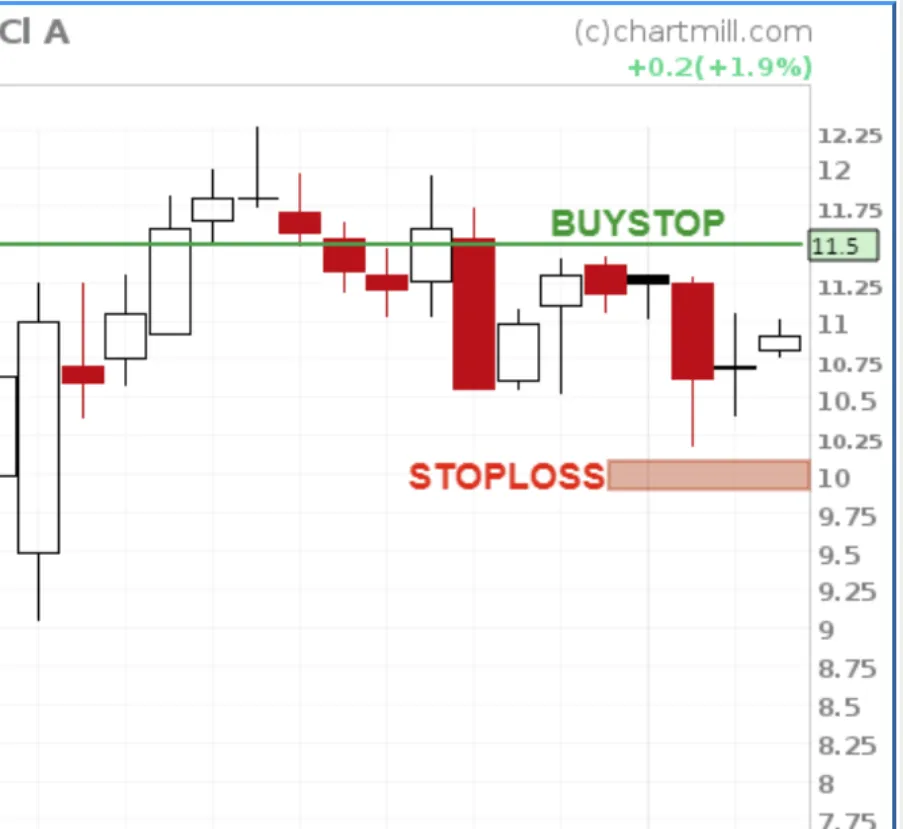
Now suppose we set our Buy Stop Order at $11.50, the price level at which we assume the flag pattern has effectively been broken and the price will move higher... The stop-loss is positioned just below the flag pattern.
The following day this happens:
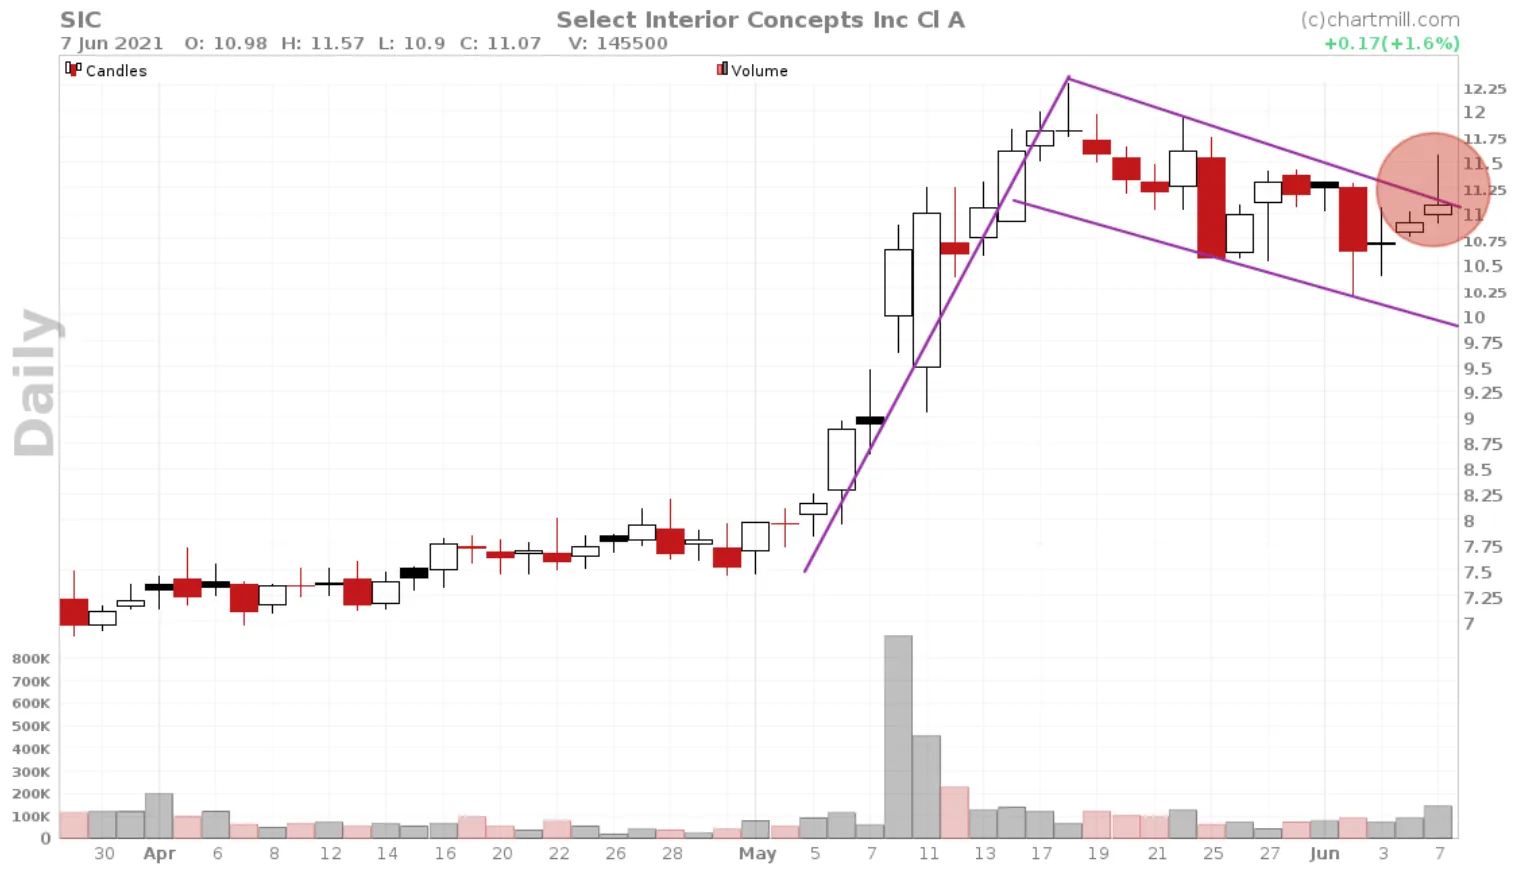
The breakout from the flag pattern proves false. At the end of the day, the price still closed within the flag pattern which again invalidates the setup.
However, by entering the market too quickly you are now stuck in a long position that suddenly looks far less attractive.
Not only it appears to be a false breakout but on top of that, a bearish doji candle had just been formed with a long upper-tail at the top of the trading range...
Barely three days later, on June 10, the long position was stopped out.
Just remember this rule: The first candle that breaks out and can close outside the limits of the pattern is proof that the pattern exists and that it can be observed on the chart. Until that happens, there is only the possibility of the pattern.
Bull Flag Trading for swing- and day traders
On Monday, September 10, I had ChartMill run a scan for a bullish flag pattern, using the following filters :
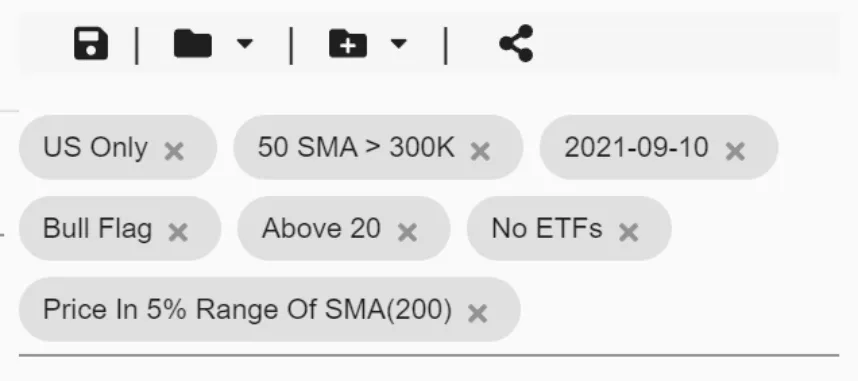
- Exchange : US only
- Price : Above 20
- Average Volume : 50SMA>300K
- ETF : No ETFs
- Bullish Flag Pattern recognized by ChartMill
With these filters, ChartMill showed me 112 candidates. To further refine these I then added another price filter :
- Price vs. SMA : Price in the 5% Range of SMA(200)
I ended up with only 5 results. As you can see in the screenshot above I have set the historical date to 2021-09-10, that way you can now access the exact filter results that ChartMill presented at the time using this link.
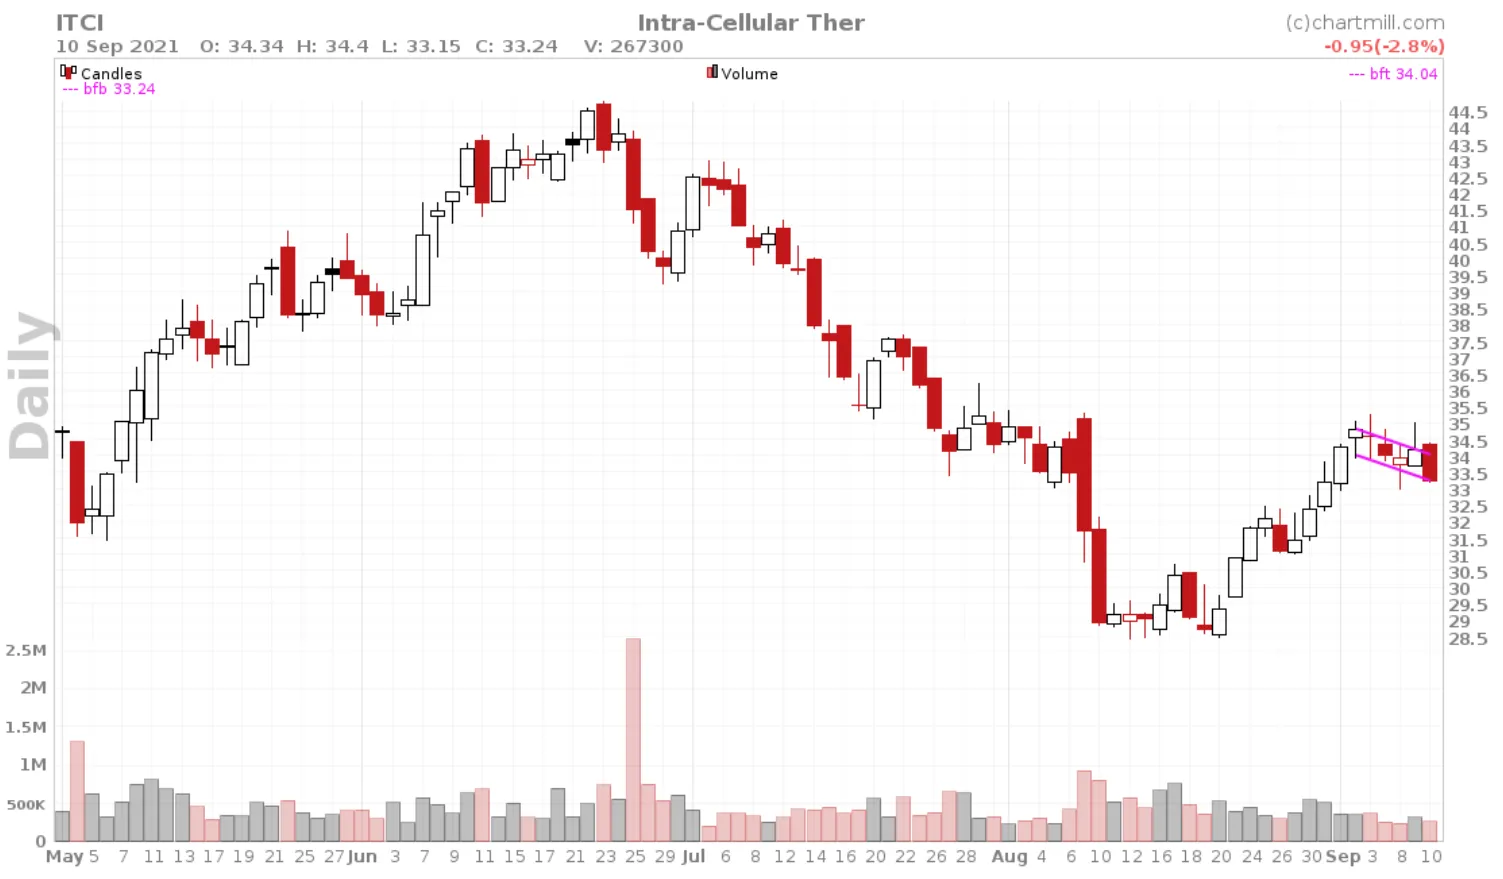
Initially, I thought that the filter was set too strict with this last condition but from this small group of stocks I noticed almost immediately one ticker: ITCI
For your reference, the two parallel slanted purple lines which form the flag pattern are drawn fully automatically by the software. To display them by default in the chart, choose the overlay 'ChartMill Flags' in the chart settings.
I added ‘ITCI’ to my watchlist, and three days later it looks like this…
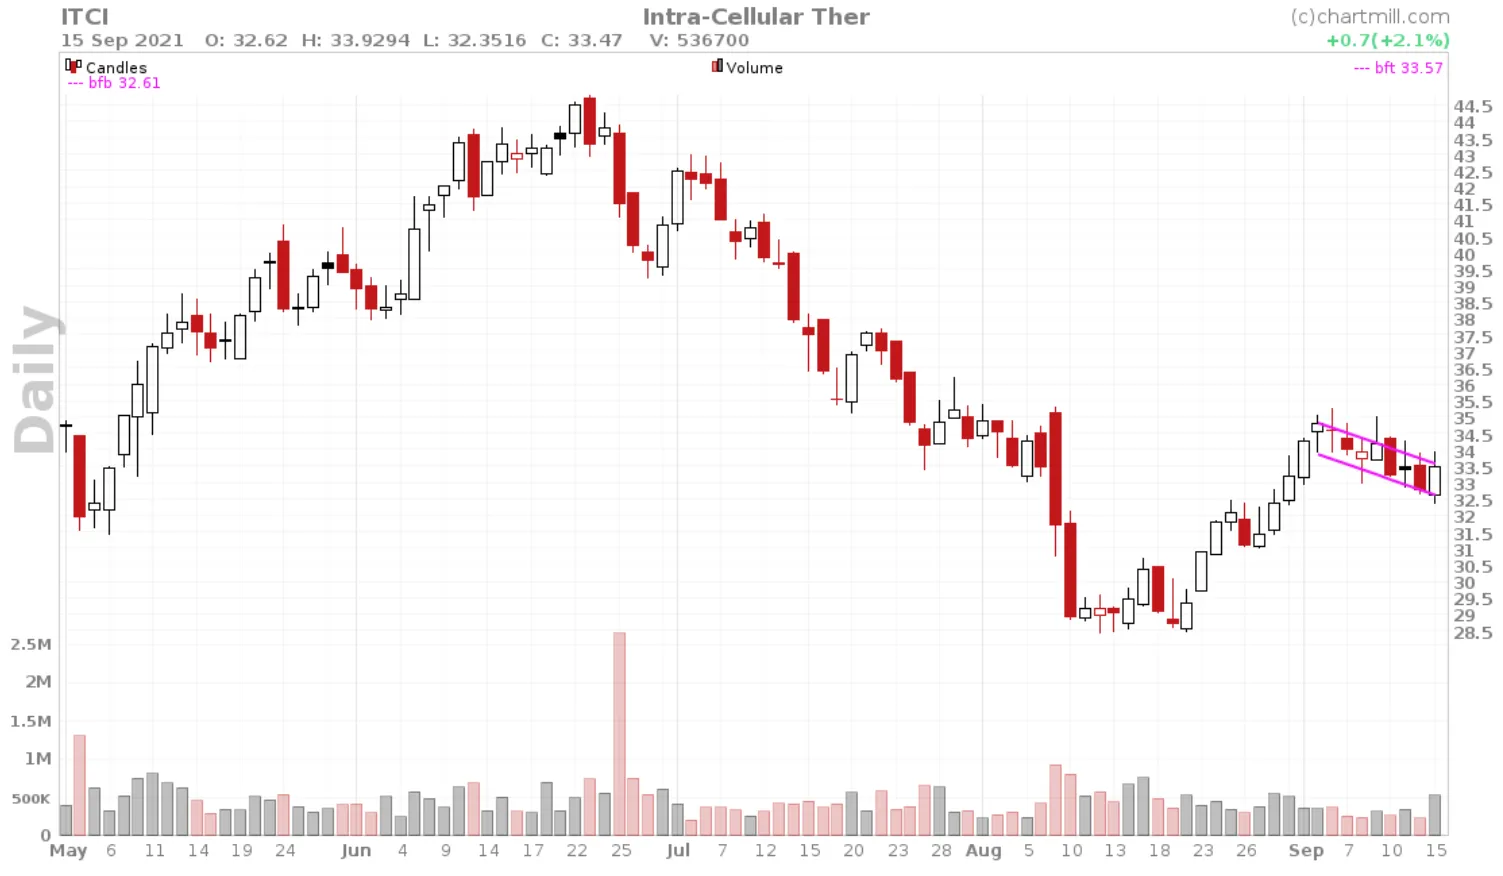
It remains a wonderful flag pattern but of course, we want to see confirmation. One thing I did notice on September 15 was the volume that went along with the rise that day.
So what do we observe after the September 15 trading day?
The confirmation move occurs the following day, the price rose by more than 3% and closed just below the high of the day. Moreover, the closing price was clearly above the bullish flag pattern which confirmed and completed this pattern.
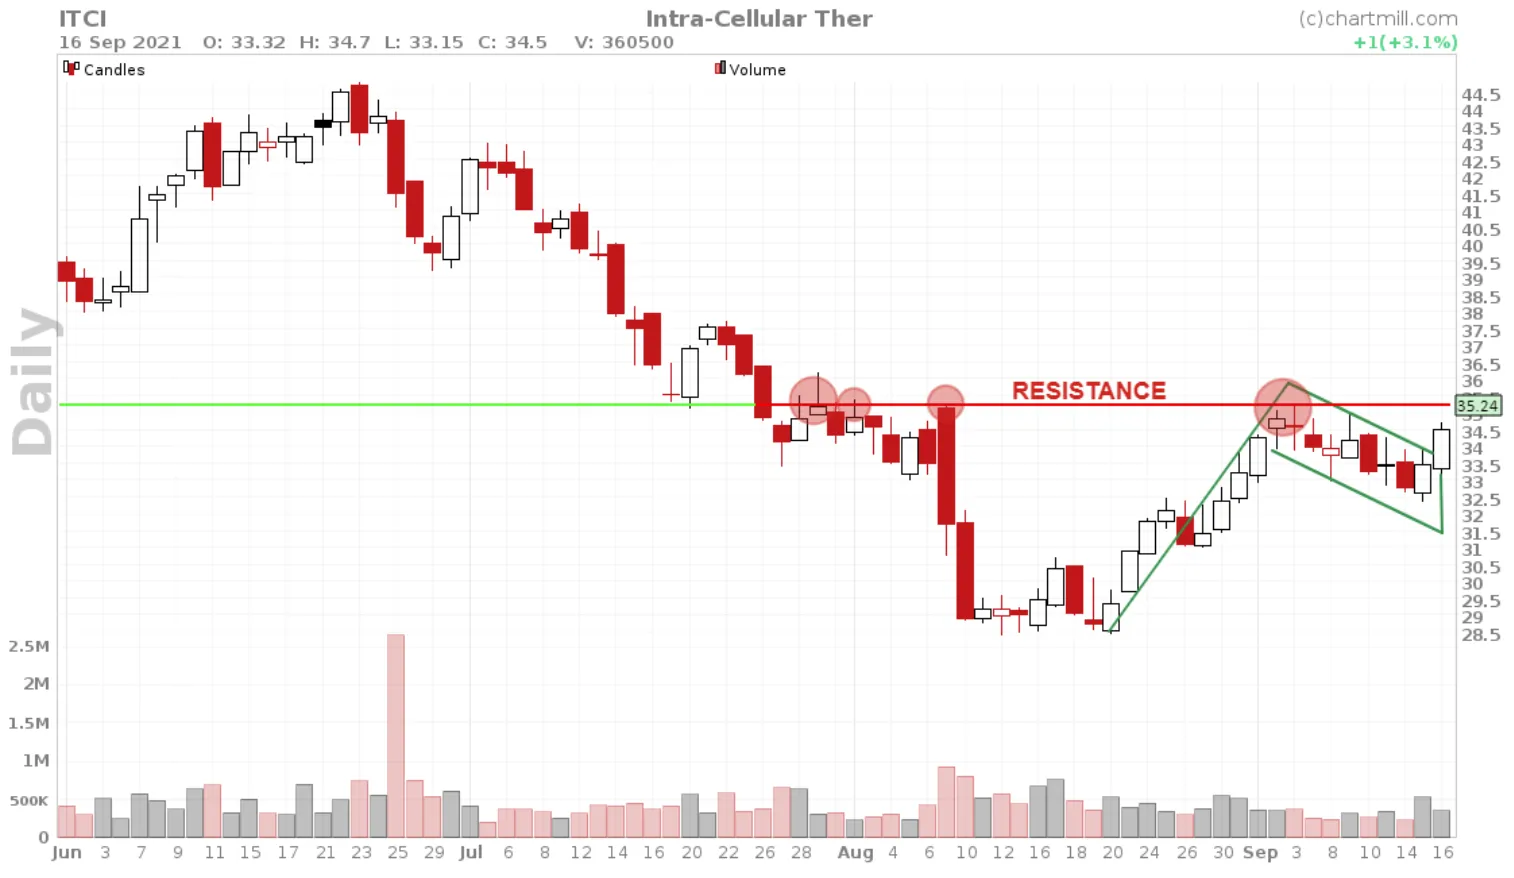
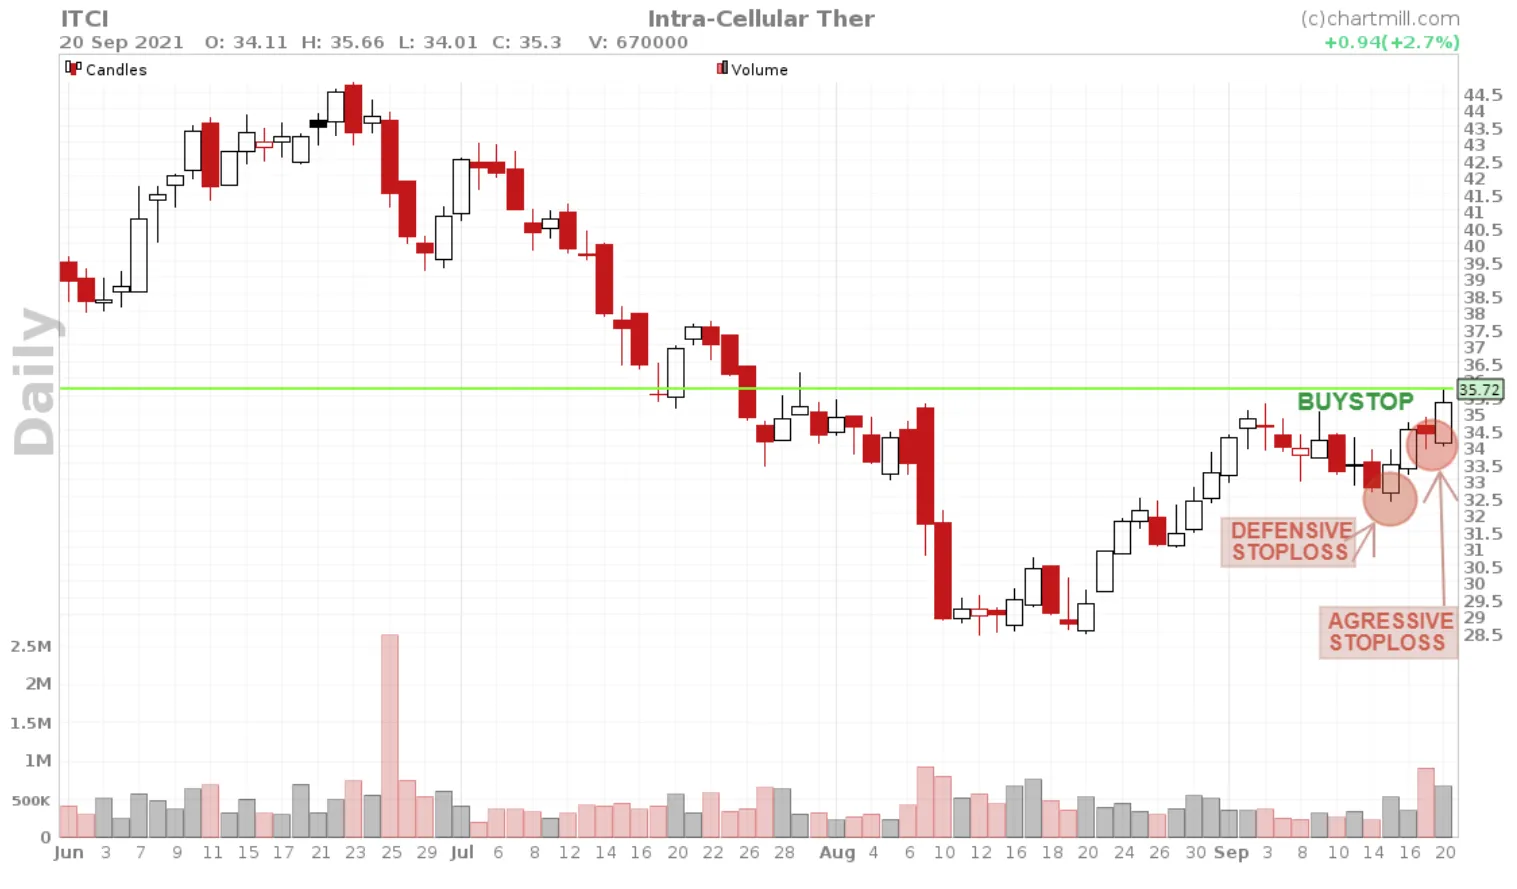
A Buysetup above the last candle is the next step but in this case, there was another problem in the form of a horizontal resistance level very close to the current closing price.
So… waiting again for a confirmation breakout (Did I already mention that patience is an essential skill as a trader?)
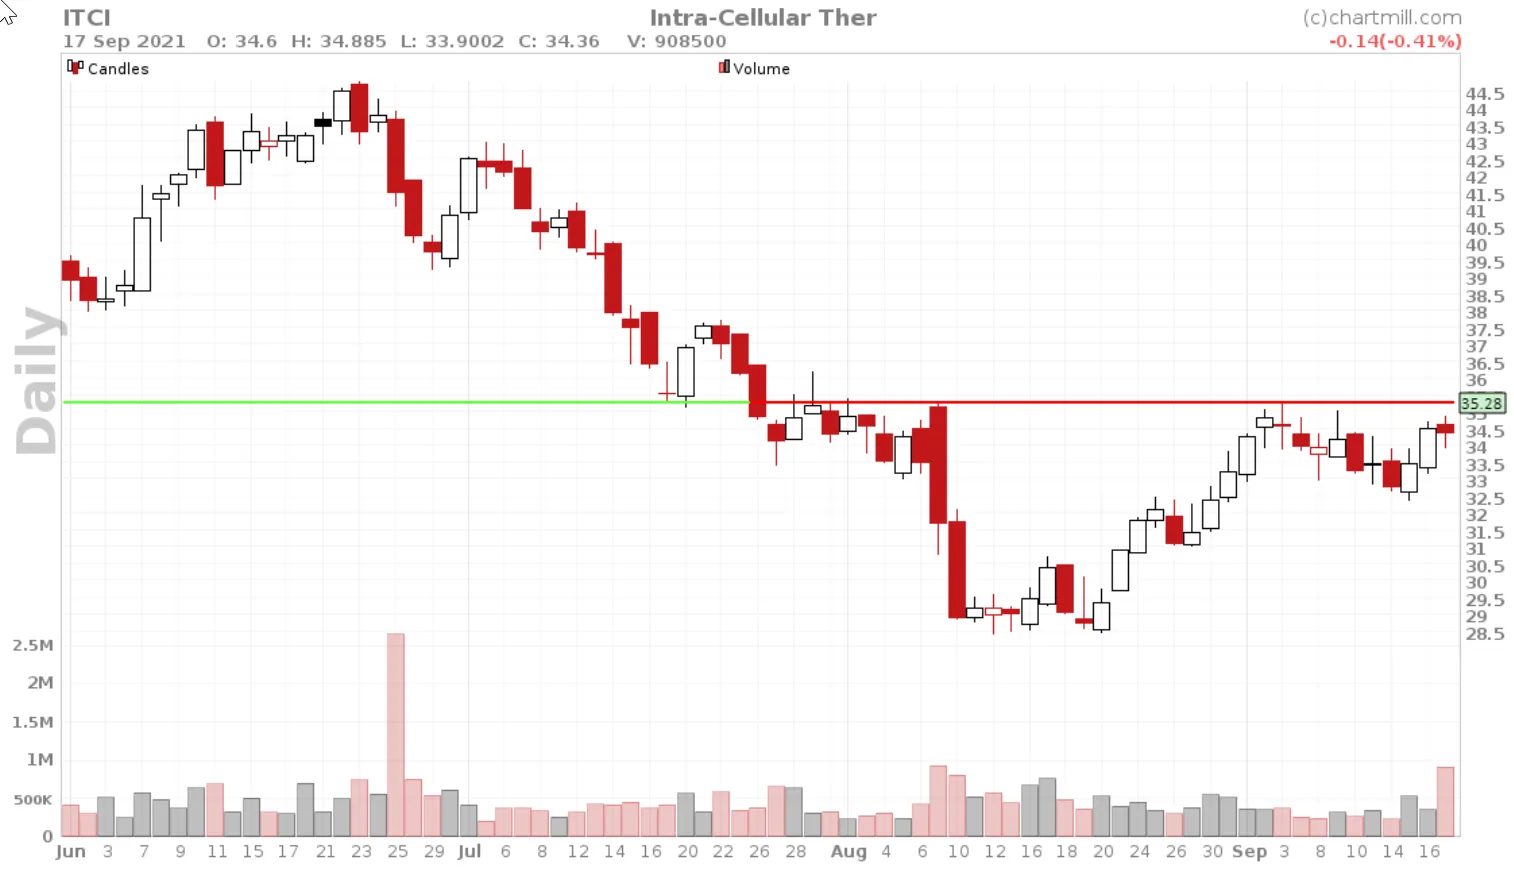
Nope, but it's starting to look better and better. A narrow doji candle and lots of volume just below key resistance... This looks promising!
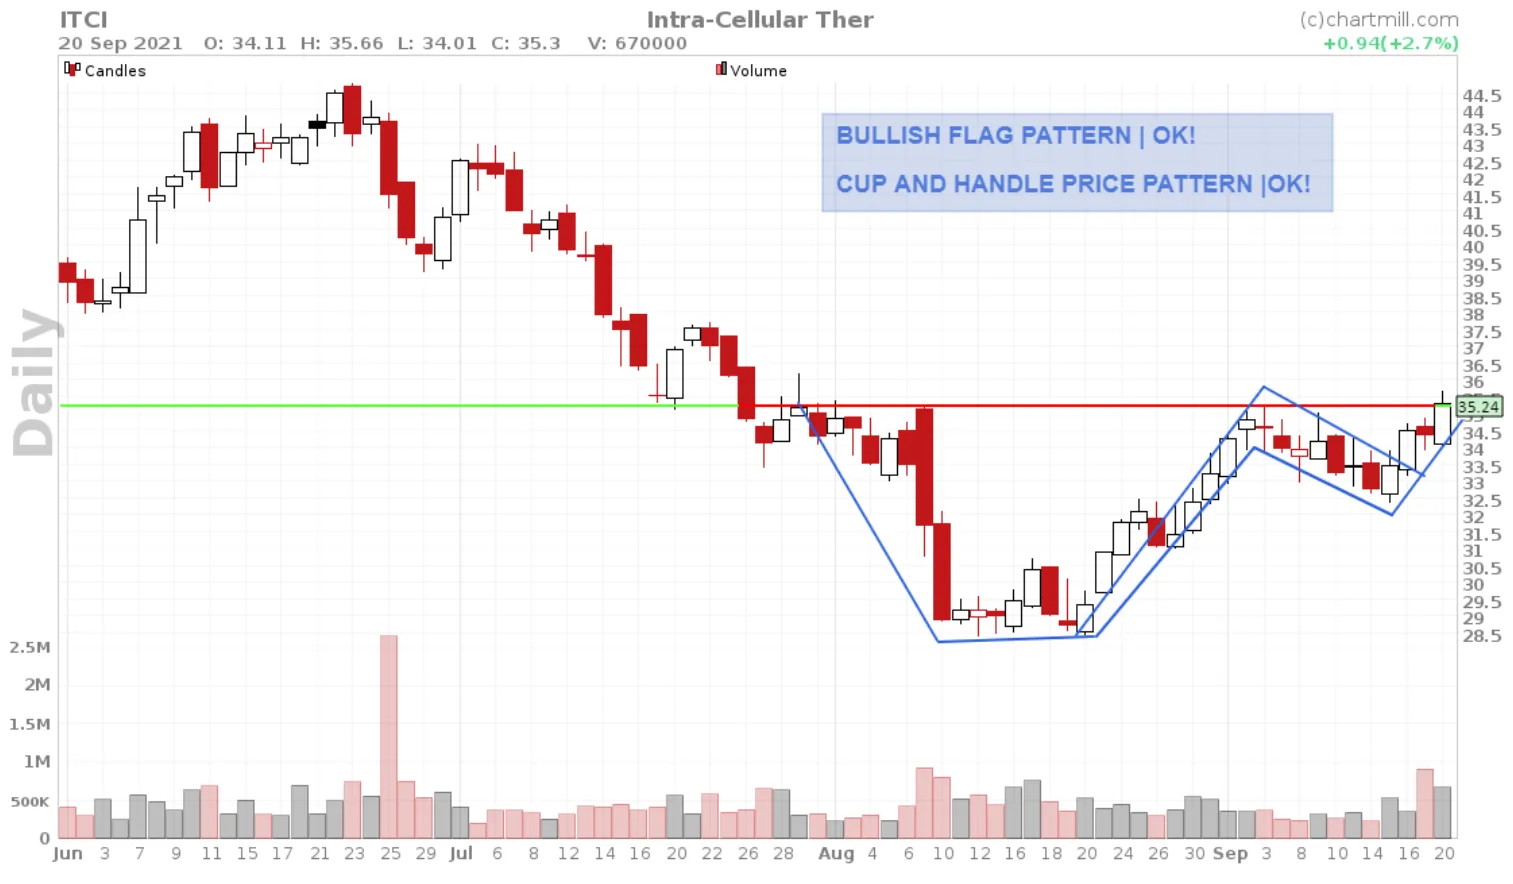
The following day, ITCI rises more than 2,5% and the closing price was just above resistance. We now have two confirmed price patterns, a Bullish Flag pattern in a Cup and Handle chart Pattern.
It’s time for a buy setup. As a swing- or trend trader the actual entry setup is on the daily chart:
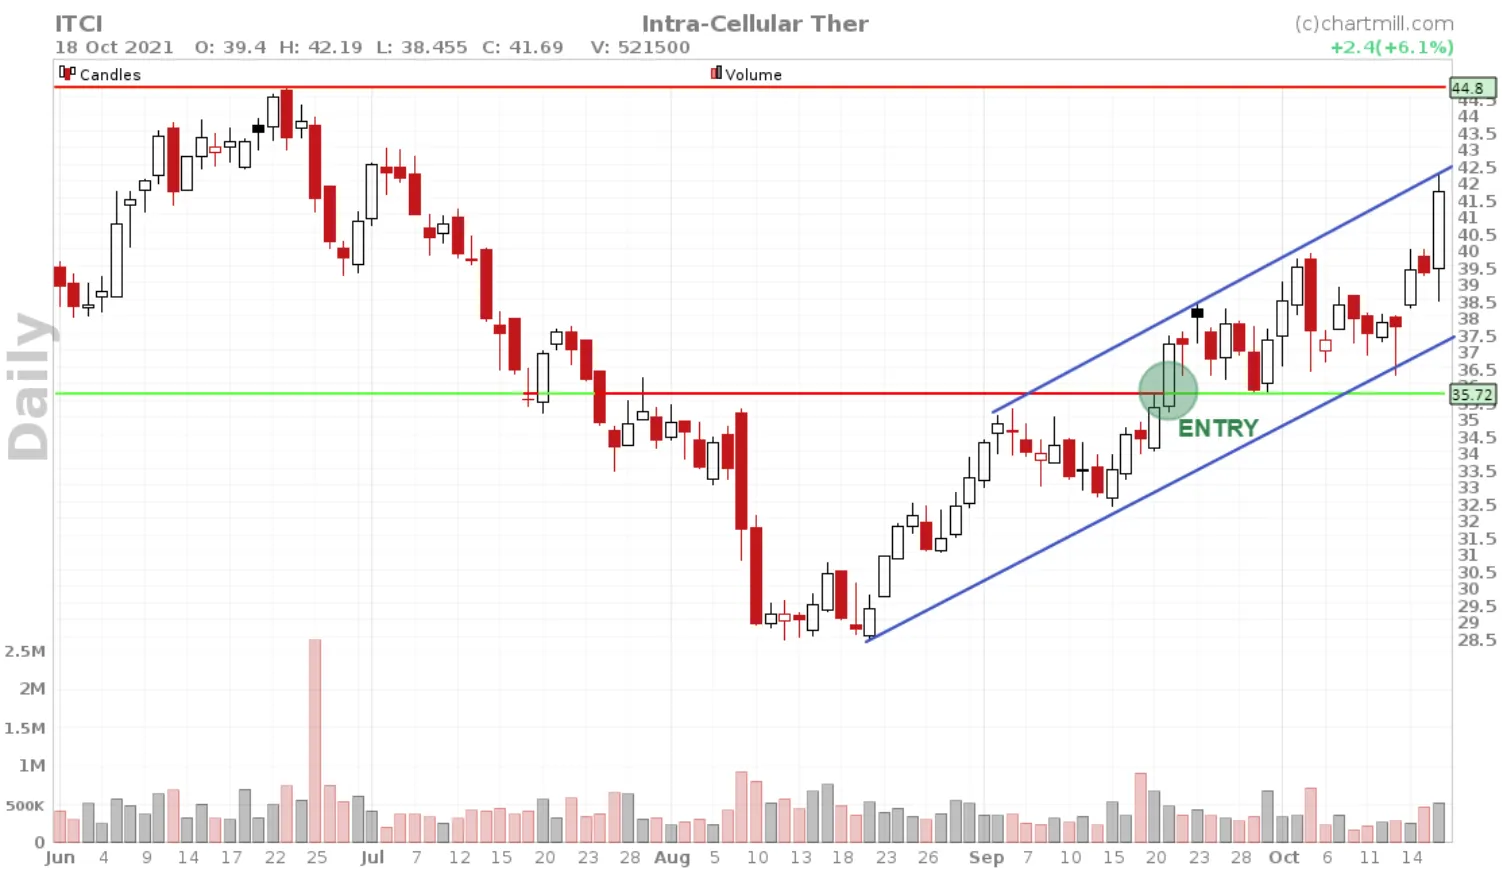
The first real target for this setup is situated at the previous high ($44,5). At the time of writing this article, the chart looks like this.
Finally, on Nov. 1, the price target was reached.
Position and stop-loss management

Knowing when to buy is one thing. Knowing how much you are allowed to buy and what your maximum loss will be if you get stopped out are additional essential elements for any individual trade.
ChartMill can calculate this quickly and fully automatically with the easy-to-use Position Sizing Tool.
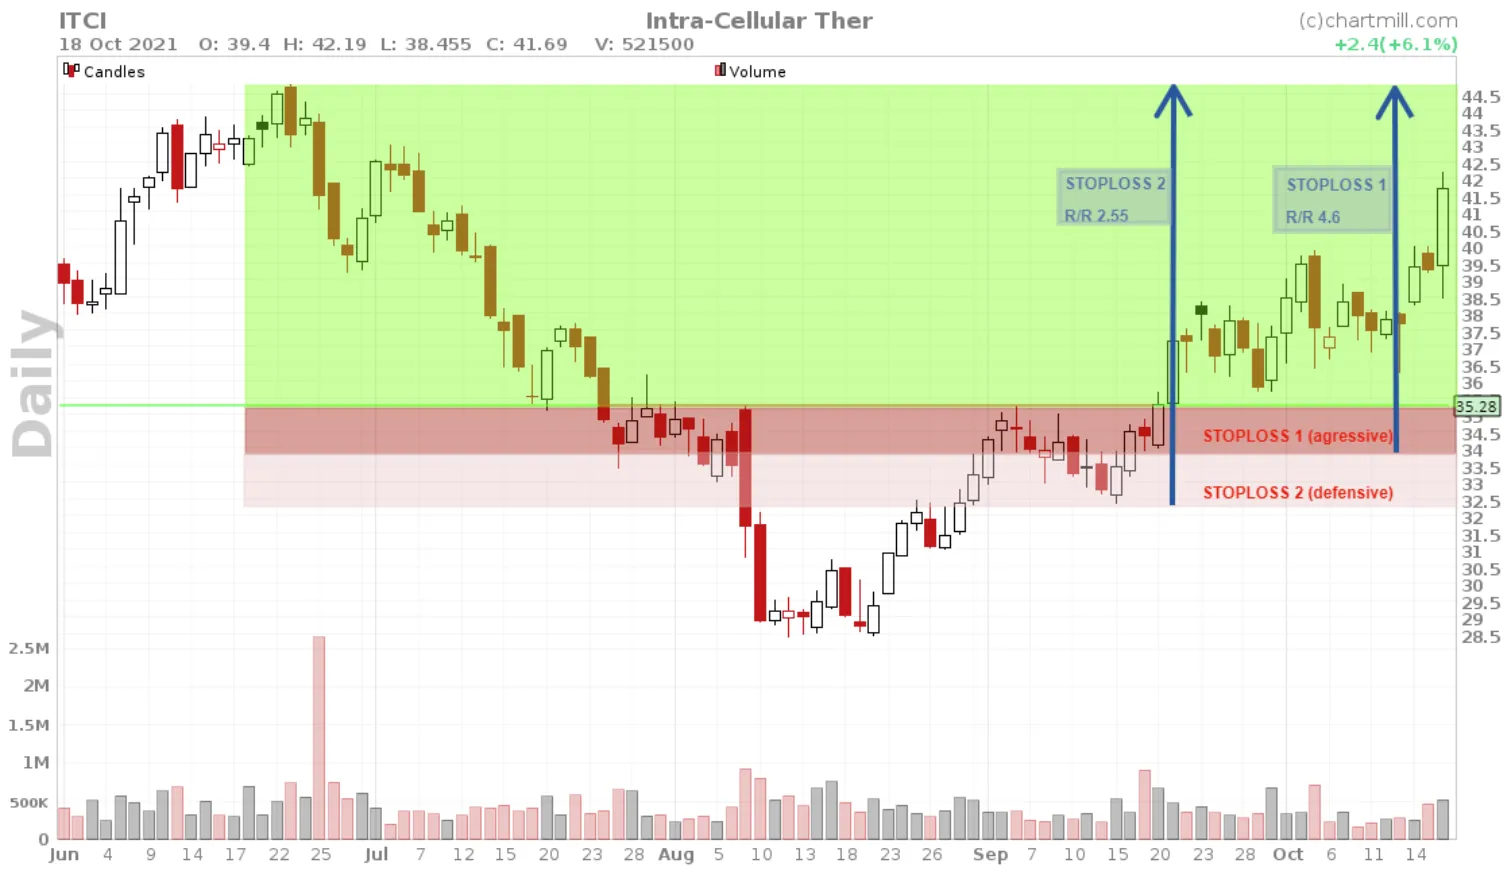
The software calculates how many shares you may/can buy based on your available trading equity. In the screenshots below we assume a trading capital of $25.000 and the maximum risk% is set at 1%.
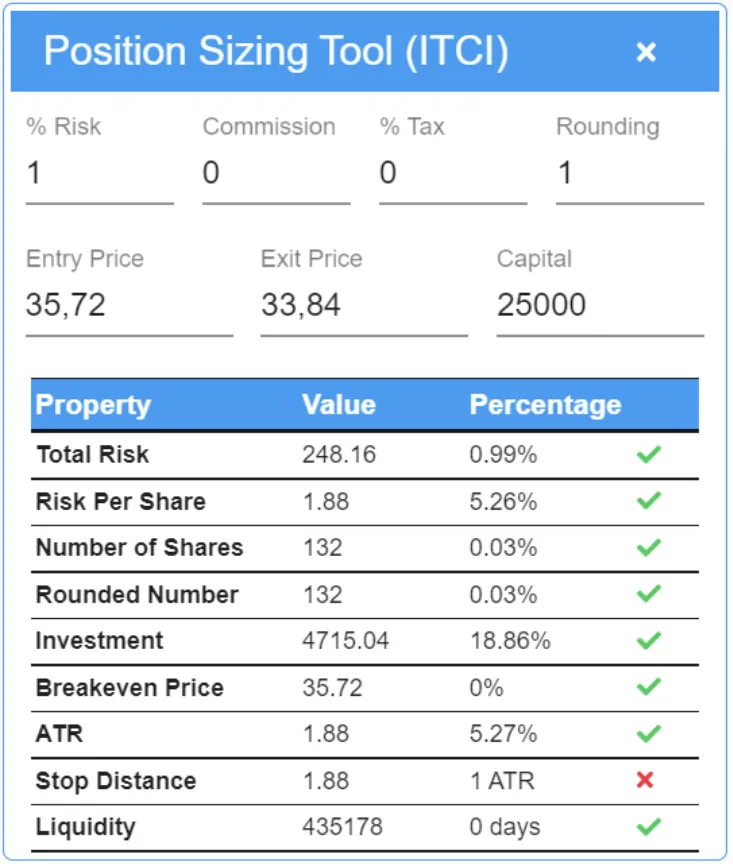
A defensive stop-loss is set at $32,28. The PST-Tool gives a warning if the stop-loss is less than 2ATR (Average True Range) from the entry.
In this case, however, the warning is incorrect because the tool only takes into account the current ATR position and this example dates from early June 2021, when the ATR value for the stock was approximately $1.35.
Thus, twice the ATR range means a stop-loss that should be at least $2.70 lower than the entry. This brings us in this example to $33.02 which is still well above the defined defensive stop-loss.
With the defensive stop-loss, the potential risk/reward (R/R) for this position is about 2.55 which is not bad at all.
If the more aggressive stop is used at $33.84 then we do end up below the intended 2-ATR value. In this case, at about 1.2 ATR if we take into account the ATR value at the time of entry.
Of course, this is a personal consideration and it is closely related to your investment style. But as you can see for yourself, this tool gives you information that you might not have even considered.
You can find an extensive article about all functions of the Position Sizing Tool via this link.
When using the more aggressive stop-loss, the R/R ratio rises to nearly 4.7. You could argue that in this case, the more aggressive stop-loss was the better choice...
But would you still believe that if after the entry the price fell below this shorter stop-loss and then rose again to where it is now?
The bottom line, the candles on the chart, after the long position was triggered, were not there at the time of the entry, so a defensive stop-loss certainly remains a well-considered choice.
How to take advantage of this pattern as a day trader?
The approach is pretty much the same, even as a day trader it is best to wait until the pattern is fully established before taking action.
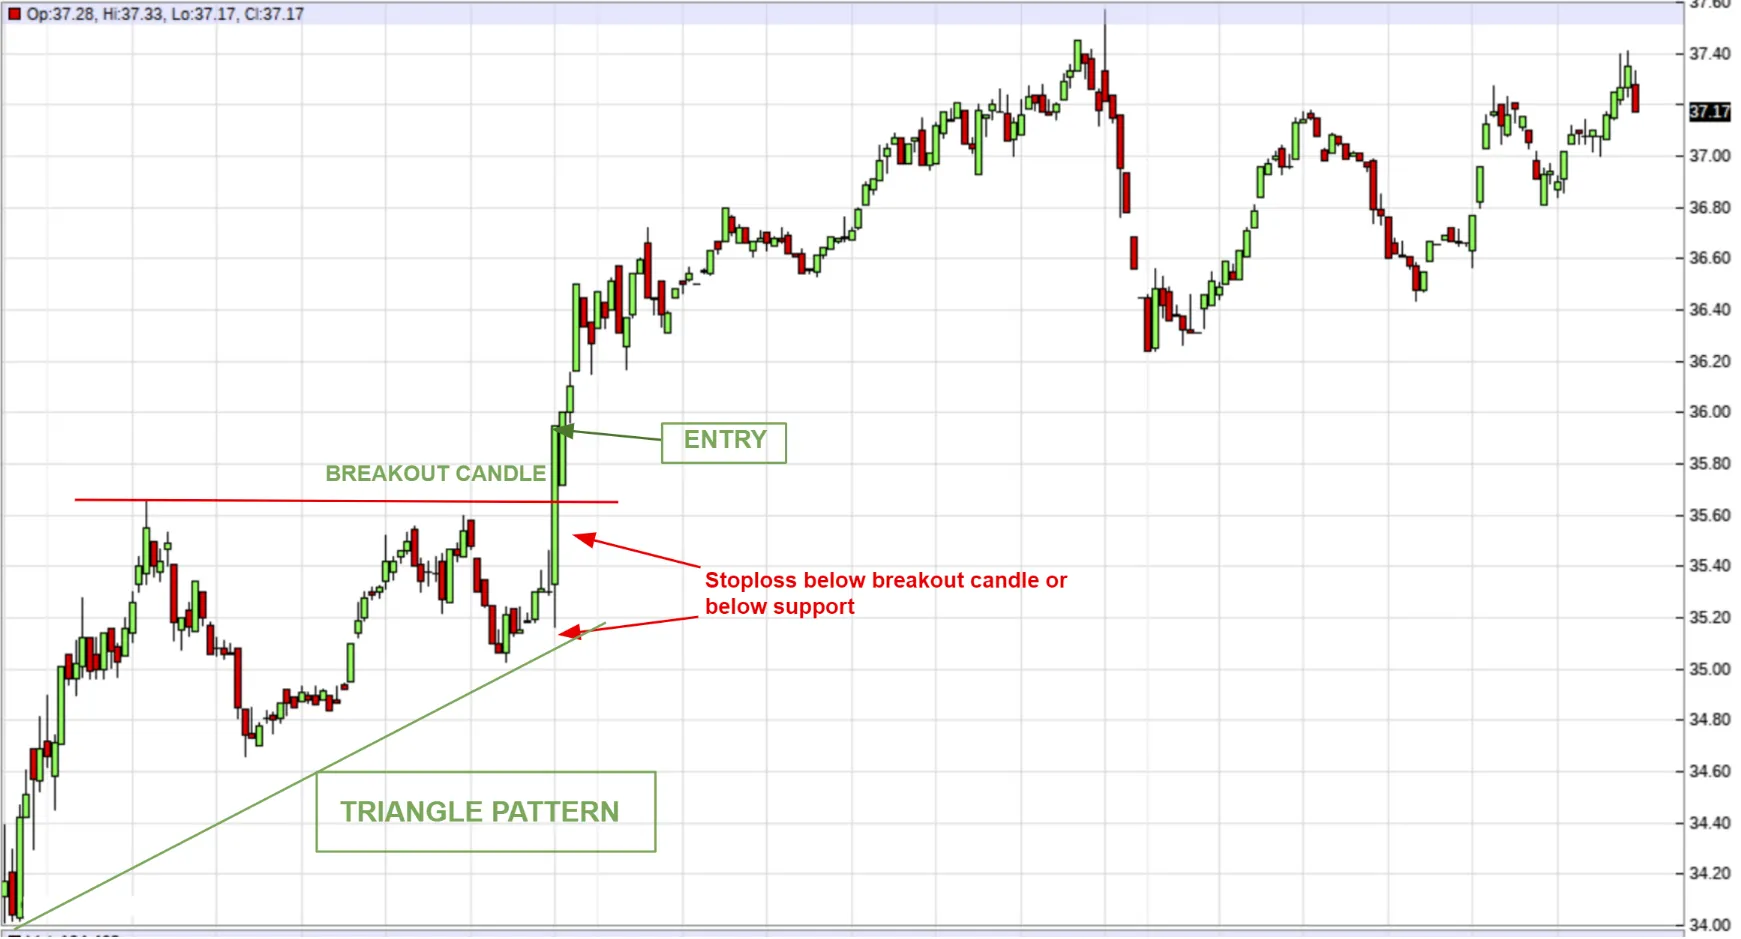
The 5-minute chart is shown above. The green long candle is the opening candle on the date of September 21, 2021. As seen on this intraday chart an ascending triangle pattern was visible. The price immediately breaks through horizontal resistance with lots of momentum.
This is quite noticeable by the fact that this is a huge green candle that closes strongly above the horizontal resistance. Just like with the break-out from the flag pattern, it is tempting to open a long position during the break-out.
As a short-term trader, this is certainly worth considering but keep in mind that you have no confirmation of the break-out until the candle closes above it. In this case, it turned out well and the position was never in any danger.
Where and when to exit?
It is impossible to give a ‘one-size-fits-all’ answer to that specific question. As a scalper, you will (hopefully) manage your position in a completely different way than as someone who wants to profit from the upward trend for as long as possible. So below I am providing several options for you to consider on the daily chart.
Yet one piece of advice I would like to share... Take the one that best suits your trading style and stick with it. There are no better or worse ways. The key to success in this area is consistency.
The main distinction you need to make first and foremost when determining your stop-loss is the following: Are you going for a set target price or do you want to hold the position as long as the trend lasts? If you prefer a price target it’s pretty simple; the moment you enter, your buy and stop orders and a sell limit order is created at the same time.
You can rely on a risk/reward of 1, 2, 3,...etc. or you can simply look at the next resistance level and place your target price just below it.
In the second case, there are numerous options but in the end, it always comes down to adjusting the stop-loss in your favor based on the price movements. The only rule you should never forget is that you may never change a stop-loss to your disadvantage.
Simple Moving Average
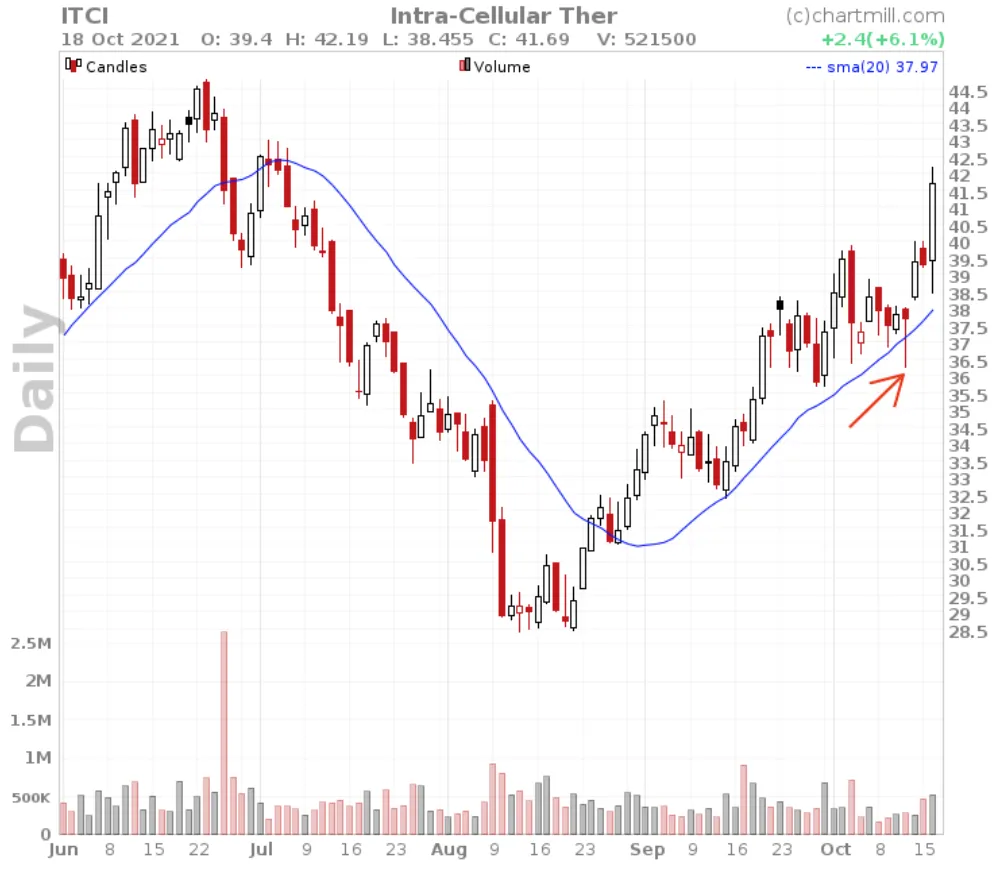
As soon as the first candle closes below the SMA, move the stop-loss just below the low of that candle. In this example, I’ve used a SMA20 but if you want to give the price a little more room you can opt for an SMA50.
Trendline
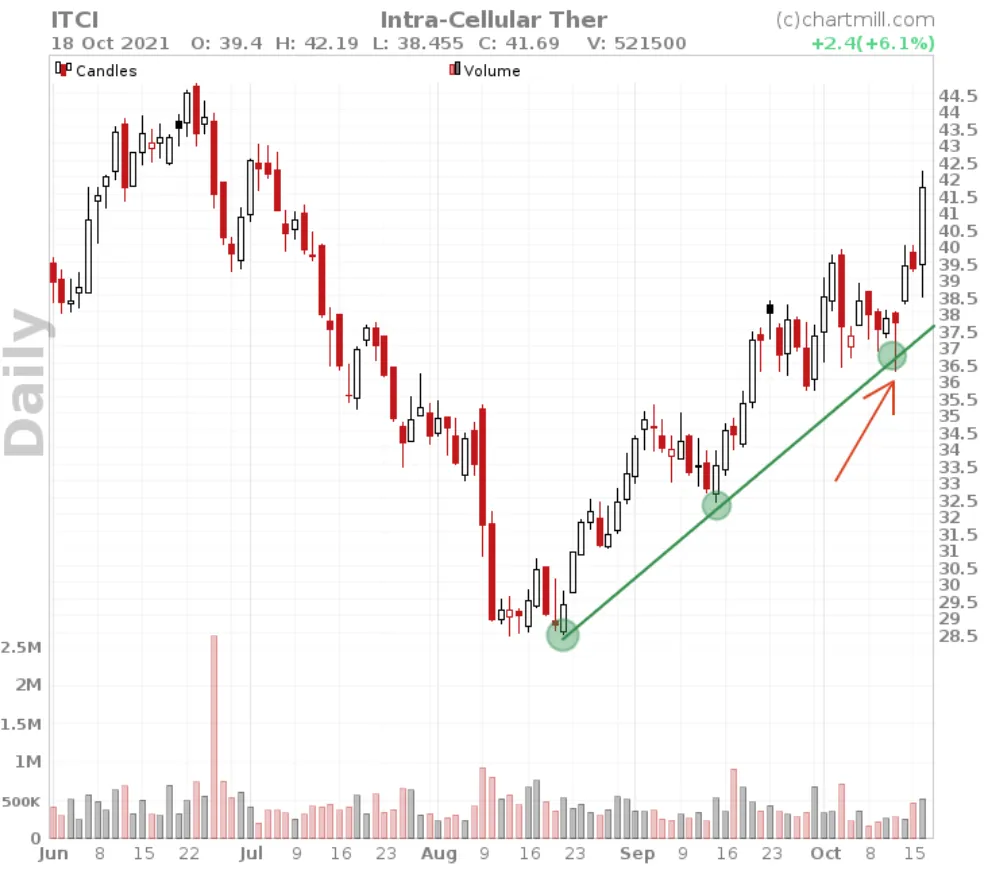
As soon as the first candle closes below the ascending trendline, move the stop-loss just below the low of that candle.
Swing Points (Higher Highs and Higher Lows)
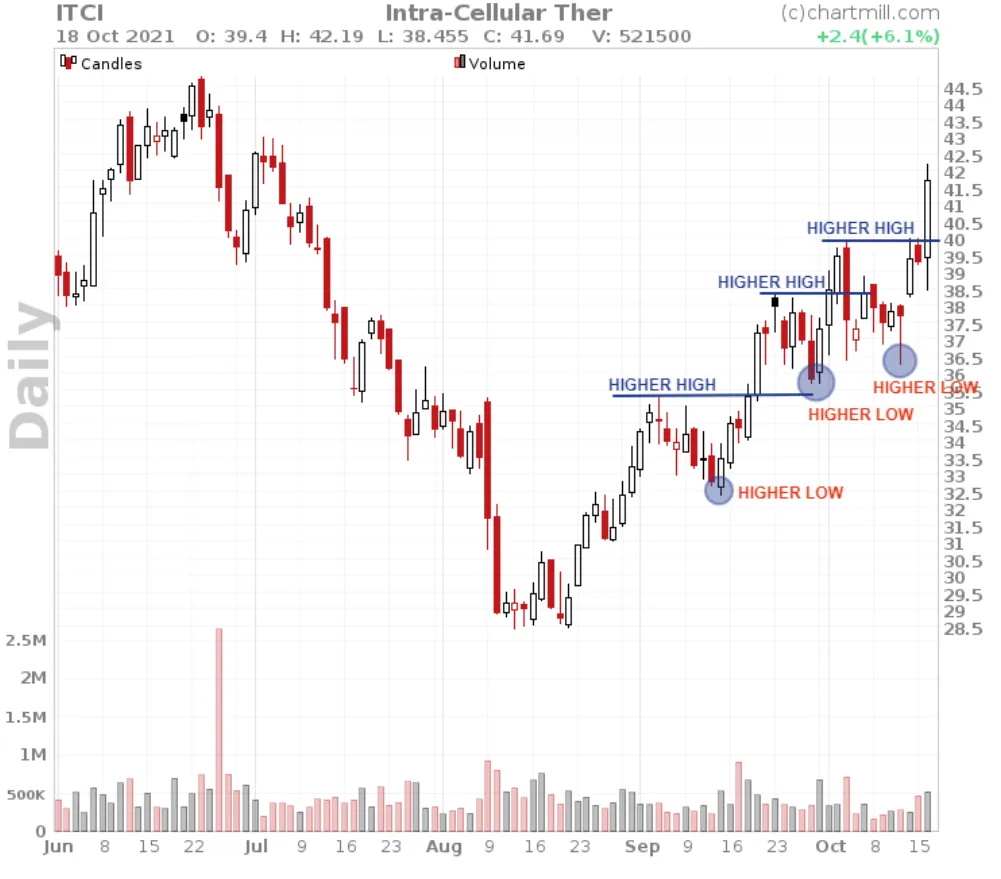
As soon as a new higher high is established, move the stop-loss to just below the most recent higher low.
ATR-based stop
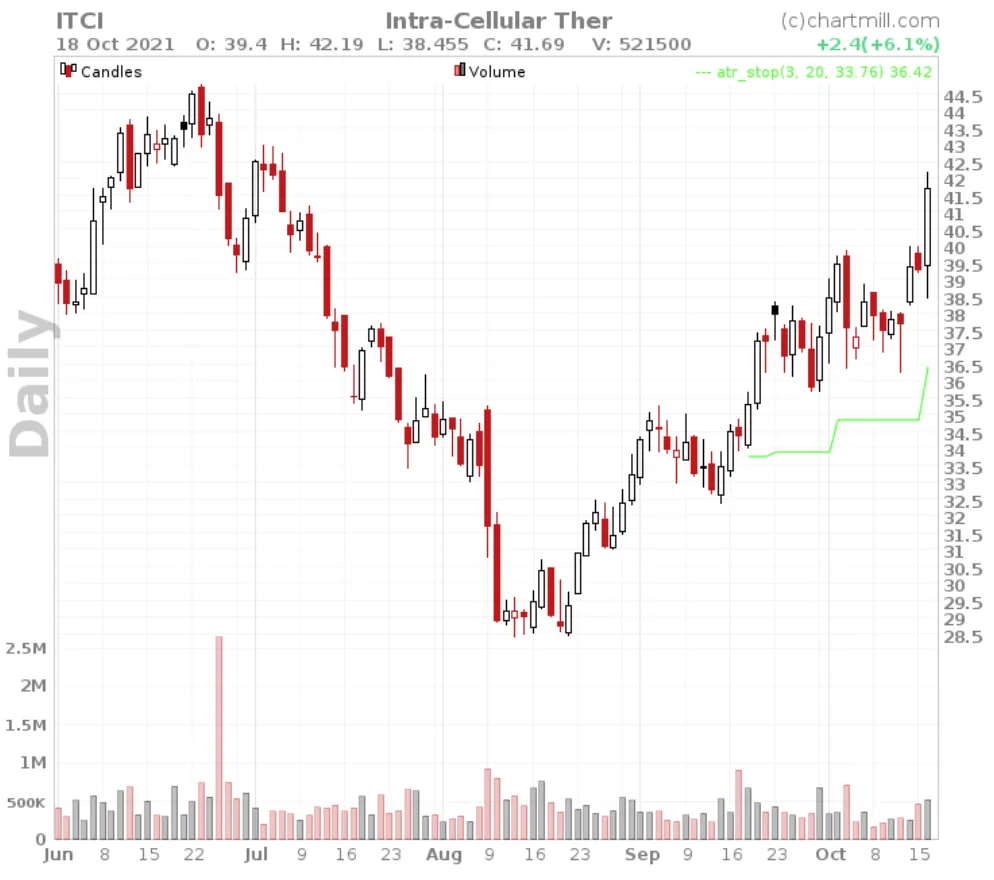
ChartMill allows you to place an ATR (Average True Range) stop directly in the chart as a reference. You can choose to use 3, 4, or even up to five times the ATR value as the stop-loss level. The stop is effective immediately once the price falls below that stop-loss line.
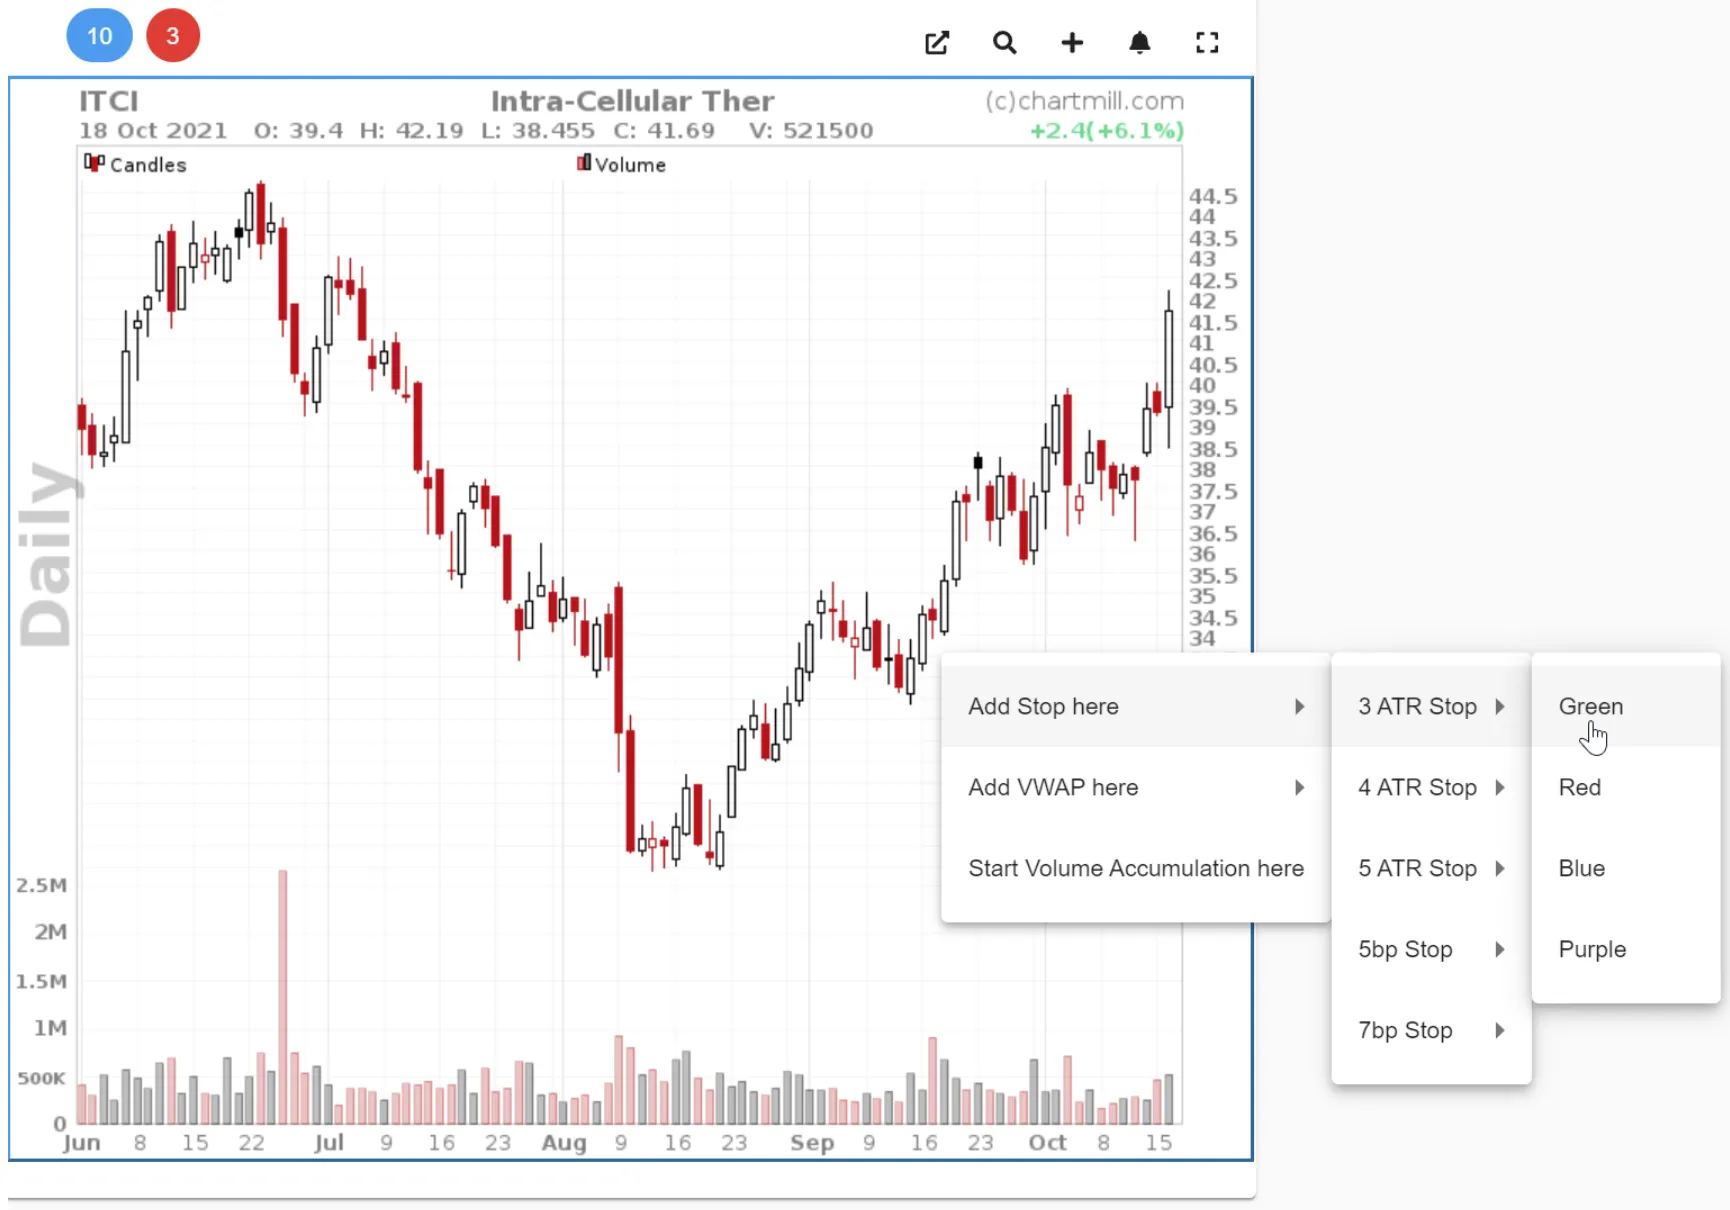
To set this ATR stop, place the cursor on the price level where you have set the initial stop-loss. Then right-click and the following menu appears. Select the 3, 4, or 5 ATR-stop and select a color. If these settings fail to appear on the chart, click once on the magnifying glass at the top right of the chart and then repeat the action.
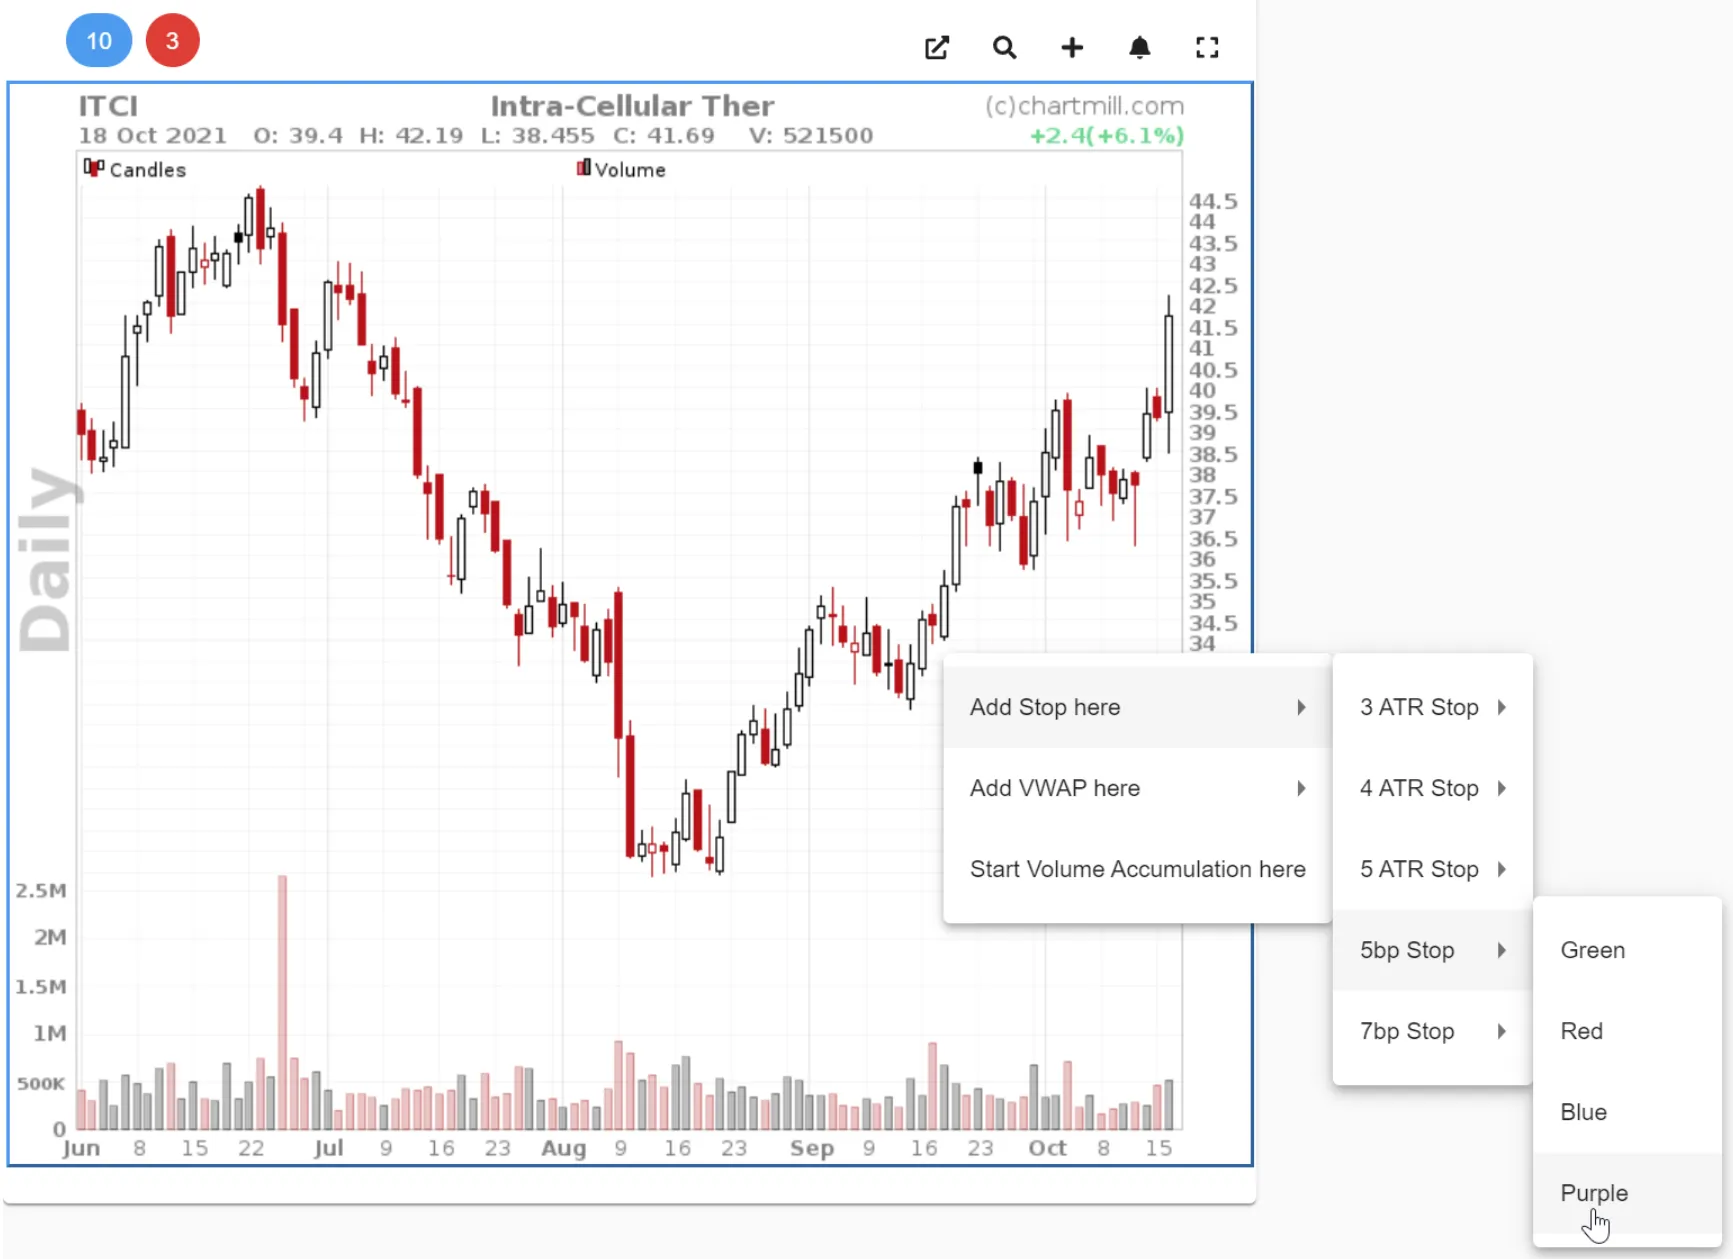
5 or 7 Price Bar Pattern Stop

The stop price is moved up or down every time a 5 or a 7-bar pattern is discovered.
To set this 5 or 7-bp stop, place the cursor on the price level where you have set the initial stop-loss. Then right-click and the following menu appears. Pick the appropriate stop-loss and preferred color.
How to screen for bullish and bearish flag patterns in ChartMill?
ChartMill offers the ability to automatically scan for the presence of bull and bear flags. To do so, go to the 'Stock Screener' page and select the 'Indicators' section from the menu. You can filter on both the daily and weekly charts by the bullish or bearish flag pattern. ChartMill even allows you to filter by the length of the pole and both the length and width of the flag itself.
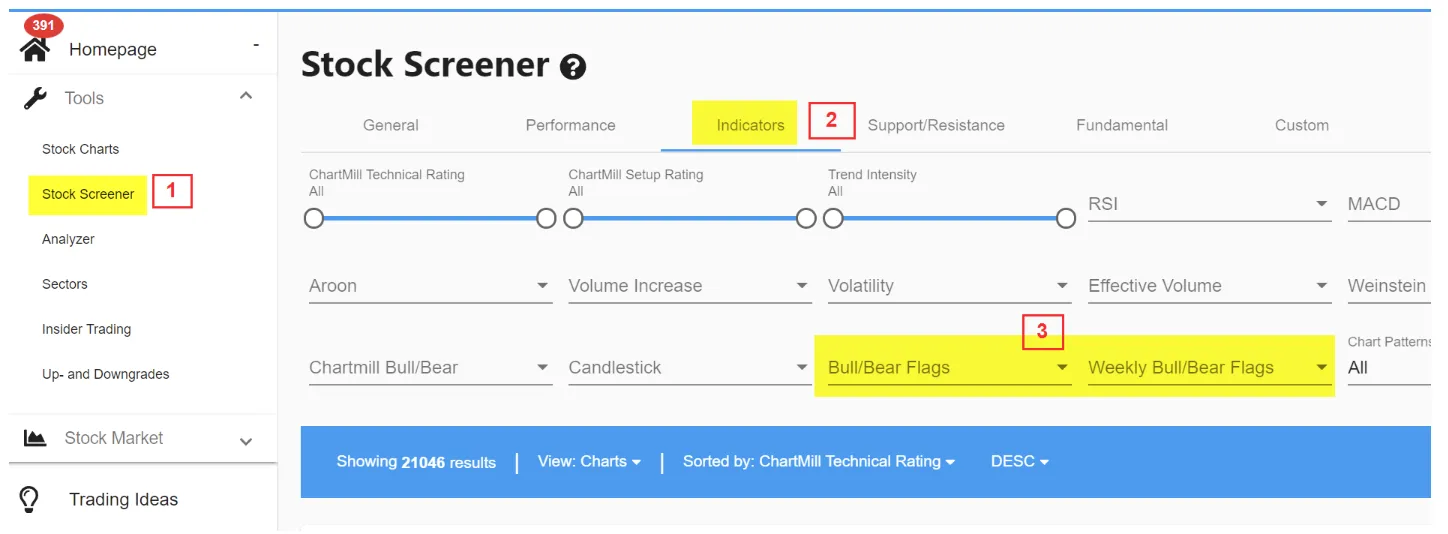
Keep in mind that these are automatically generated results and certainly not all of them are perfect. The screener provides an initial basic selection of stocks that exhibit characteristics of a bullish or bearish flag, but further manual selection by yourself is required to withhold only the best setups.
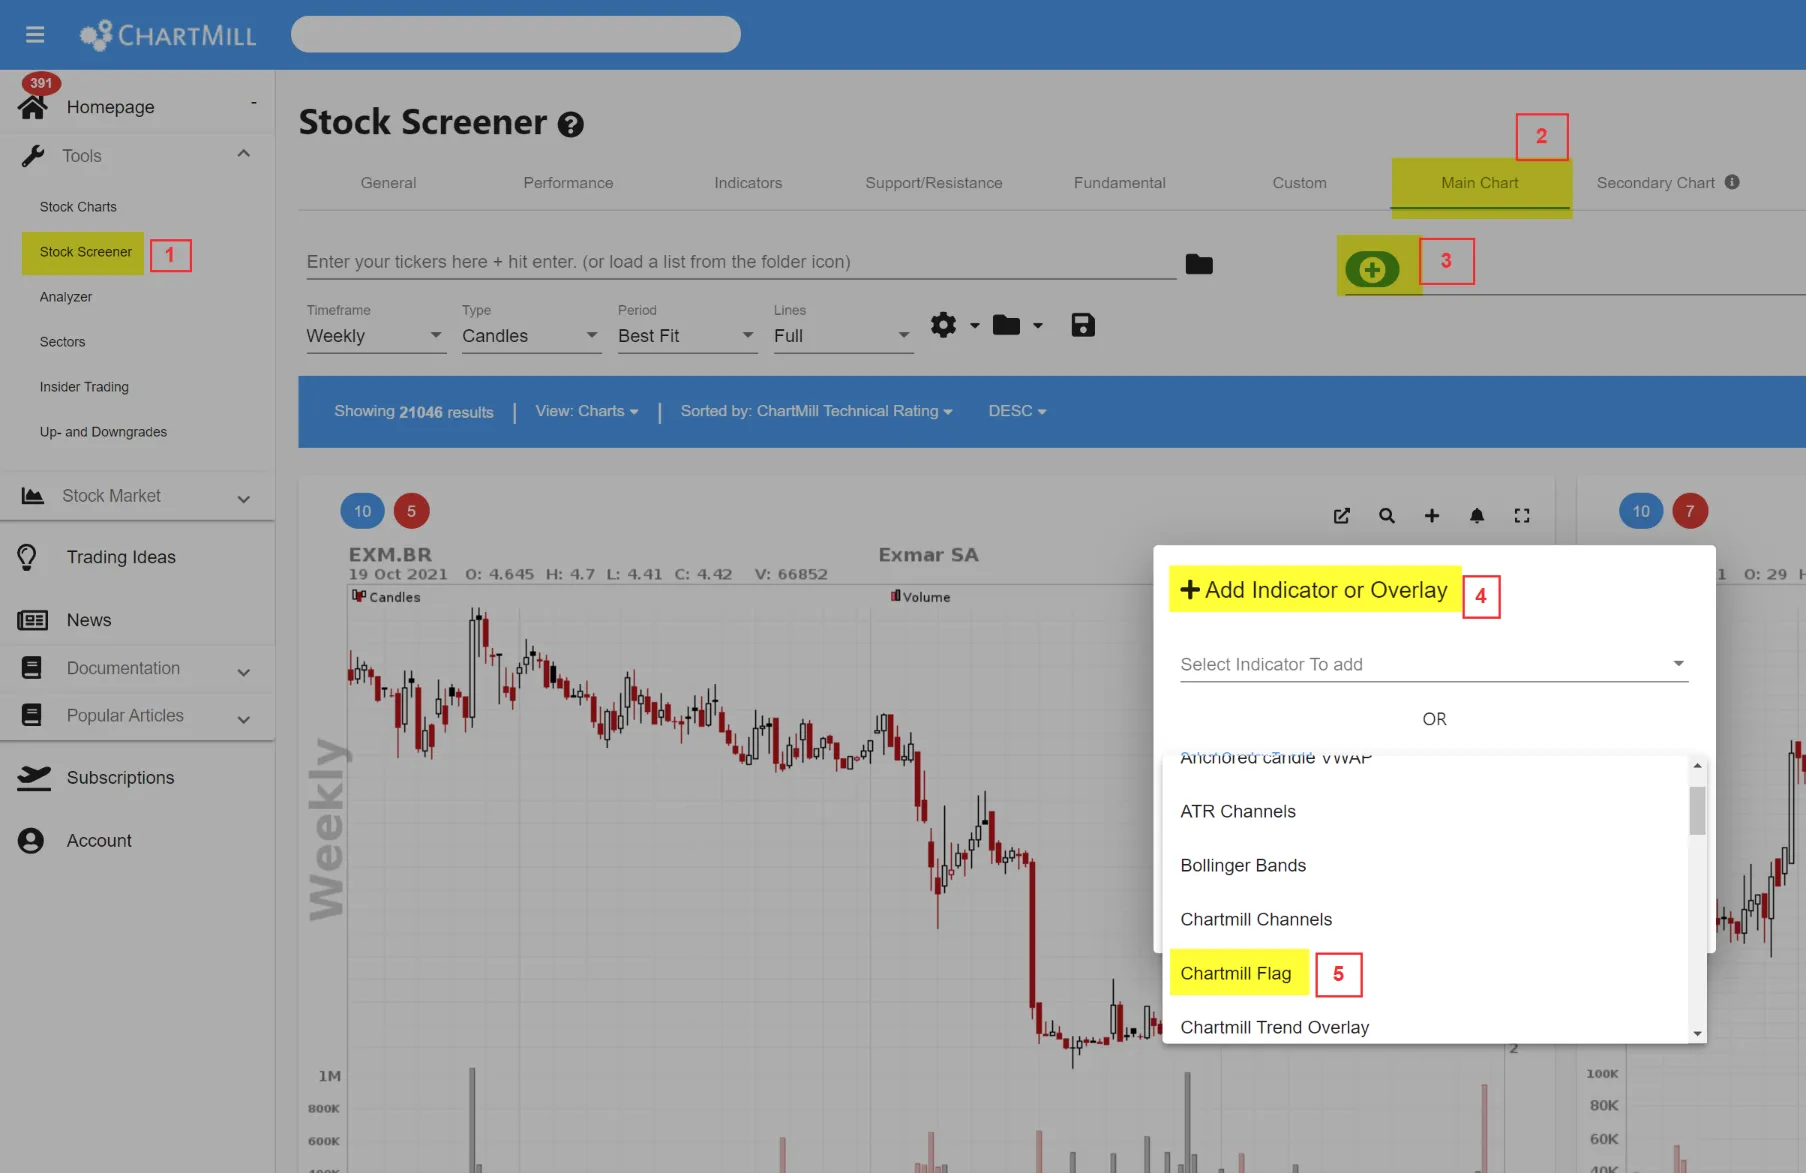
Don't forget to make the flag pattern visible on the charts as well. To do so, in the stock screener, select the 'Main Chart', click on the 'blue plus sign', and via 'Select Overlay To Ad' choose 'ChartMill Flag' from the drop-down menu.
The trading strategy in this article is based on a breakout from the Bullish Flag Pattern and can be applied to any timeframe. Whether it is a 5-minute intraday chart or a chart where each candle represents a full trading week, the principles remain the same. Just keep in mind that automatic screening for flag patterns is only possible on the daily and weekly charts.
This article has become quite long because I wanted to draw attention to some important aspects that are often overlooked when people talk about bearish or bullish flag patterns. You will come across these patterns quite often on all sorts of charts but if you follow the guidelines given in this article you will quickly realize that very few of these flag patterns meet all the conditions to be considered true low-risk setups.
It's not about quantity but about quality, as with many other things in daily life.
Final thoughts...
Flag patterns, like other technical patterns, are ideal tools to time your entry in the market. Merely recognizing the pattern on a chart however, is not a free ticket to open positions blindly. As has been shown in this post, numerous other elements must be considered to be retained as a valid pattern.
ChartMill offers the possibility to have the software screen for bull or bear flag patterns daily. So you don't have to waste time manually searching for setups. Select the best low-risk setups from the list provided by ChartMill (based on the points explained in this article) and make sure your entry- stop-loss- and position management are on point!
Related Articles
Bull Flag Chart Pattern Explained
A bull flag chart pattern is a continuation pattern within the field of technical analysis. Read more...
Related Videos
How To Trade the Bullish Flag Pattern?
In depth video on the bullish flag pattern. Watch the video...
Related Trading Idea
Bull Flags Predefined Screen
Check the trading idea here...