
Exploring The Best Moving Averages For Swing Trading Success
In the fast-paced world of financial markets, swing trading has emerged as a popular strategy among traders seeking to profit from short to medium-term price movements.
This type of trading relies heavily on technical analysis, traders employ various tools and indicators to make decisions regarding entry and exit points. One such tool that plays a crucial role in swing trading is the moving average.
Understanding Moving Averages
The Definition and Purpose of Moving Averages
Moving averages form the backbone of technical analysis in financial markets. In essence, a moving average is a statistical calculation that smooths out price data over a specific period. It helps traders identify trends, confirm reversals, and provide crucial support and resistance levels.
By reducing market noise, moving averages enable swing traders to better understand the underlying price dynamics. The primary purpose of a moving average is to reveal the underlying trend direction by filtering out short-term fluctuations in price.
By doing so, it eliminates much of the inherent volatility present in financial markets. Whether an uptrend or downtrend prevails, moving averages help traders identify these trends and adjust their strategy accordingly.
Types of Moving Averages: Simple, Exponential, Smoothed
There are three main types of moving averages commonly used in swing trading: simple moving average (SMA), exponential moving average (EMA), and Smoothed moving average (SMMA). Each type has its own calculation method and characteristics that suit different trading styles.
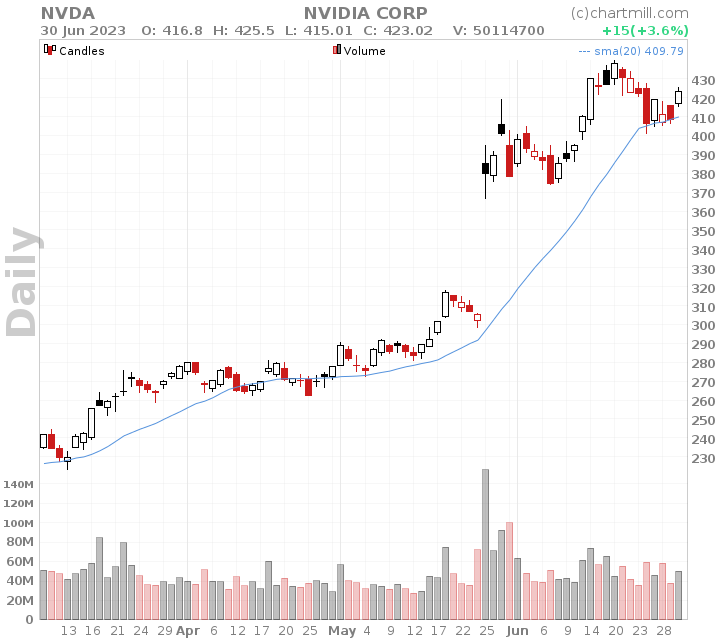
The simple moving average (SMA) calculates the mean price over a defined period by summing up the closing prices and dividing them by the number of periods considered.
This type of moving average provides equal weightage to all data points within the chosen period.
In contrast, the exponential moving average (EMA) assigns more weight to recent data points while diminishing older ones exponentially.

This gives EMA a higher level of responsiveness to recent price movements than SMA does.
Consequently, EMA tends to be more popular among swing traders who prioritize current market conditions over historical data.
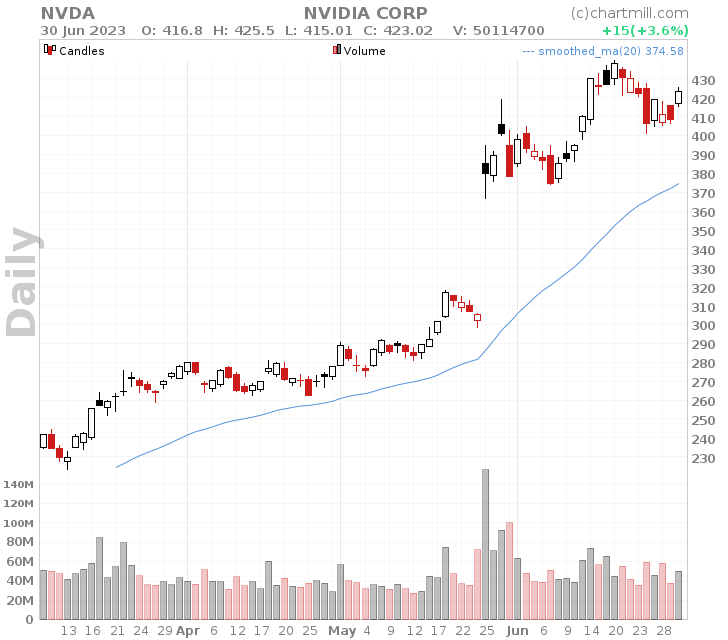
The Smoothed Moving Average (SMMA) is a combination of an SMA and an EMA.
It gives the recent prices an equal weighting as the historic prices as it takes all available price data into account.
Why Use Moving Averages in Swing Trading?
Moving averages (MAs) are widely regarded as one of the most essential tools in swing trading due to their ability to smooth out noise and identify trends more easily.
Support and Resistance
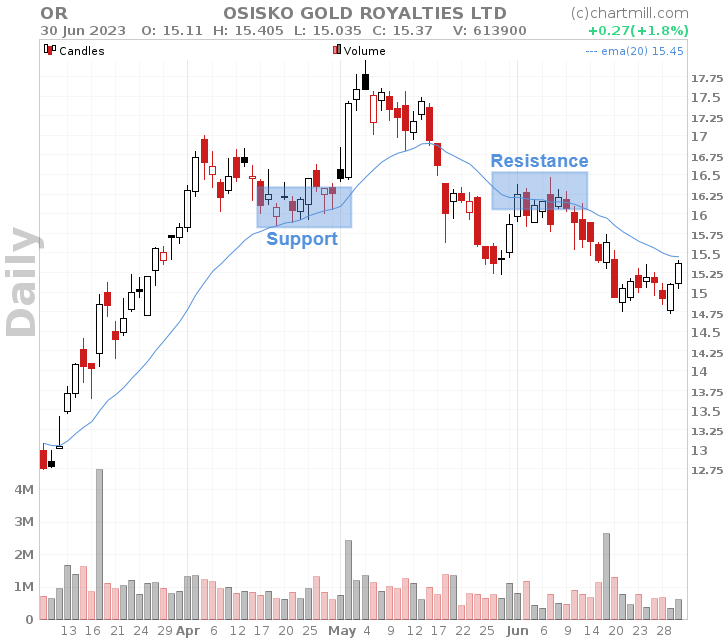
MAs act as dynamic support or resistance levels when prices approach them.
If an asset's price bounces off the MA consistently over multiple periods, it indicates that the MA is acting as a reliable support or resistance level.
Confirming Entry and Exit Points
Precisely because MAs can act as support and resistance, they can be perfectly used to confirm entry and exit points.
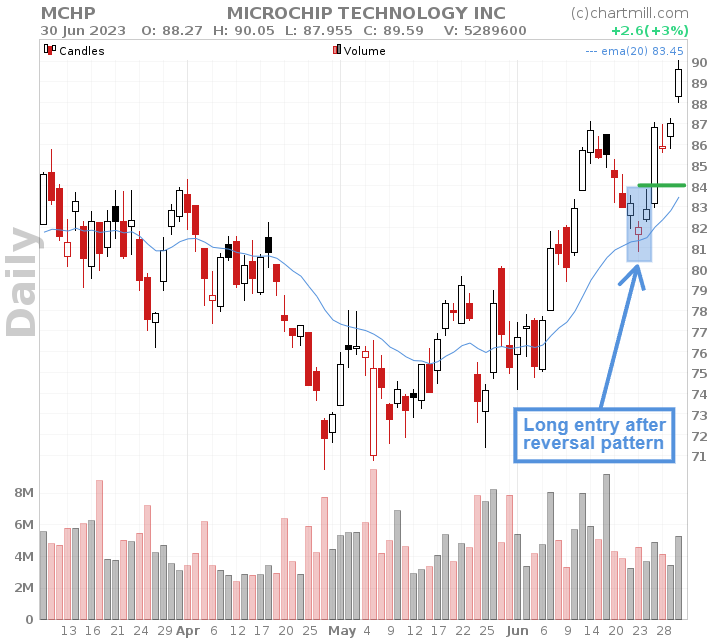
Once you identify a potential trend reversal, you can wait for the price to pull back and touch the moving average before entering a trade.
This can help confirm that the trend is indeed changing.
Similarly, when the price starts to move against your position and crosses back below the moving average, it may signal an exit point to protect your profits or limit your losses.
Identifying Trend Reversals
Moreover, MAs help swing traders identify trend reversals. When the price crosses above a certain MA, it suggests a bullish trend, indicating that the price might continue upward.
Conversely, when the price falls below that same long-term MA, it signifies a bearish signal and suggests that the trend may continue downward.
An alternative way to spot "trend reversals" is to use two MAs. A short MA and a longer MA. When the short MA crosses the longer MA upward it is a bullish signal. In the case of a downward cross, one gets a bearish signal.
Choosing the Best Moving Averages for Swing Trading
Short-term vs Long-term Moving Averages
When selecting the most suitable moving averages for swing trading, it is essential to weigh the pros and cons of both short-term and long-term moving averages.
Short-term moving averages, typically calculated over 5 to 20 days, are highly responsive to price changes.
The 5-day EMA effectively captures short-term trends and momentum shifts.
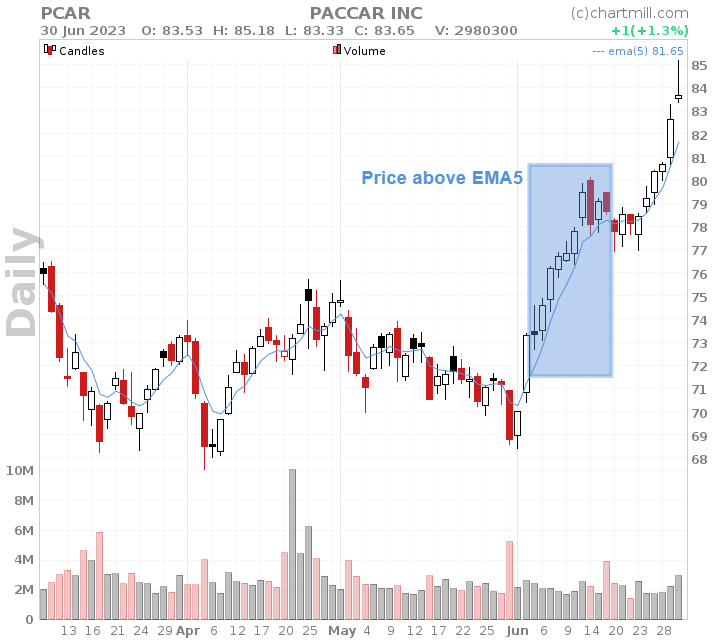
This moving average shines in markets characterized by sharp price movements or during breakouts where quick entries and exits are paramount.
However, it may generate more false signals during periods of consolidation or low volatility when price action lacks direction.
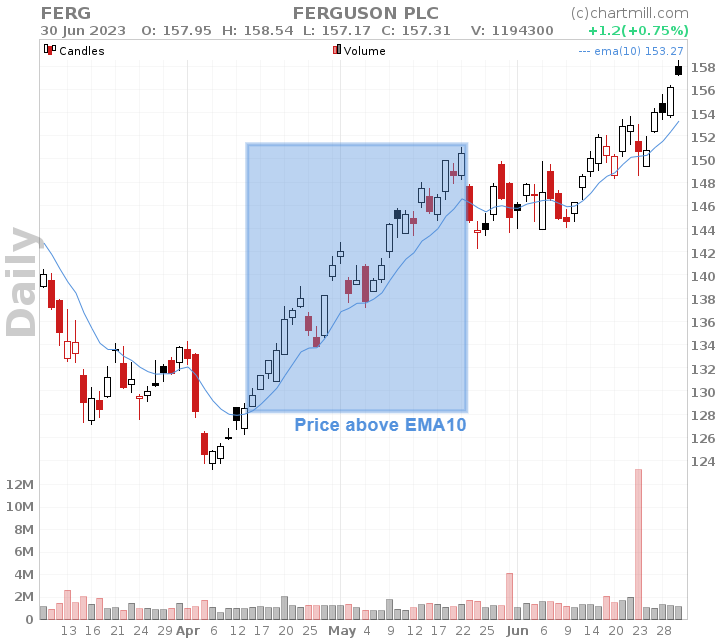
The 10-day EMA proves particularly effective in trending markets where sustained movements persist over several days or weeks.
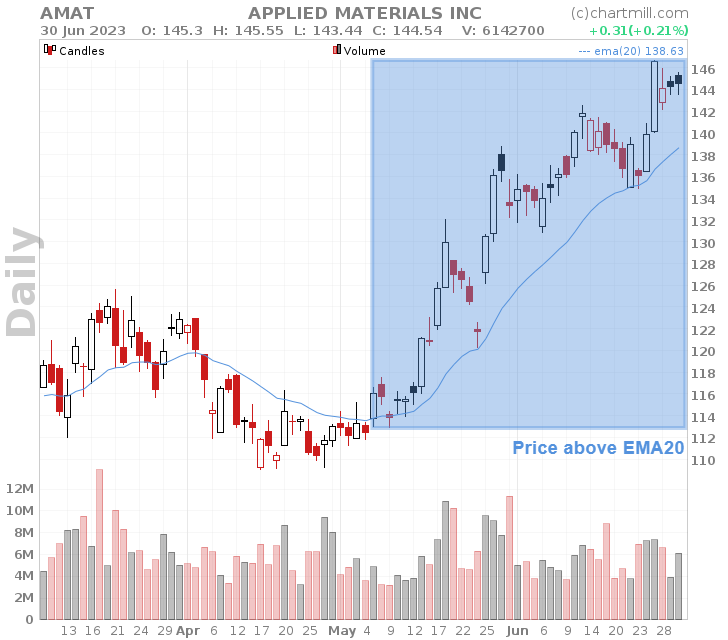
The 20-day EMA provides more reliable signals when prices exhibit medium-term trends without compromising too much on noise reduction.
For these short-term MAs, it is better to opt for the EMA variant because it gives more weight to the most recent price trend.
Their ability to quickly adapt to market fluctuations allows traders to capture immediate trends and make timely decisions. However, their sensitivity can also lead to false signals during periods of high volatility or choppy market conditions.
On the other hand, long-term moving averages, calculated over 50 to 200 days, offer a broader perspective on price trends. They smooth out short-term fluctuations and provide a clearer picture of the overall market direction.
This makes them particularly useful for identifying long-lasting trends and filtering out noise in the data. Nevertheless, due to their longer calculation period, long-term moving averages may lag behind price movements and might not be as effective in capturing short-lived market reversals.
Combining Short and Long-term MAs for the Most Reliable Results.
Combining short-term and long-term MAs is the most efficient way to use these in a swing trading strategy.
The combination of the 20, 50, and 200SMA is best known among swing traders.
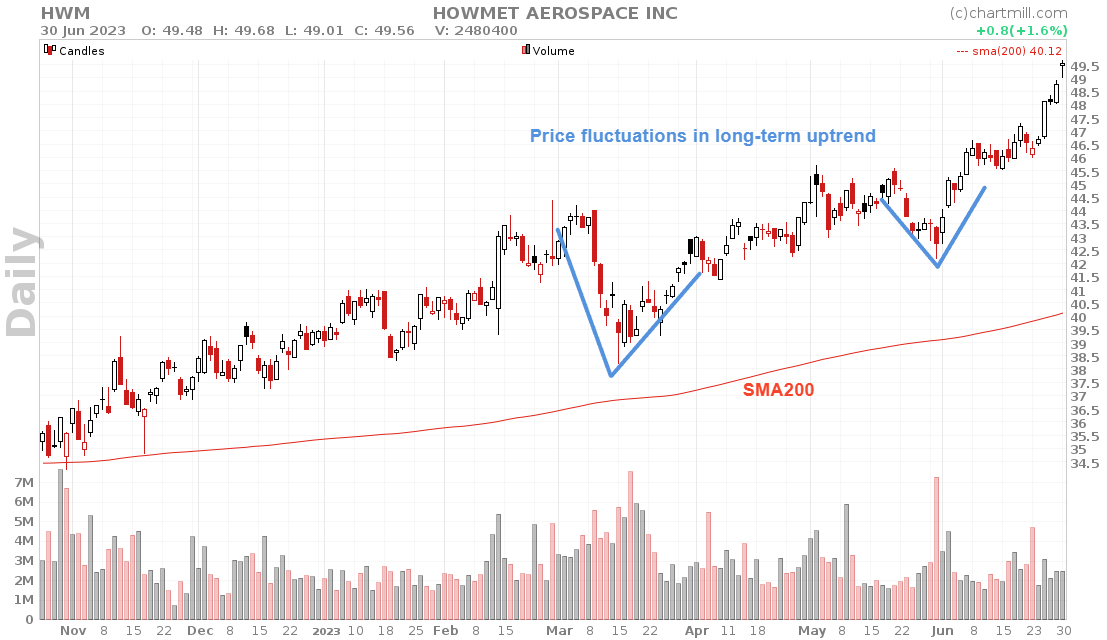
Identify The Main Trend Direction
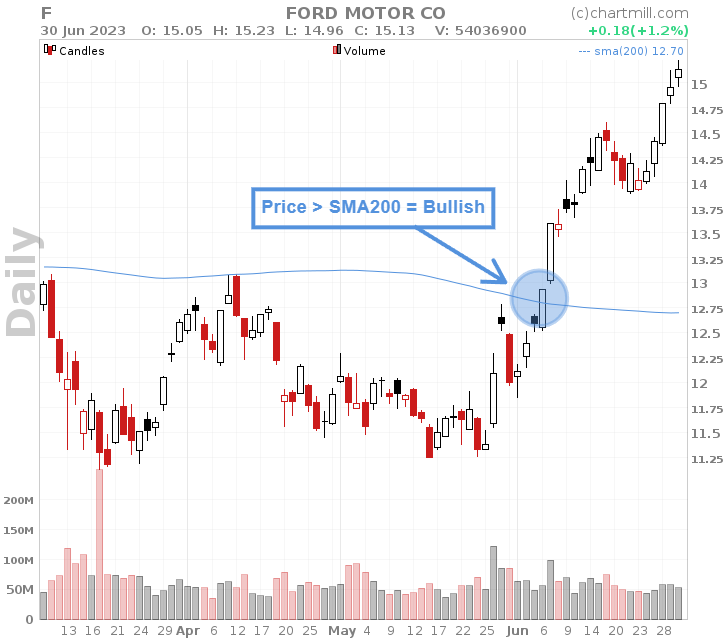
The long-term MA serves to identify the general trend. A popular long-term MA for this purpose is the SMA200. Thus, the trend is positive when:
- the SMA200 is bullish
- the price is above the SMA200
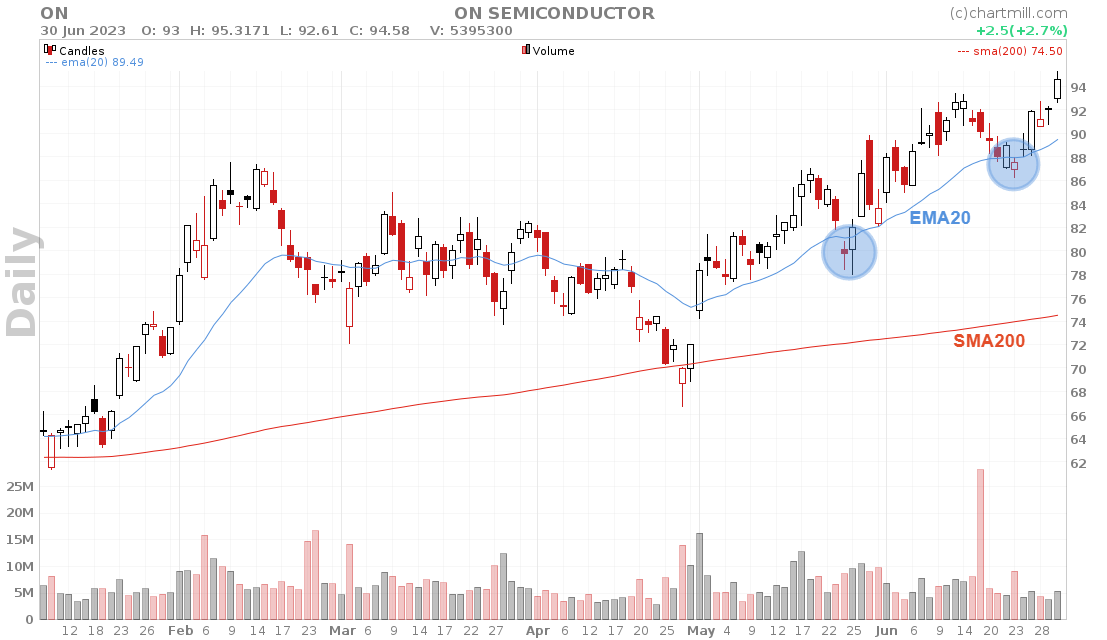
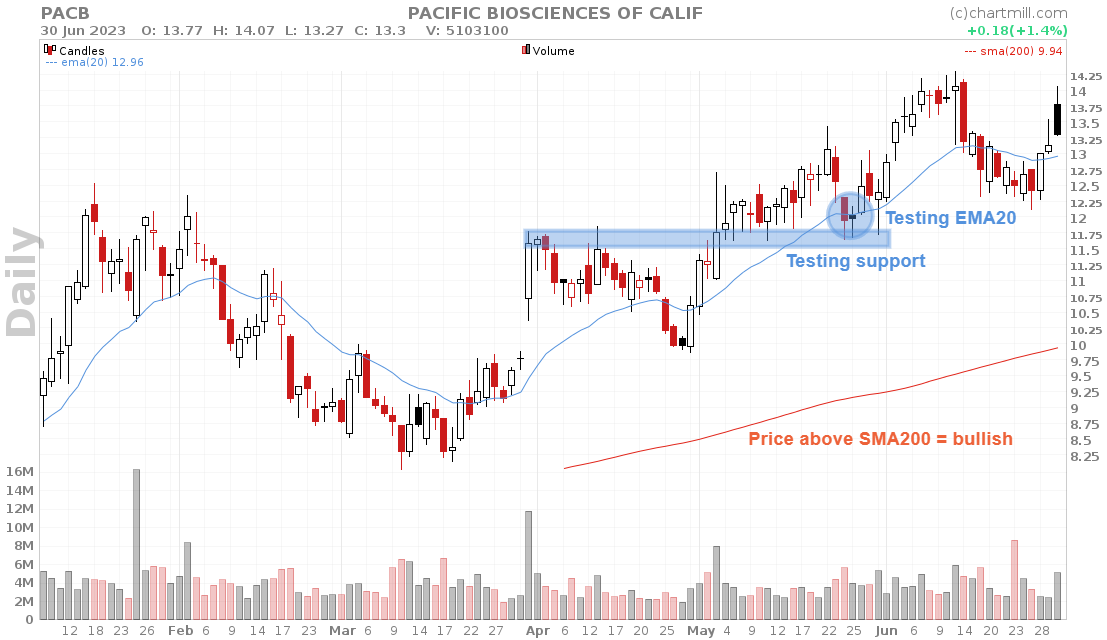
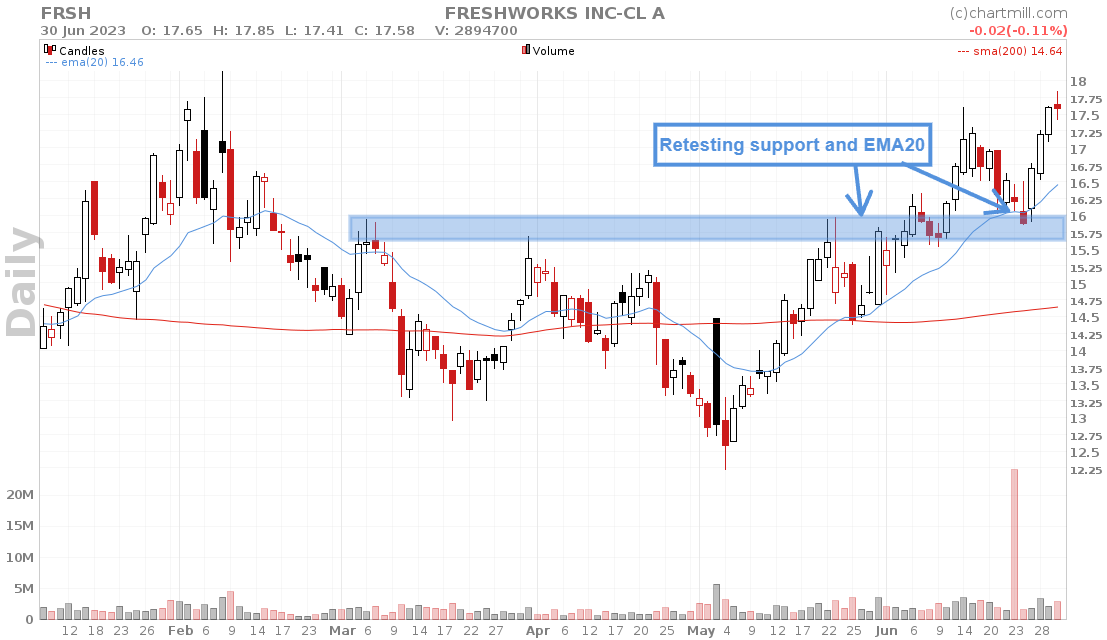
Looking for trading opportunities
Once you’ve established the main trend, a shorter SMA20 or SMA50 can be used for entry. As soon as the price tests one of these shorter SMA, look for opportunities to go long.
Some examples of such setups can be found below:
Some Final Tips
Considering Using Multiple Timeframes: To increase the reliability of your swing trading signals, consider using moving averages on multiple timeframes.
For example, if you are swing trading on a daily chart, you can look at moving averages on the weekly or hourly charts to get a broader perspective of the longer-term trend and confirm the signals you receive.
Remember that moving averages are lagging indicators, meaning they reflect past price data. They are best used in conjunction with other technical analysis tools and should not be relied upon as standalone indicators.
Additionally, it's important to practice proper risk management and have a well-defined trading plan when using any trading strategy, including swing trading with moving averages.
More on Moving Averages...
The Simple Moving Average
The SMA is the most basic type and simply calculates the average price of a set of prices over a period of time. Read More...
The Exponential Moving Average
The EMA, the exponential moving average, gives more weight to recent prices than a simple moving average. Read More...
The Smoothed Moving Average
The Smoothed Moving Average (SMMA) is a combination of an SMA and an EMA. Read More...
How To Use Moving Averages To Determine The Trend?
Moving averages can be used in many ways in different types of trading strategies.. Perhaps one of the best known and easiest way is to determine the trend using a specific moving average. Read More...
Best Indicators For Swing Trading Stocks | Enhance Your Swing Trading Setups.
To enhance your swing trading strategy, incorporating effective indicators and patterns can provide valuable insights and increase your chances of success. Read More...
Moving Average Pullbacks (TRADING IDEA)?
A screen for stocks in a rising trend whose price has recently fallen slightly. These retracements can be used to take long positions in that specific stock. Read More...
How To Scan For Moving Averages Pullbacks (VIDEO)?
In this video I'll show how you can use different MOVING AVERAGE filters to screen for stocks in a rising trend whose price has recently fallen slightly. Watch the video.
Screening Options For a Retracement Strategy Based On Moving Averages (VIDEO)
In this video i'll go over some price retracement trading screens using the 20, 50 and 200 simple moving averages. Watch the video.
Stock Market Golden Cross
This represents a critical technical analysis pattern that occurs when two essential moving averages converge, signifying a potential shift in the market's direction. Read more...
Death Cross Stocks Chart Pattern
The death cross is a pattern that forms when the short-term price average falls below the long-term price average. Read more...