The Bearish Engulfing Pattern | Definition
A Bearish Engulfing Pattern is a Candlestick Pattern and occurs when a positive candle with a relatively small body is followed by a negative candle with a larger body. It is important that the body of the second candle fully encompasses the body of the first candle. Ideally, the second candle has no or only a very small wick at the bottom. This combination tells us a number of things:
- The opening price of the second candle was higher than the closing price of the first candle, so the day starts with a gap up and buyers are in control.
- During the trading session, however, we see that sellers get the upper hand and push the price down with a closing price that ends negatively.
- The shorter the lower wick of the second candle, the shorter the closing price at the lowest price of that day, an even stronger signal that sellers really have the upper hand.
Just like its bullish counterpart, the Bearish Engulfing Pattern is a reversal pattern. It is an indication that the current existing upward short-term or long-term trend is coming to an end and a negative trend reversal is imminent.
Other reversal patterns include the dark cloud cover and bearish harami pattern.
Example
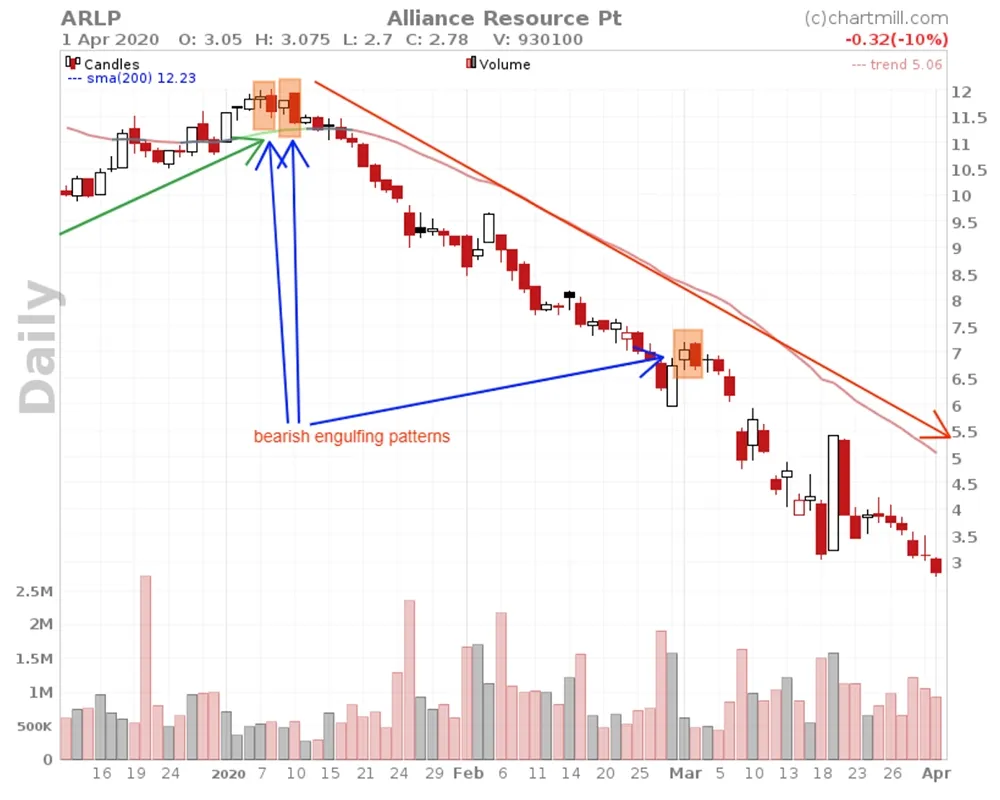
Until the end of 2020, the short-term trend of Alliance Resource (ARLP) is rising. It is important to note that at that time the long-term trend is still declining, with a share price below the 200-day simple moving average. After 1 January, two consecutive bearish engulfing patterns suddenly appear. In the following months, price drops from $12 to a low of just $2.7. At the beginning of march - after two consecutive ascent days - a third bearish engulfing pattern formed (which was another great opportunity to get on board if you had missed the first setups).