The Bullish Hammer Candlestick Pattern | Definition
Intro
The Bullish Hammer Candlestick Pattern mainly proves its usefulness in active swing trading strategies in which the pattern is used as a warning signal that an existing bearish trend might be reversing.
By combining this pattern with other candlesticks before and after the bullish hammer itself, even real reversal signals arise, consisting of several consecutive candlesticks, which benefits the reliability of the signal.
In this article
- What is a Bullish Hammer Candlestick Pattern?
- Interpretation of the hammer candle
- Using the pattern in a real trade setup
- Finding bullish hammer candlesticks with a stock screener
- Key elements to remember
- Frequently Asked Questions (FAQ)
What is a Bullish Hammer Candlestick Pattern?
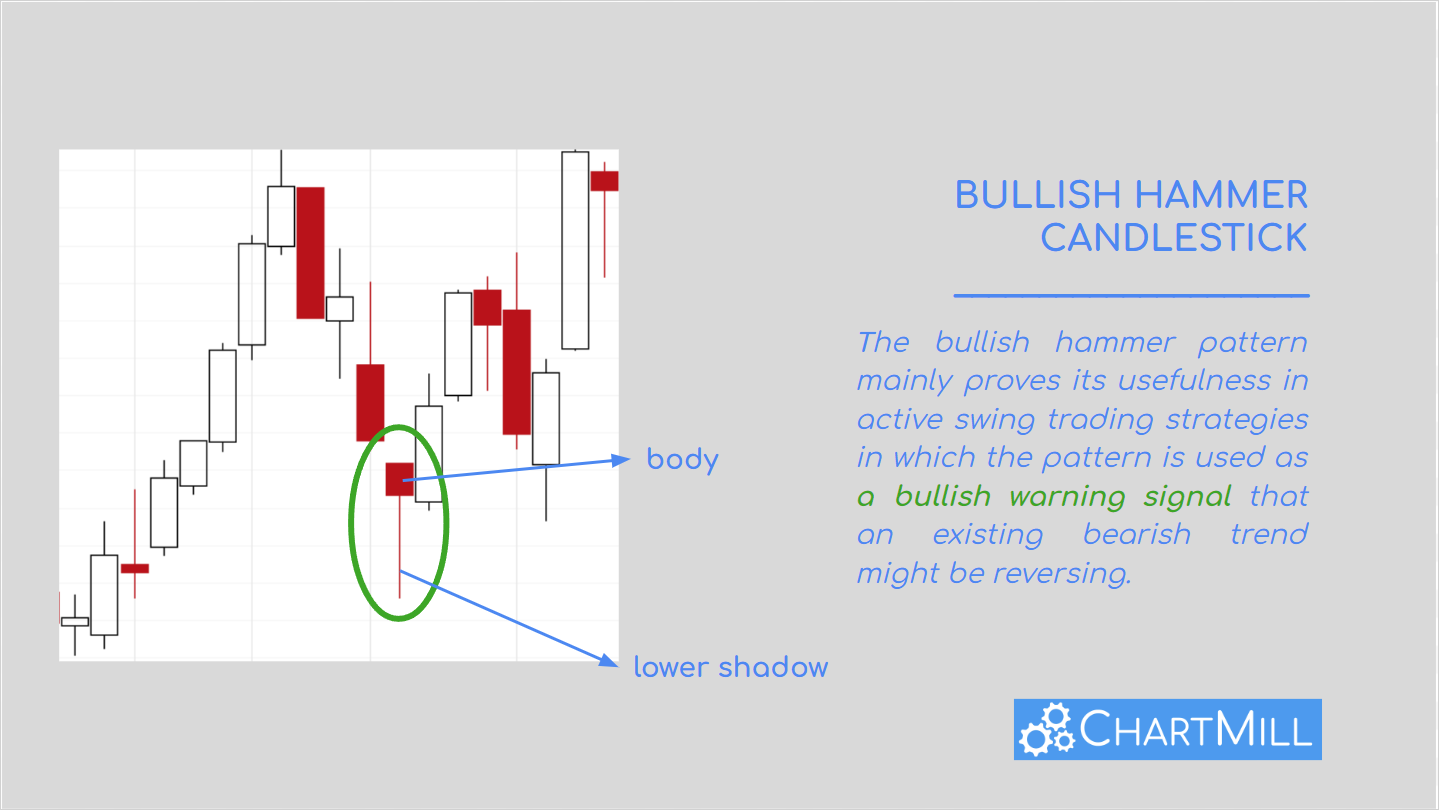
The hammer pattern consists of a small body (color is less important). However, a typical feature is the long shadow at the bottom which is at least twice the size of the actual body. To qualify as a real hammer pattern there should be no top shadow. In common practice, however, patterns with a very small uppershadow are also considered hammer patterns.
Interpretation of the hammer candle
The Bullish Hammer as an early warning signal
If we start from the daily timeframe, the formation of the candle can be described as follows:
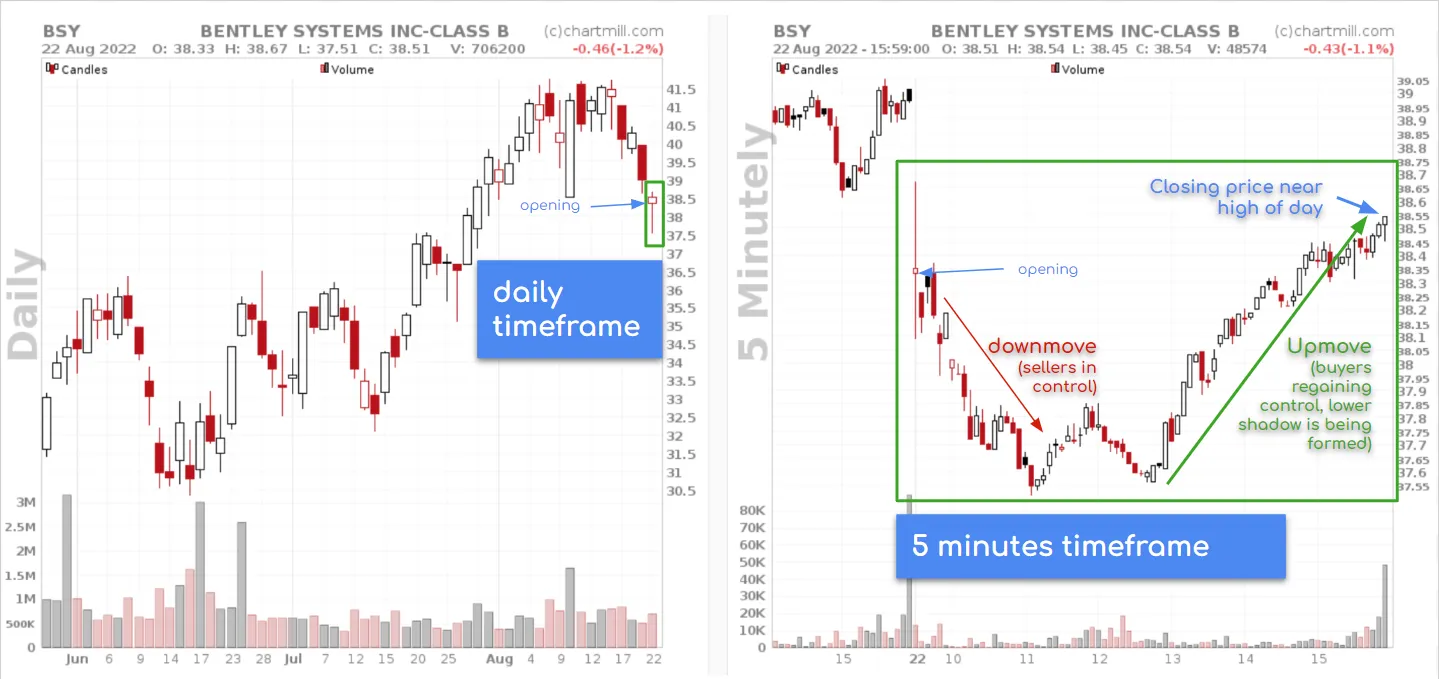
- At the start of the trading day, there is a sharp decline and sellers have the upper hand. Initially, we see the formation of a red bearish candle as a result.
- At some point, however, buyers enter the market and push the price up again, creating the typical under-shadow.
- The closing price ends up being relatively close to or above the opening price. The fact that buyers were able to completely wipe out the initial decline is an indication that the downward momentum is losing strength, which can be interpreted as a harbinger of a trend reversal.
Attention: This assumption is based on only one candle, which makes its trustworthiness low. That's why we should at most consider the candle itself as an early warning signal if it occurs after a confirmed downtrend.
The Bullish Hammer candlestick formation as part of a reversal pattern
Depending on the type of candles visible before and after the bullish hammer, there could be a real reversal pattern. The first requirement for this is that the bullish hammer occurs after a clear price drop. An example of this can be seen in the chart below where the bullish hammer only became visible after a price retracement in an ongoing uptrend.
The candle which follows the bullish hammer serves as a confirmation signal. Below you can see how this candle should look like in the most ideal circumstances; a long white candle which means that after the opening of the market the price immediately rose strongly and finally could close just below or even at the high of day. This is a confirmation of the earlier buyer's momentum of the day before, when the bullish hammer was formed.
This combination of candlesticks with the bullish hammer in the middle is a strong reversal pattern. Especially when this pattern is visible on a significant support level it offers opportunities to enter the market with relatively little risk and to speculate on a trend change.
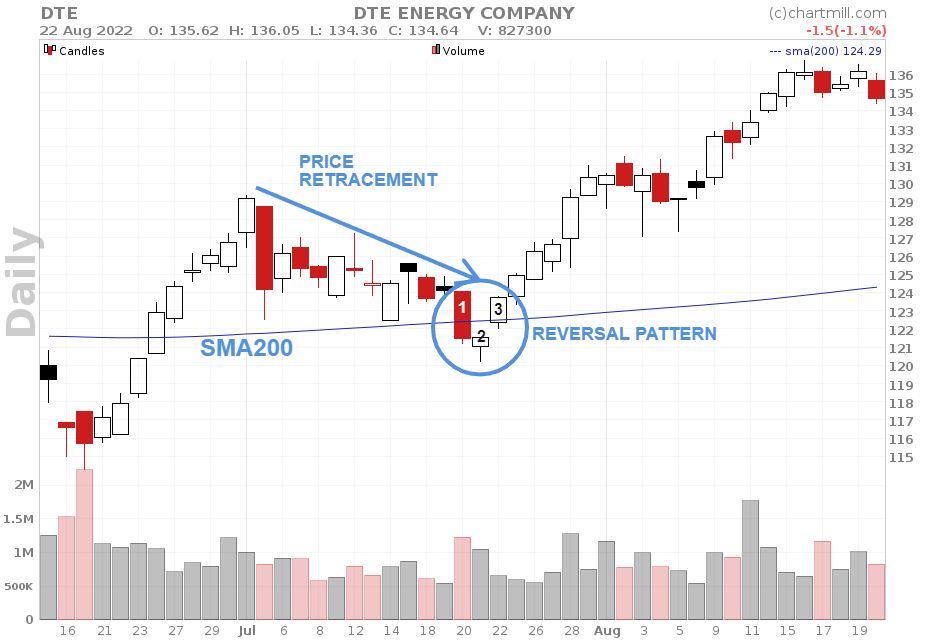
DTE Energy Company stock with a full bullish hammer reversal pattern occurring on the SMA200 in the second half of July 2022 after an earlier price retracement.
- Red day where the close was below the SMA200.
- Bullish hammer candle, buyers re-enter the market (warning) and a closing price at the high of day.
- Up day closing very tight to the high of day and again above the SMA200 (confirmation).
Using the pattern in a real trade setup
We will use the same chart to demonstrate how to open a position based on such a pattern.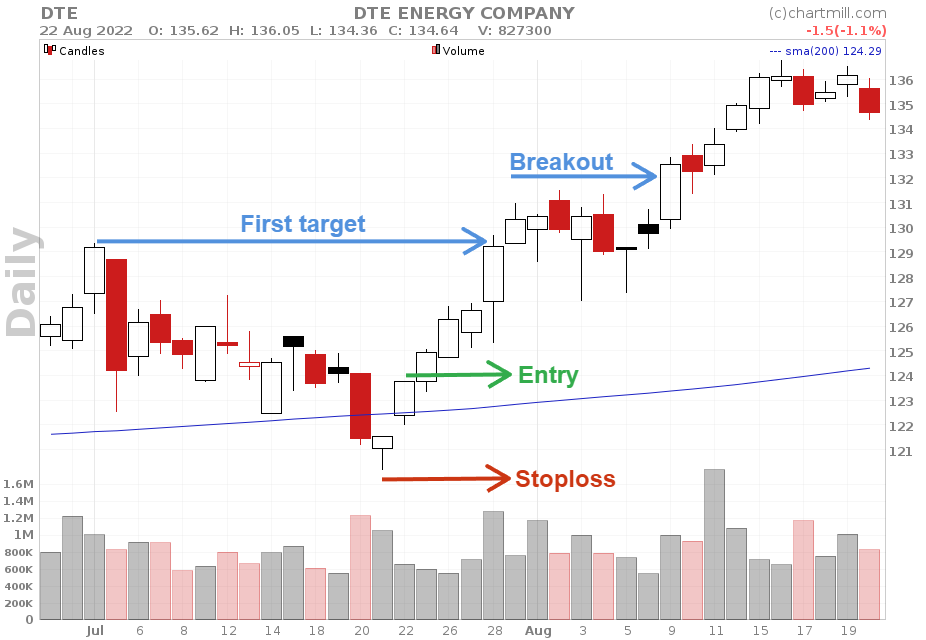
First step: Buying after the confirmation candle
It is very important to wait until the bullish hammer candle is confirmed by a third bullish candle. It is tempting to open a position immediately after the bullish hammer but the reliability of that candle alone is too low. Especially with a stoploss just below the candle you'll be stopped out in many cases.
Place your order only after the market has closed. Use a stop order by which you determine that you want to buy the share the next day as soon as the price goes a few ticks higher than the high of the last candle (candle 3 in the previous chart).
Second step: Protecting your position with a stop loss
In case you still have doubts, protecting your trading capital should always be your main concern! A hard stop loss is the best way to protect yourself if the position does go the wrong way.
Place the stoploss below the most recent swing low. Indeed, as soon as the price falls below this level the setup is no longer valid and the position must be closed. Make sure you put the stoploss at least a few ticks below the recent low. In some cases a double bottom will be formed first. A few ticks can then sometimes be just enough to avoid being stopped out...
Third step: Trade management
As soon as the position moves in the desired direction you need to determine where and when you are going to sell the position. There are various ways of doing this but it is always advisable to take into account the price levels which you know could be potential resistance.
In this way we have determined the first target for this position. If the first target is reached there are several options available, raising the stop loss to the breakeven level is one of them. This will at least give you the certainty that this position will no longer cause you any losses.
If you choose to manage the position in several parts, you can sell a small part of it and hold on to the rest with the intention to profit from a possible bigger trend movement. In the example above you notice that there was indeed price collusion at the first target level. Once the price broke out upwards the stop loss for the remaining position can be placed below that sideways range. By doing so you've secured a profit for the remaining part of your position.
Another example on the weekly chart
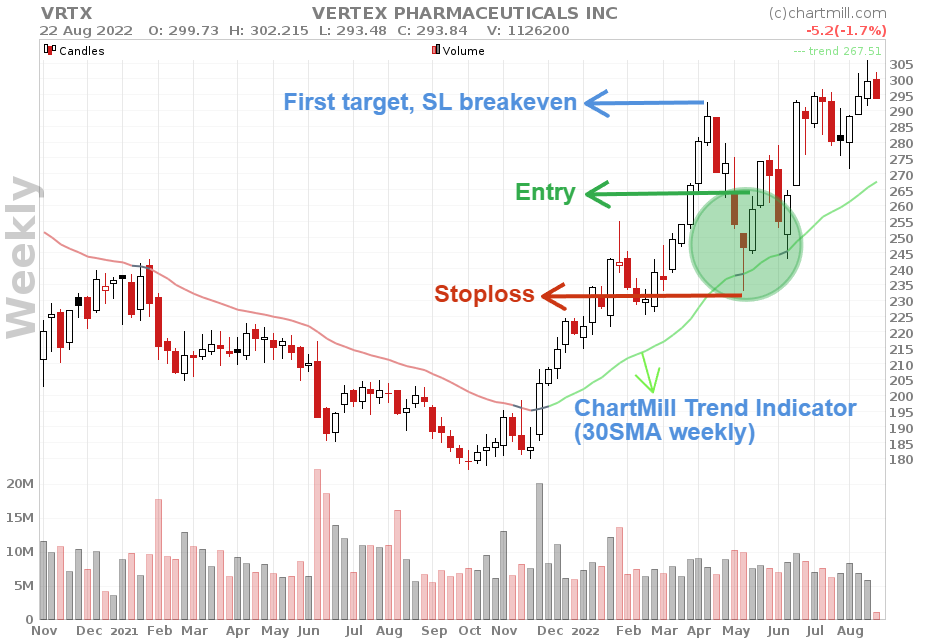
Vertex Pharmaceuticals - The overall long term trend was clearly bullish since the beginning of 2022. After a clean price retracement between april and the first week of may, the ChartMill Trend Indicator served as support and a bullish hammer reversal pattern was formed.
Finding bullish hammer candlesticks with a stock screener
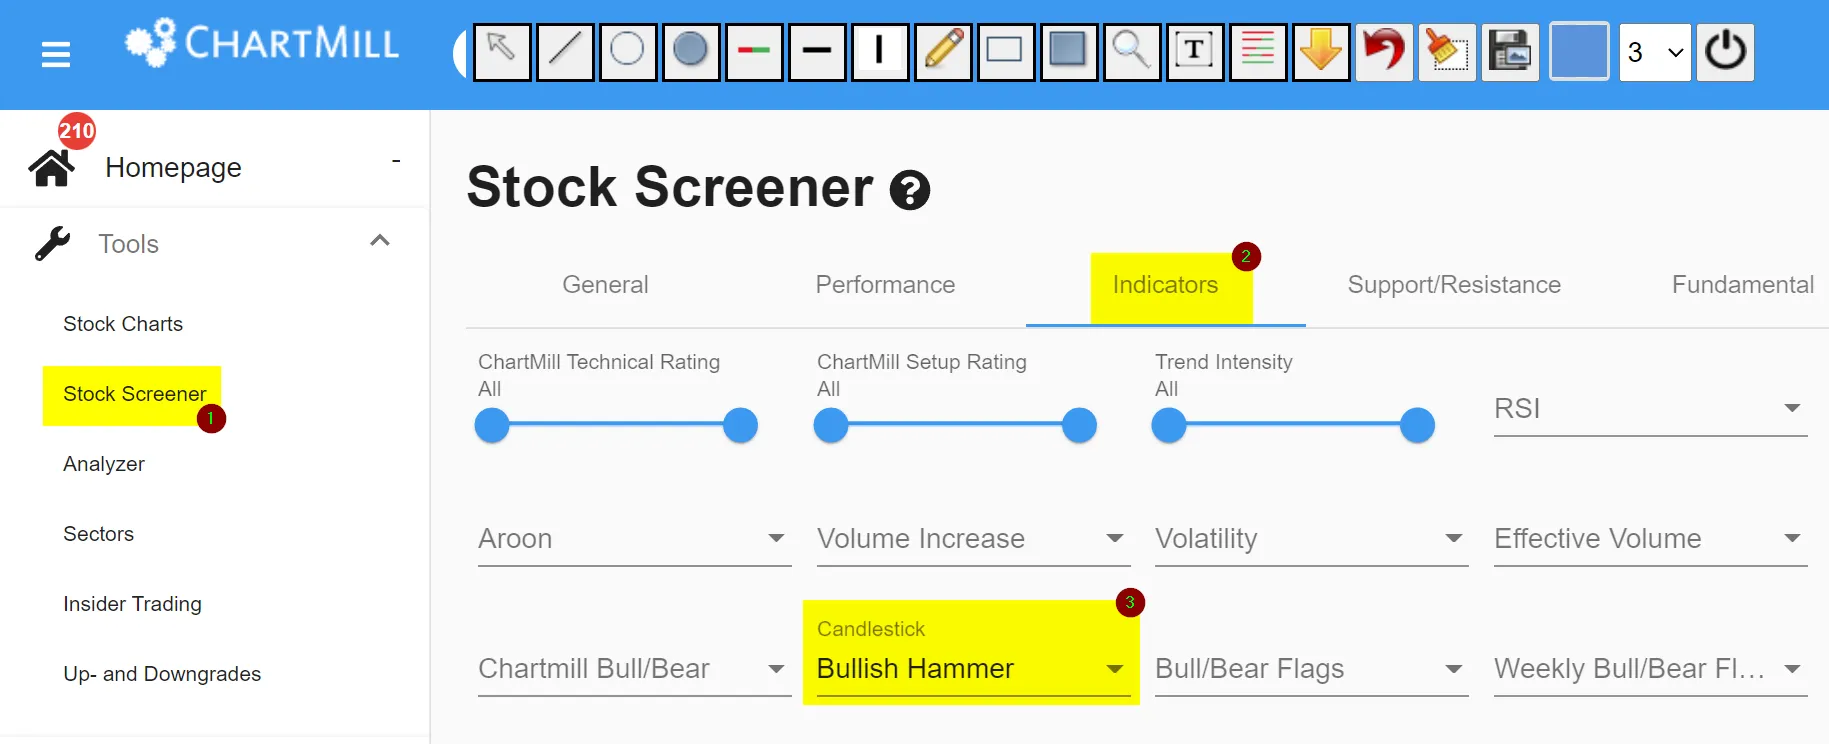
Bullish hammer candlestick patterns occur frequently on the chart but to find the patterns that meet some basic criteria it is best to use a stock screener like ChartMill.
This allows you to work much faster and more efficiently and not waste time manually searching through numerous charts.
The candlestick filter can be found on the stock screener page under the menu 'indicators'. Open the 'candlesticks' section and select the bullish hammer pattern from the drop down menu.
For this pattern, a predefined trading screen already exists in our trading ideas section. You can use this filter directly or supplement it with your own specific filters.
From this basic list you can then make a manual selection. A possible option is, for example, to check whether this first list also contains shares of sectors that are currently performing strongly. If so, you can focus on those specific companies.
Key elements to remember
- This specific candlestick must be preceded by a downtrend or at least a temporary price decline in a long-term uptrend to be recognized as a bullish hammer.
- As such, it is an early warning signal that an existing downtrend may be losing momentum.
- The candlestick itself is not sufficiently reliable to open a position against the prevailing trend. Always wait for confirmation of a third bullish candle and also take into account other elements on the chart that further strengthen the signal (double bottom, retracement on moving average,...).
Frequently Asked Questions (FAQ)
Can the Bullish Hammer candlestick pattern be used on other timeframes?
Yes, the candle can be observed on all types of time frames, daily, weekly or monthly charts, as well as intraday charts (hours, minutes,...). Just keep in mind that in general the reversal signal will be more reliable on larger time frames.
What’s the difference between a bullish hammer and a hanging man candlestick?
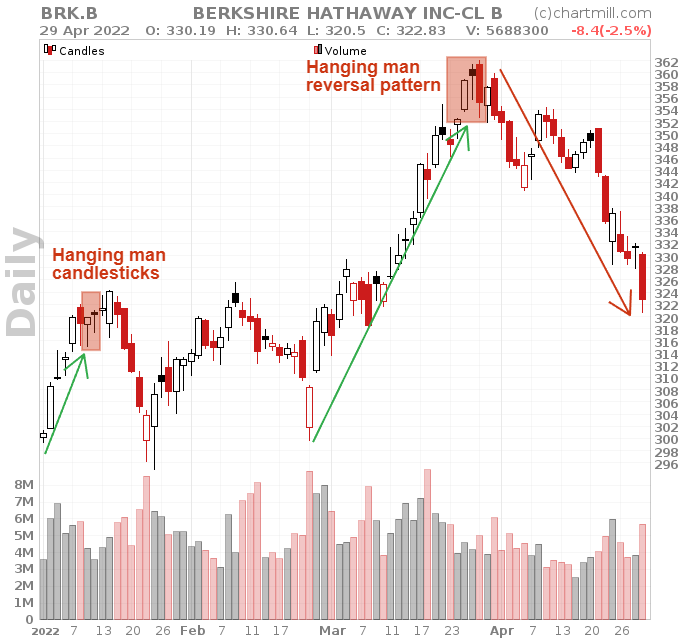
Although both candlesticks look the same there is one big difference.
The bullish hammer occurs during a downtrend while the hanging man pattern is visible in an uptrend making it more of a bearish warning signal.
Take a look at the chart of Berkshire Hathaway. At the end of March 2022, a hanging man reversal pattern became visible after a strong upward trend. This pattern was the beginning of a new downward trend.
Does the color of the body matter in a bullish hammer candle?
No, not really. The body of the candlestick should be small anyway, so it doesn't matter if the price has slightly decreased (red) or increased (green) during the candle.
Much more important is the presence of a long under-shadow at least twice the size of the body and the absence of an upper shadow.