Support and Resistance Indicators Which One to Choose?
Early recognition of support and resistance zones is crucial for active traders who base their strategy primarily around such levels.
Technical indicators can be a useful tool in that regard. They help identify and confirm support and resistance levels. As a result, they offer traders insight into market events.
Don't waste time looking for "the best" indicator to identify support and resistance. There is no such thing. As an investor, it comes down to finding as many converging signals as possible that confirm your assumption, allowing you to open a position with more confidence.
Combining support and resistance levels with technical buy and sell signals from other indicators is the best way to increase the success rate of a setup.
In this article, we review some technical indicators that have their own dynamic support and resistance metrics, as well as some other indicators that can serve as confirmation signals for existing support and resistance levels on a price chart.
Finally, I show some ChartMill proprietary indicators/overlays that make it easier to recognize support and resistance on a price chart.
Dynamic Support And Resistance Indicators
Moving averages
Moving averages are a widely used technical indicator whose primary purpose is to determine trends.
The indicator is calculated by summing up the closing prices of a security, for the chosen period, and then dividing it by the number of periods.
In this way, an average price is obtained which is visible as a line on the chart. There are different types of moving averages but the most commonly used are the simple moving average (SMA) and the exponential moving average (EMA).
Some popular moving average intervals are 20, 50, and 200SMA. Technical investors use these as dynamic support and resistance zones.
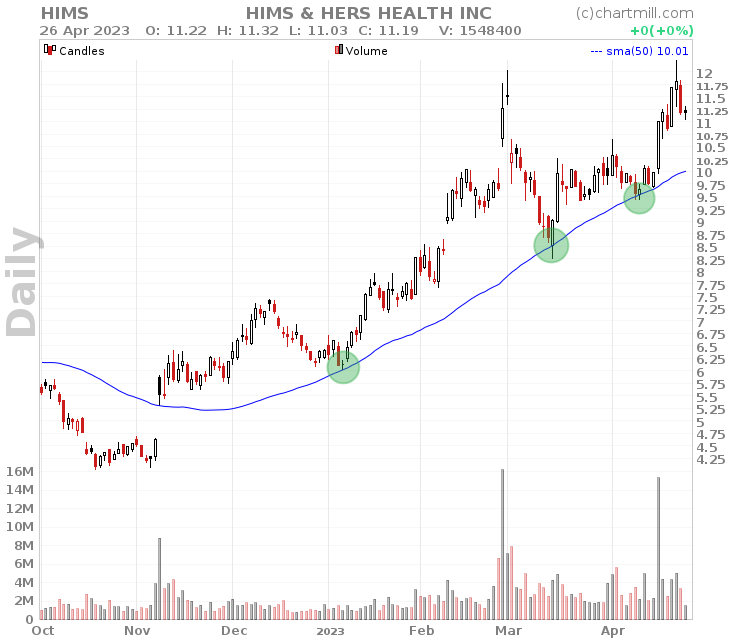
In an uptrend, the underlying SMA will be used this way as support, in a downward main trend, the falling SMA will act as resistance.
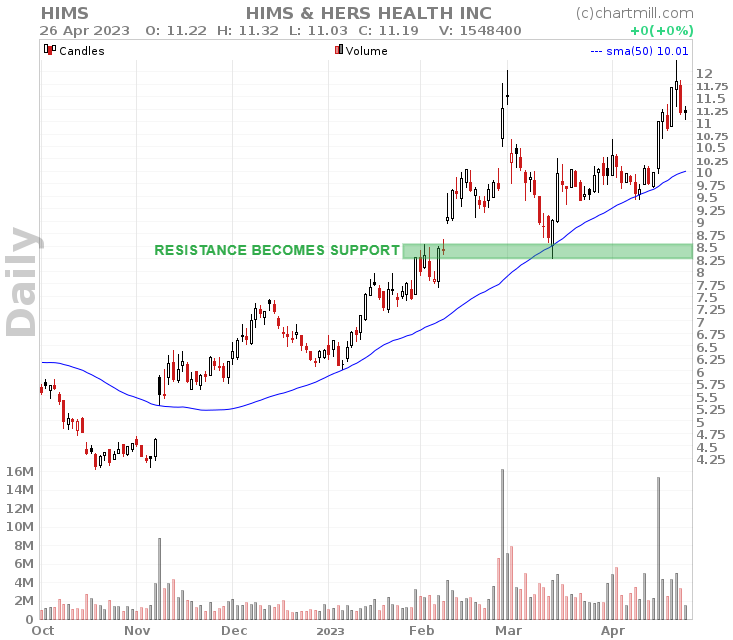
This indicator is especially interesting when it coincides with horizontal support and resistance levels.
Bollinger Bands
Bollinger Bands were developed by John Bollinger in the 1980s and are based on a moving average with a certain number of standard deviations (standard 2).
The indicator is visible on the chart as a combination of three lines. The middle line is a simple moving average, but it is mainly the upper and lower Bollinger bands that are interesting in the context of support and resistance.
When a stock price moves near the upper band, it is considered a potential resistance level, while a price close to the lower band is considered a potential support level. A price moving outside the bands is an indication of increased volatility.
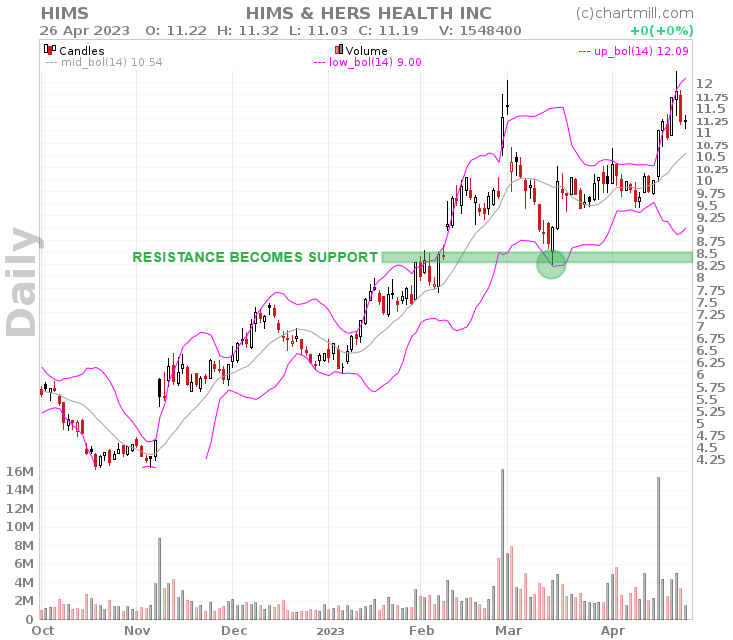
The extreme Bollinger bands are support and resistance levels in themselves.
However, as a trader, it becomes particularly interesting when reversal patterns at the level of one of the two extreme bands occur at the same price level where horizontal or diagonal support or resistance levels are recognized.
Fibonacci retracements
The Fibonacci retracement tool is based on the idea that prices will often retrace a predictable portion of a move, after which they will resume their original trend.
Traders use Fibonacci retracements to identify potential support and resistance levels based on key Fibonacci ratios.
Pivot points
Pivot Points are calculated using the previous day's highest, lowest, and closing price. The resulting values are plotted on a chart as horizontal lines. The basic idea is that if the price is trading above the pivot point, it is considered that the security is in a rising trend. If the price is trading below the pivot point, it is considered to be in a downtrend.
Based on the pivot point, S1, R1, and S2, R2 is then calculated. S1 and S2 are potential support levels, and R1 and R2 are the next resistance levels.
By default, the calculation is based on daily prices but equally, weekly or monthly pivot points can be calculated based on the highest, lowest and lowest closing prices of, for example, the previous week or month.
When a stock's price trades near a pivot point, it can be seen as a potential support or resistance level. Price action near pivot points, such as a bounce or breakout, can then be used to make trading decisions.
Indicators That Can Be Used As Confirmation Signals
Relative Strength Index (RSI)
The RSI is a momentum oscillator that measures the speed and change of price movements. It ranges from 0 to 100 and is used to determine overbought and oversold conditions.
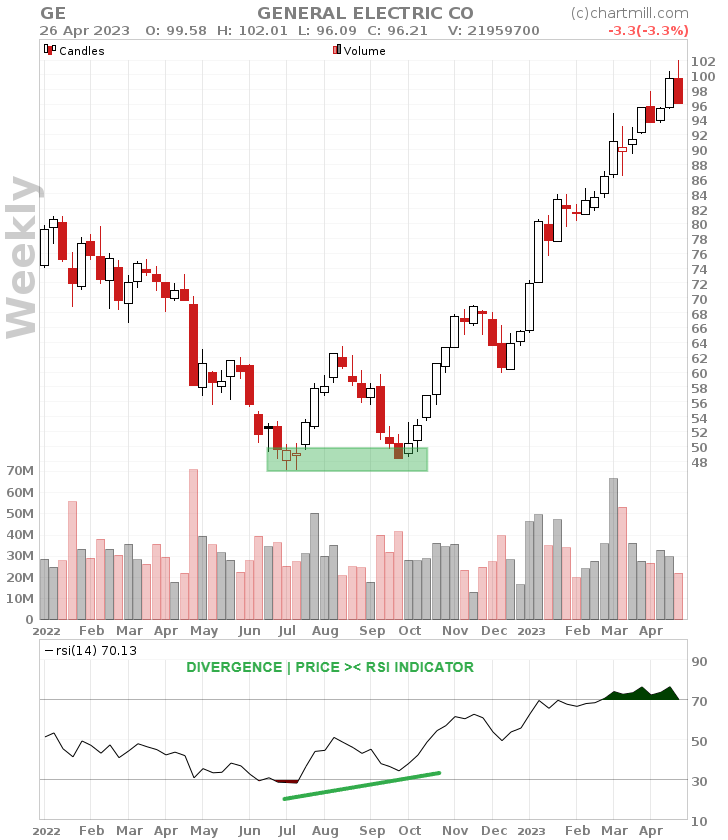
A security is considered overbought if the RSI indicator registers above 70. If the indicator reaches a value lower than 30, it is considered "oversold.
Divergences between the indicator and the stock price can serve as a confirmation element for trader-identified support and resistance zones on the price chart.
Suppose a stock shows a strong rally with the price rising to an identifiable resistance level for the second time in a short period. If the RSI indicator shows a lower top at the same time, this is an additional confirmation of that resistance.
This is also true in reverse. For example, a stock whose price falls for the second time in a row towards a previous price bottom while the RSI shows a higher bottom during the same period. The higher RSI bottom is a sign that the price decline is losing momentum, strengthening the existing support level.
Moving Average Convergence Divergence (MACD)
The MACD is a trend-following momentum indicator that represents the relationship between two moving averages based on the price of a security. The MACD line (red) is calculated by subtracting the 26-period exponential moving average (EMA) from the 12-period EMA.
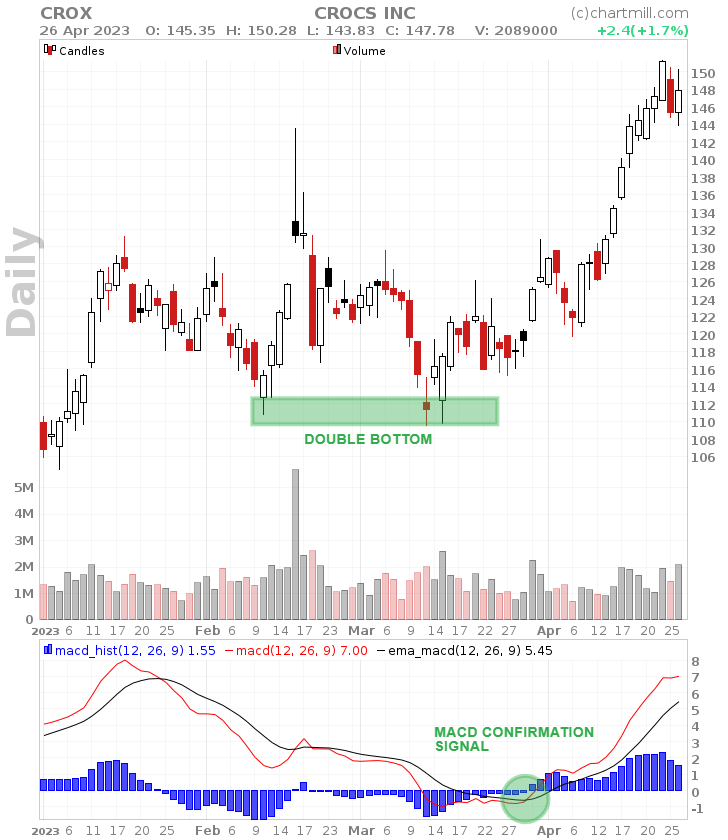
The signal line (black) is obtained by calculating a 9-day EMA over the red line.
If the MACD line crosses the signal line upward it indicates a buy signal. If the MACD line crosses the signal line downward one obtains a sell signal.
The MACD indicator can be used as a confirmation signal by looking for upward or downward crosses that coincide with a price close to support or resistance.
Stochastic Oscillator
The Stochastic Oscillator is a momentum indicator that compares the closing price of a stock to its price range over some time. It runs from 0 to 100 and is used to determine overbought and oversold conditions.
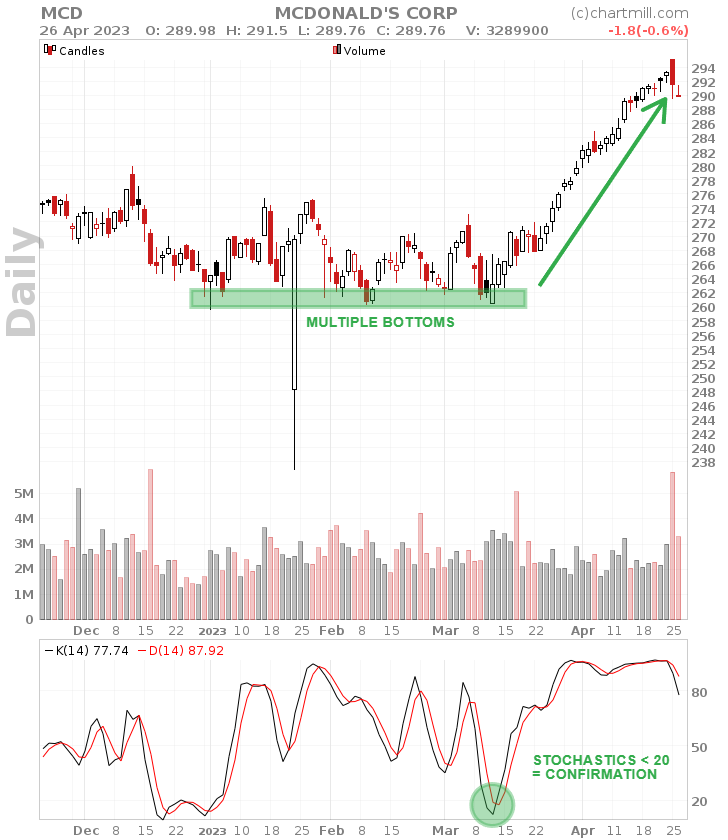
A value higher than 80 is considered overbought territory; a value lower than 20 is considered an oversold situation.
A stochastic value higher than 80 is considered a confirmation of the prevailing resistance if the price is near it at the same time.
A stochastic value below 20 is considered a confirmation of current support if the price is simultaneously near it.
ChartMill proprietary Support And Resistance Indicators/Overlays
ChartMill has several indicators available on the Stock Charts or Stock Screener page which draw support and resistance lines automatically on the charts:
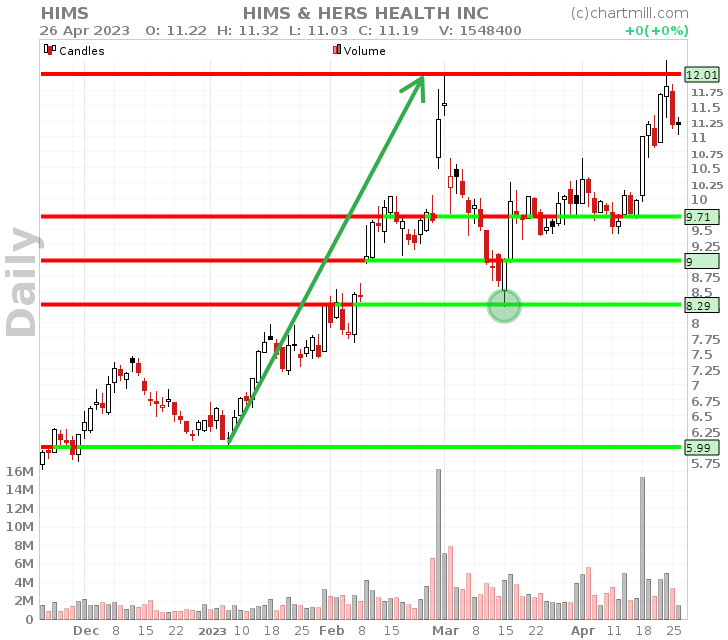
Auto Support and Resistance indicator
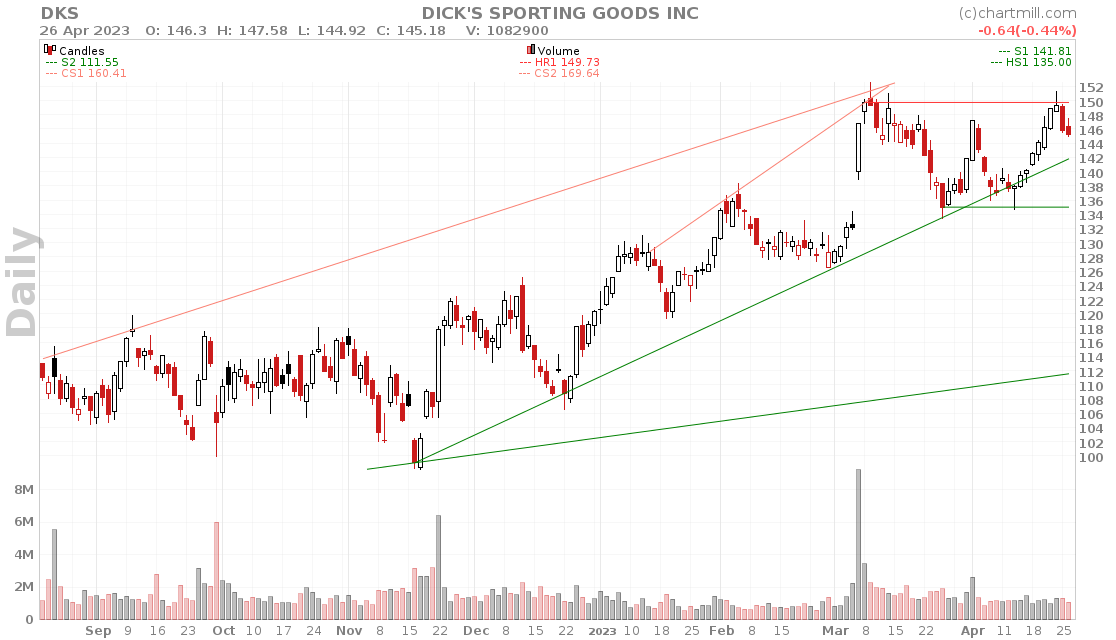
This indicator draws both horizontal lines as well as support and resistance trend lines by connecting multiple bottoms or tops.
ChartMill Channels overlay indicator
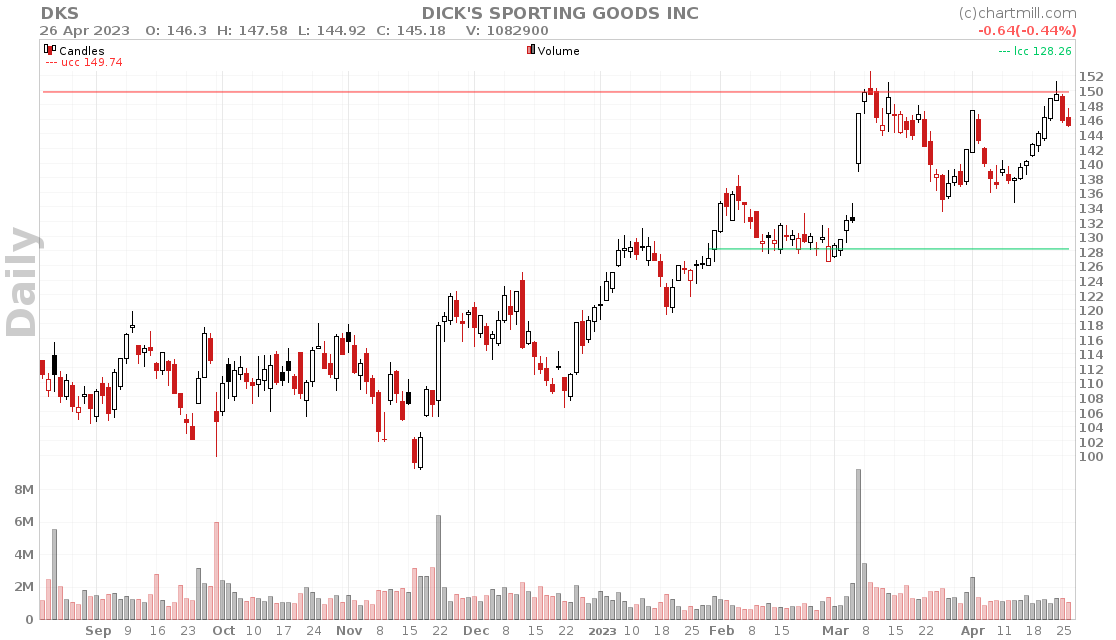
ChartMill Channels draw horizontal lines which identify the current trading range of the underlying stock.
ChartMill Consolidated Support and Resistance overlay indicator
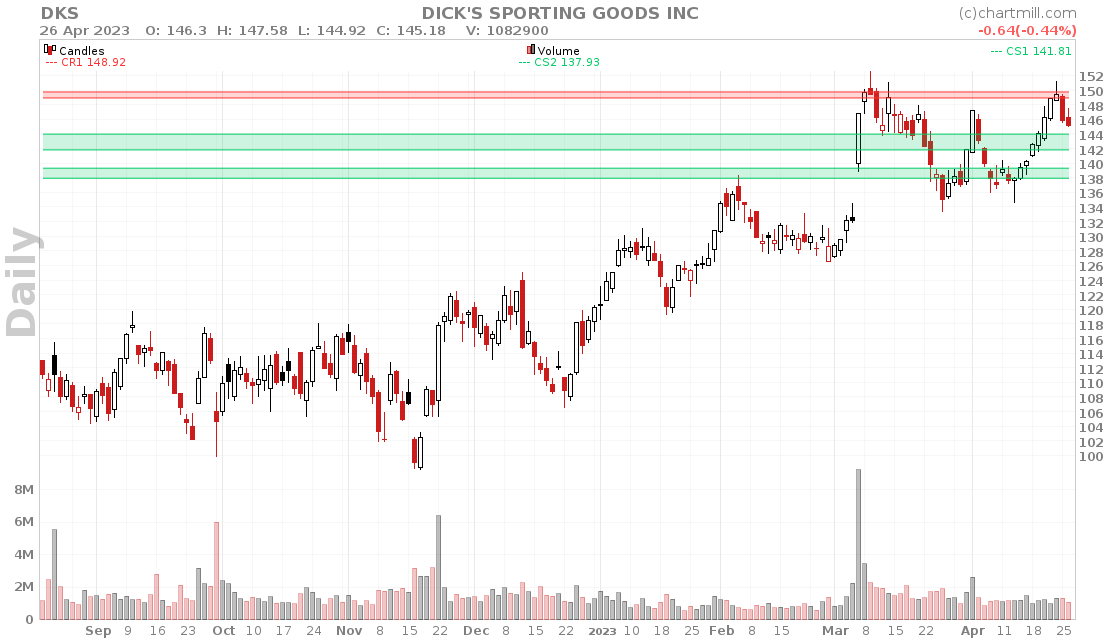
Consolidated support and resistance display different zones of support and resistance which are computed from several support and resistance indicators in different timeframes.
Related Articles