Chartmill Consolidated Support and Resistance
Support and Resistance are of the most important tools in Technical Analysis and can originate from many sources:
- Horizontally aligned tops and bottoms.
- Trendline formations by connecting multiple tops or bottoms.
- Chartmill channels
- Moving averages.
And all of these patterns and indicators arise in multiple timeframes.
In chartmill, we have the concept of support, resistance and channel strength. The strength will be higher when the line has more places where it touches the price formation. So lines with a higher strength have been confirmed multiple times.
When calculating the 'Consolidated Support and Resistance' we are evaluating and combining trendlines, horizontal lines, channels, moving averages and their strengths in multiple timeframes into a single set of Support and Resistance Areas.
Consolidated Support and Resistance in TA Report
The ChartMill Technical Report paints a nice overview of the global support and resistance areas. On the charts, you will see the main trendlines in the daily and weekly timeframes. The section Support/Resistance Analysis will visually display and discuss the consolidated support and resistance:
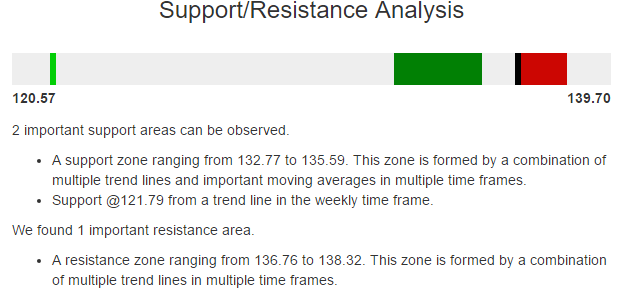
The black line indicates the current price level. The zones are displayed on the bar and color coded: the stronger the support/resistance, the darker the green/red will appear. Check out an example here.
Consolidated support and resistance on the charts.
The consolidated support and resistance zones can also be displayed on a chart:
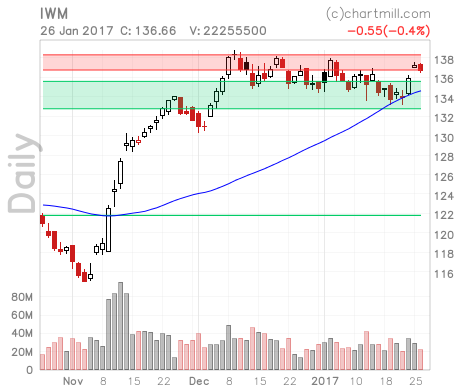
You can achieve this by adding the overlay "Consolidated support and resistance" to your chart or use this link to a pre-configured chart.
Consolidated Support and Resistance in the Stock Screener.
The big advantage in the Stock Screener is that you can use single property to screen for: near support or near resistance. Alternatively, you could run different screens to check for prices near channel or trendline lines, but usually you don't care where the support or resistance is coming from.
On the Support/Resistance tab you can check for prices near important Support or Resistance areas. Typically, you can use support or resistance in 2 ways. (For short trading, you can inverse this logic):
- You can buy when a stock breaks out of a resistance zone. The theory is that the difficult part is behind and the stock can now more freely, while the zone that was previously resistance has now turned into support.
- You can buy in or near a strong support zone. The theory is now that you can expect support for the price, but also important: when the support level does not hold you have a easy and nearby exit point.
Screening examples
- This first example is a screen that uses trend intensity to search for a strong trend and looks for prices approaching consolidated resistance. The stocks shown are potential breakout candidates.
- In this second example, we use the technical quality score and setup value to find stocks with a decent technical score, showing a good setup and are near resistance .... possibly breaking out when they break resistance.
Check the linked article for more Support and Resistance based screening examples, more theory can be found in the general Support and Resistance article.
Lots of different configurations are possible of course .... enjoy!