Market Monitor Trends and Breadth June 27
By Kristoff De Turck - reviewed by Aldwin Keppens
Last update: Jun 27, 2025
(All data & visualisations by ChartMill.com)
Daily Market Trend Analysis – June 26, 2025 (After Market Close)
New All Time High for QQQ!
Short Term Trend
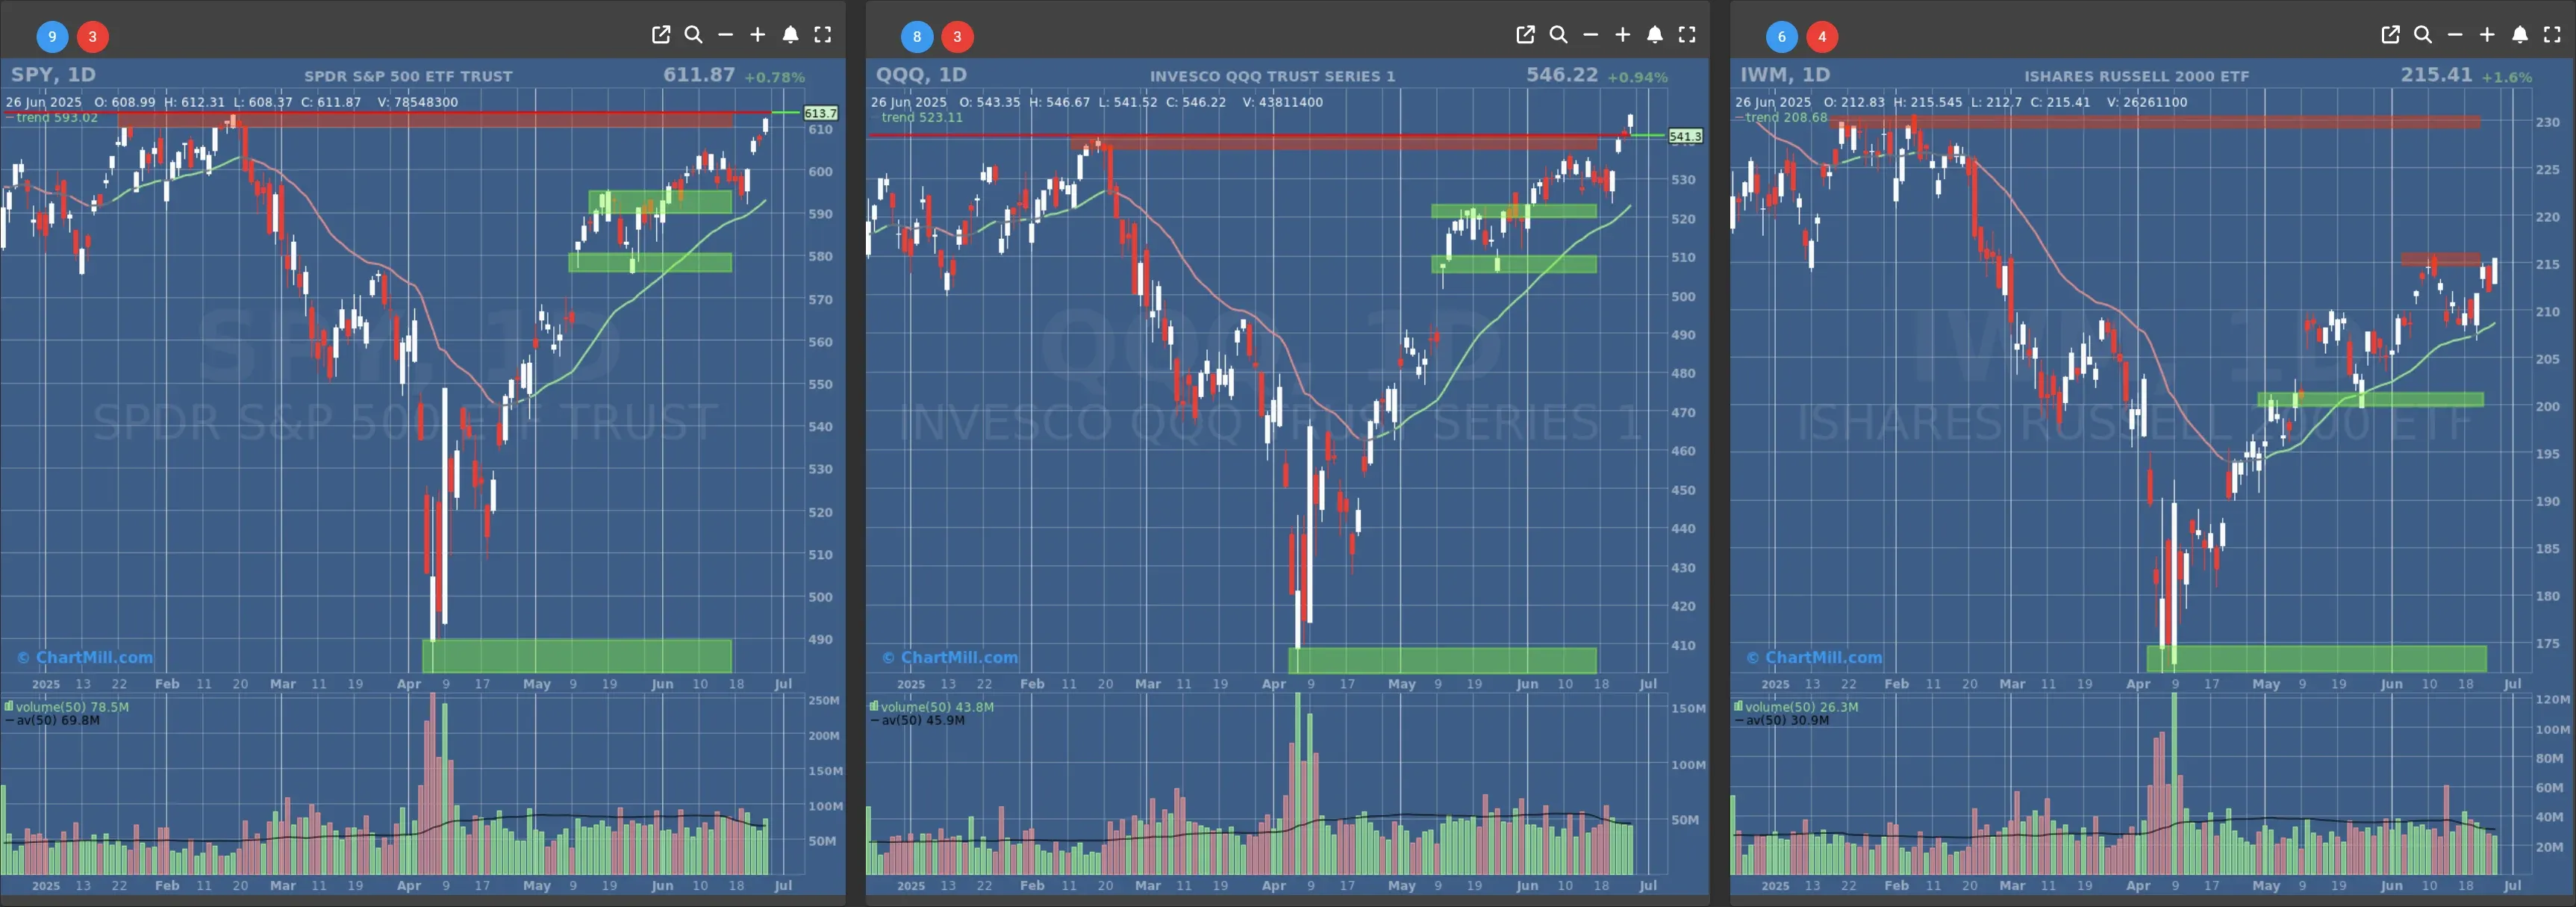
- Short-Term Trend: Bullish (no change)
- Next Support at $580
- Next Resistance at $610
- Volume: Slightly Above Average (50)
- Pattern: Gap Up and strong close, near All Time High
- Short-Term Trend: Bullish (no change)
- Next Support at $520
- Next Resistance at $540
- Volume: At Average (50)
- Pattern: Breakout Candle, Close above All Time High
- Short-Term Trend: Bullish (no change)
- Next Support at $210 & $205
- Next Resistance at $215 & $230
- Volume: Slightly Below Average (50)
- Pattern: Strongest performer, closing above $215
Long Term Trend
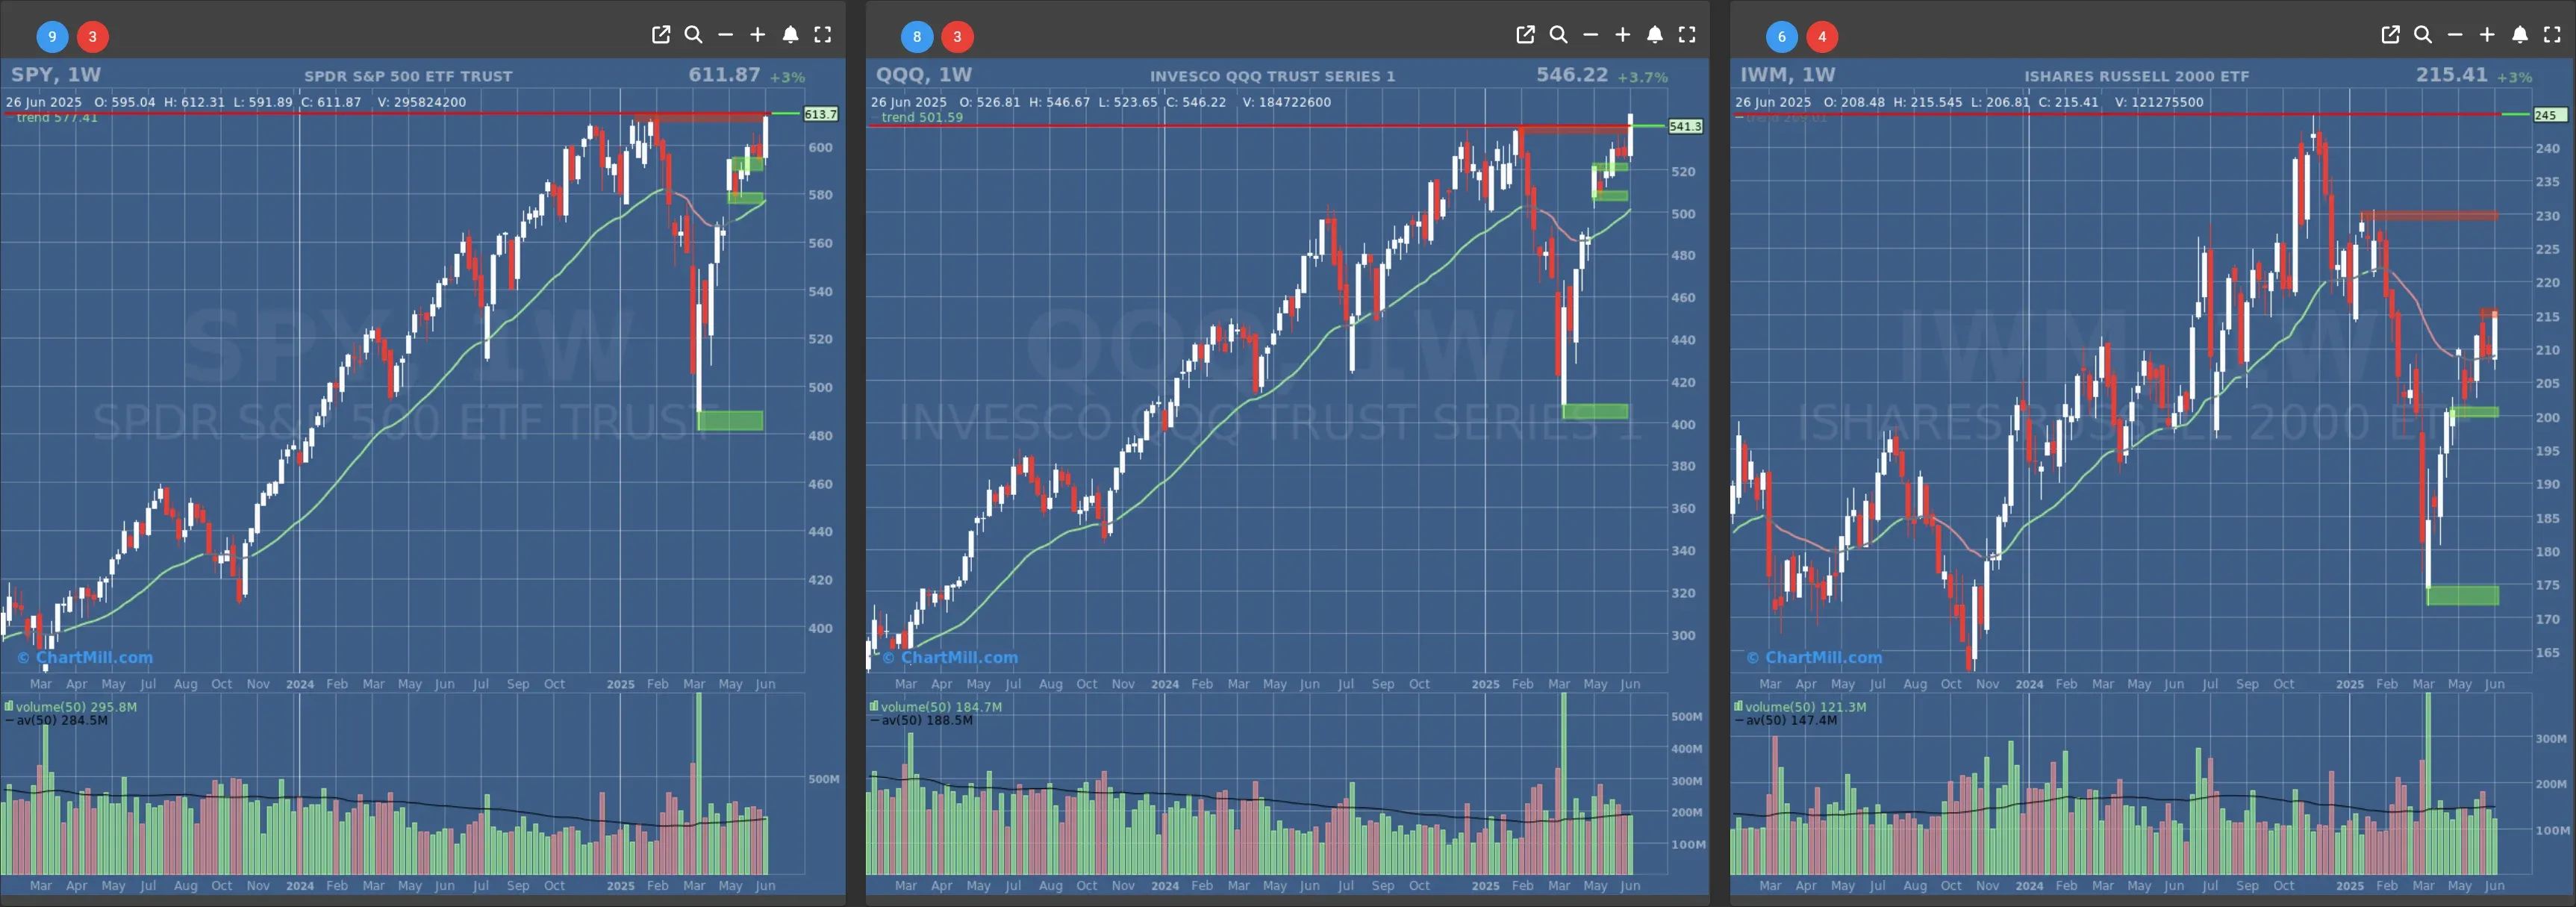
- Long-Term Trend: Positive (no change)
- Long-Term Trend: Positive (no change)
- Long-Term Trend: Neutral (no change)
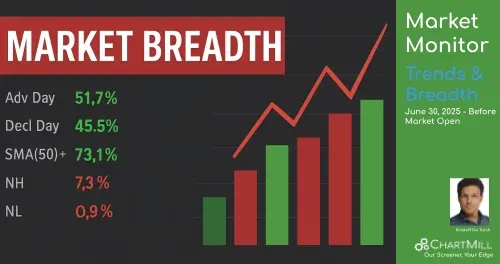
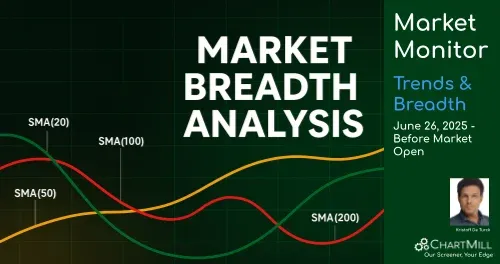
Daily Market Breadth Analysis – June 26, 2025 (After Market Close)
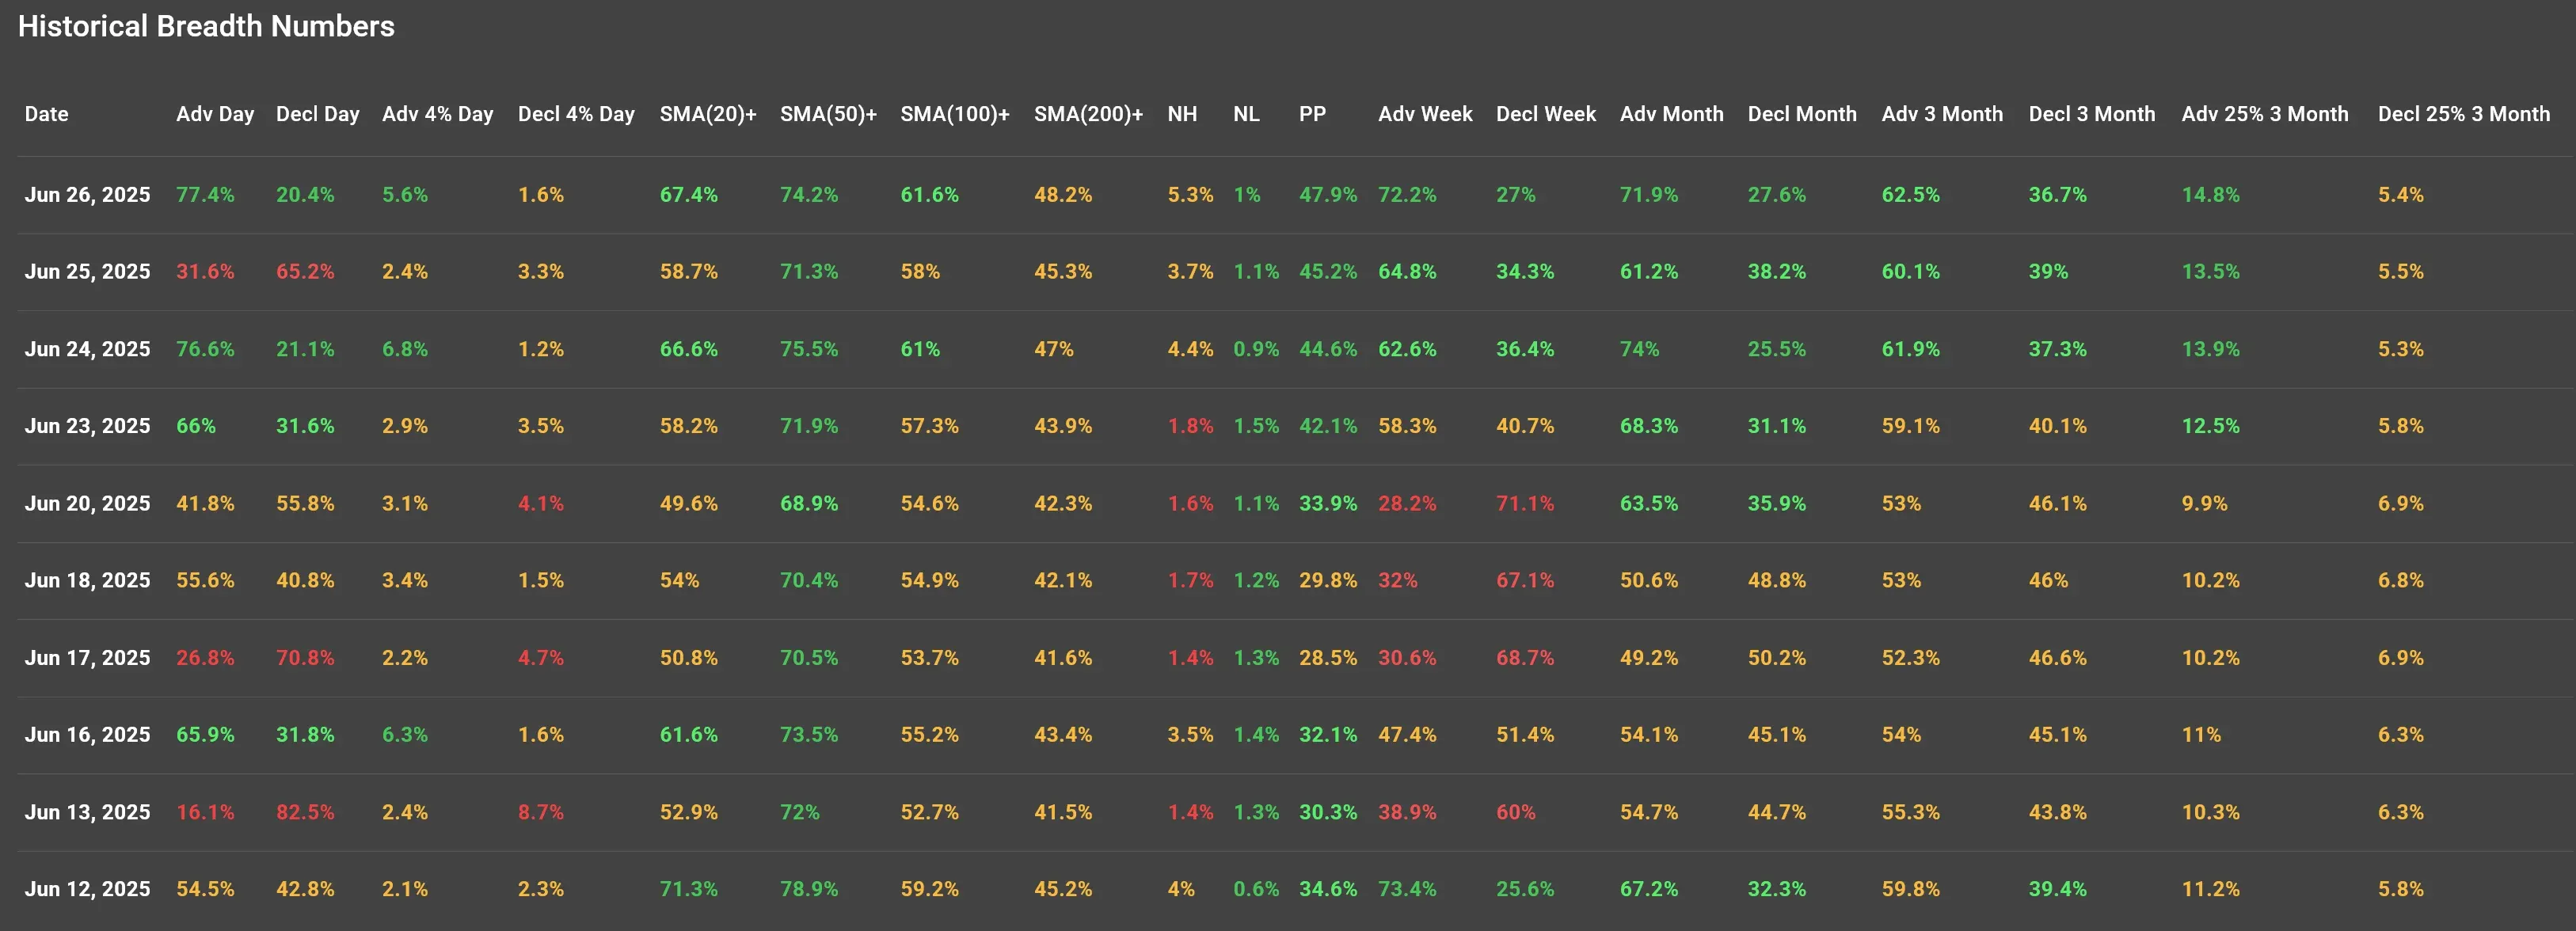
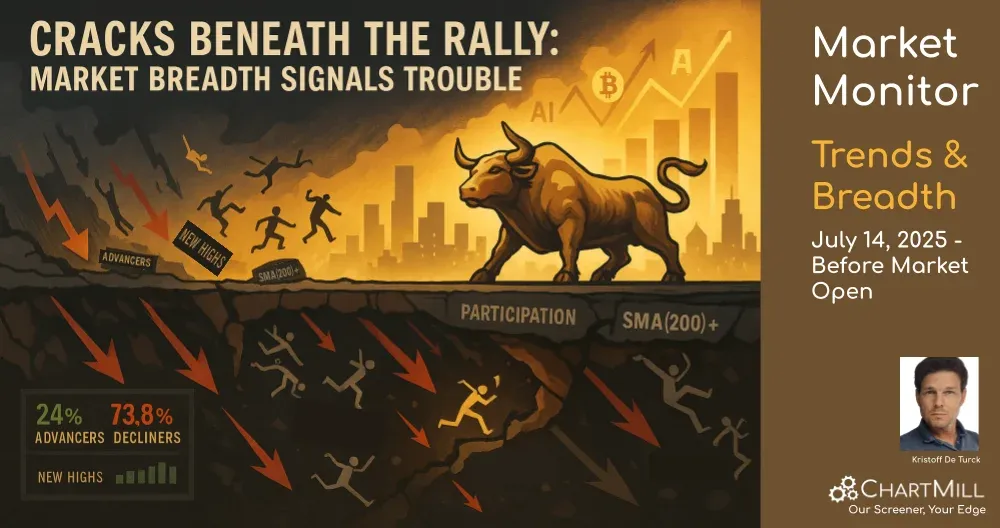
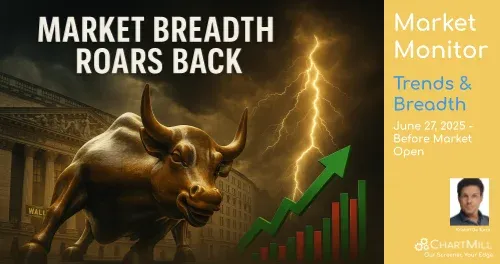
The bulls came storming back into the arena on June 26, with a powerful 77.4% of stocks advancing on the day.
It was the strongest single-day showing for market breadth since June 24. Coming off a messy dip on June 25, when only 31.6% of stocks advanced?
This snapback confirms one thing: this market has a short memory and a whole lot of buying pressure on dips.
From Whiplash to Breakout?
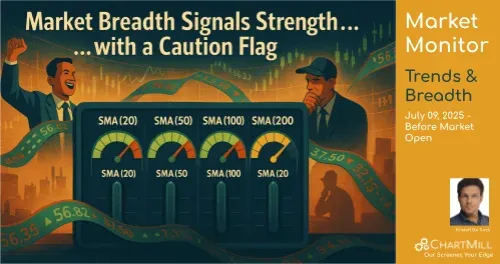
Let’s talk momentum. Wednesday’s breadth reversal was more than just a technical bounce, it was a broad-based reclaim. The percentage of stocks above key moving averages jumped across the board:
Moving Avg Jun 25 Jun 26 Change
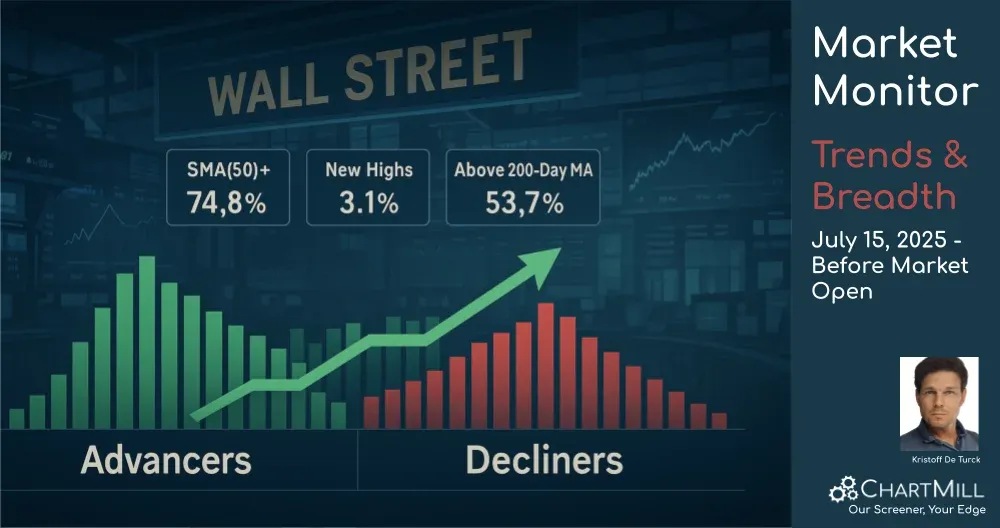
Above 20SMA 58.7% → 67.4% ▲ 8.7%
Above 50SMA 71.3% → 74.2% ▲ 2.9%
Above 100SMA 58.0% → 61.6% ▲ 3.6%
Above 200SMA 45.3% → 48.2% ▲ 2.9%
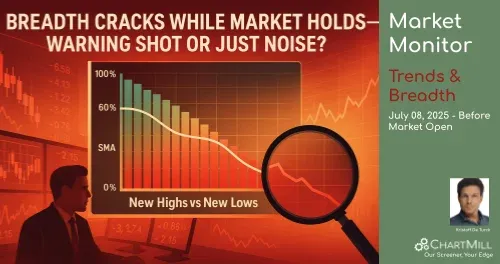
Even the New Highs (NH) ticked up to 5.3%, a level we haven’t seen since early last week. The New Lows (NL) dropped to just 1.0%, indicating that fewer stocks are rolling over, a clear improvement in participation.
Reversal of the Reversal
The June 25 drop had all the signs of a sentiment scare, most likely triggered by ongoing Fed chatter and uncertainty about rate cuts.
It’s no coincidence that breadth had narrowed just as Jerome Powell reiterated that he’s in no rush to cut rates. Add in the disappointing GDP revision (-0.5% vs expected -0.2%), and Tuesday’s numbers made perfect sense.
But the latest data tells a different story, especially in weekly and monthly breadth trends:
Breadth Metric Jun 25 Jun 26
Advancing Stocks (Week) 64.8% → 72.2%
Advancing Stocks (Month) 61.2% → 71.9%
Adv. > 25% in 3 mo 13.5% → 14.8%
We’re seeing sustained momentum over multiple timeframes, not just a flash-in-the-pan bounce.
A Word of Caution
Despite the green glow across the dashboard, the percentage of stocks above their 200SMA remains below 50% (48.2%), and that's a key stat for long-term trend confirmation. That number has been stuck in the mid-40s for over a week now.
This tells me one thing: we’re rallying, but not from strength, we’re still rallying from weakness. Which means this market can still turn on a dime.
Also worth watching: percentage of stocks down 25% or more in the last 3 months remains sticky around 5.4–6.9%. That’s not high, but it's consistent, showing a segment of the market still getting punished under the surface.
Final Takeaway
The data doesn’t lie: the bulls staged a powerful comeback on June 26. Short-term breadth metrics have turned convincingly positive, and participation in the rally has broadened. But longer-term indicators still suggest caution is warranted, the foundation isn’t yet rock solid.
Expect volatility to remain, especially as macro news and political pressure on the Fed continue to stir the pot. For now, though, the breadth trend favors the bulls and after Tuesday’s fake-out, they’ve earned the benefit of the doubt.
Kristoff - Co-founder, ChartMill
Next to read: Market Monitor News, June 27
218.82
-4.37 (-1.96%)
556.72
+0.51 (+0.09%)
622.14
-2.67 (-0.43%)
Find more stocks in the Stock Screener
IWM Latest News and Analysis