Market Monitor Trends (SPY, QQQ, IWM) and Breadth June 05
By Kristoff De Turck - reviewed by Aldwin Keppens
Last update: Jun 5, 2025
(All data & visualisations by ChartMill.com)
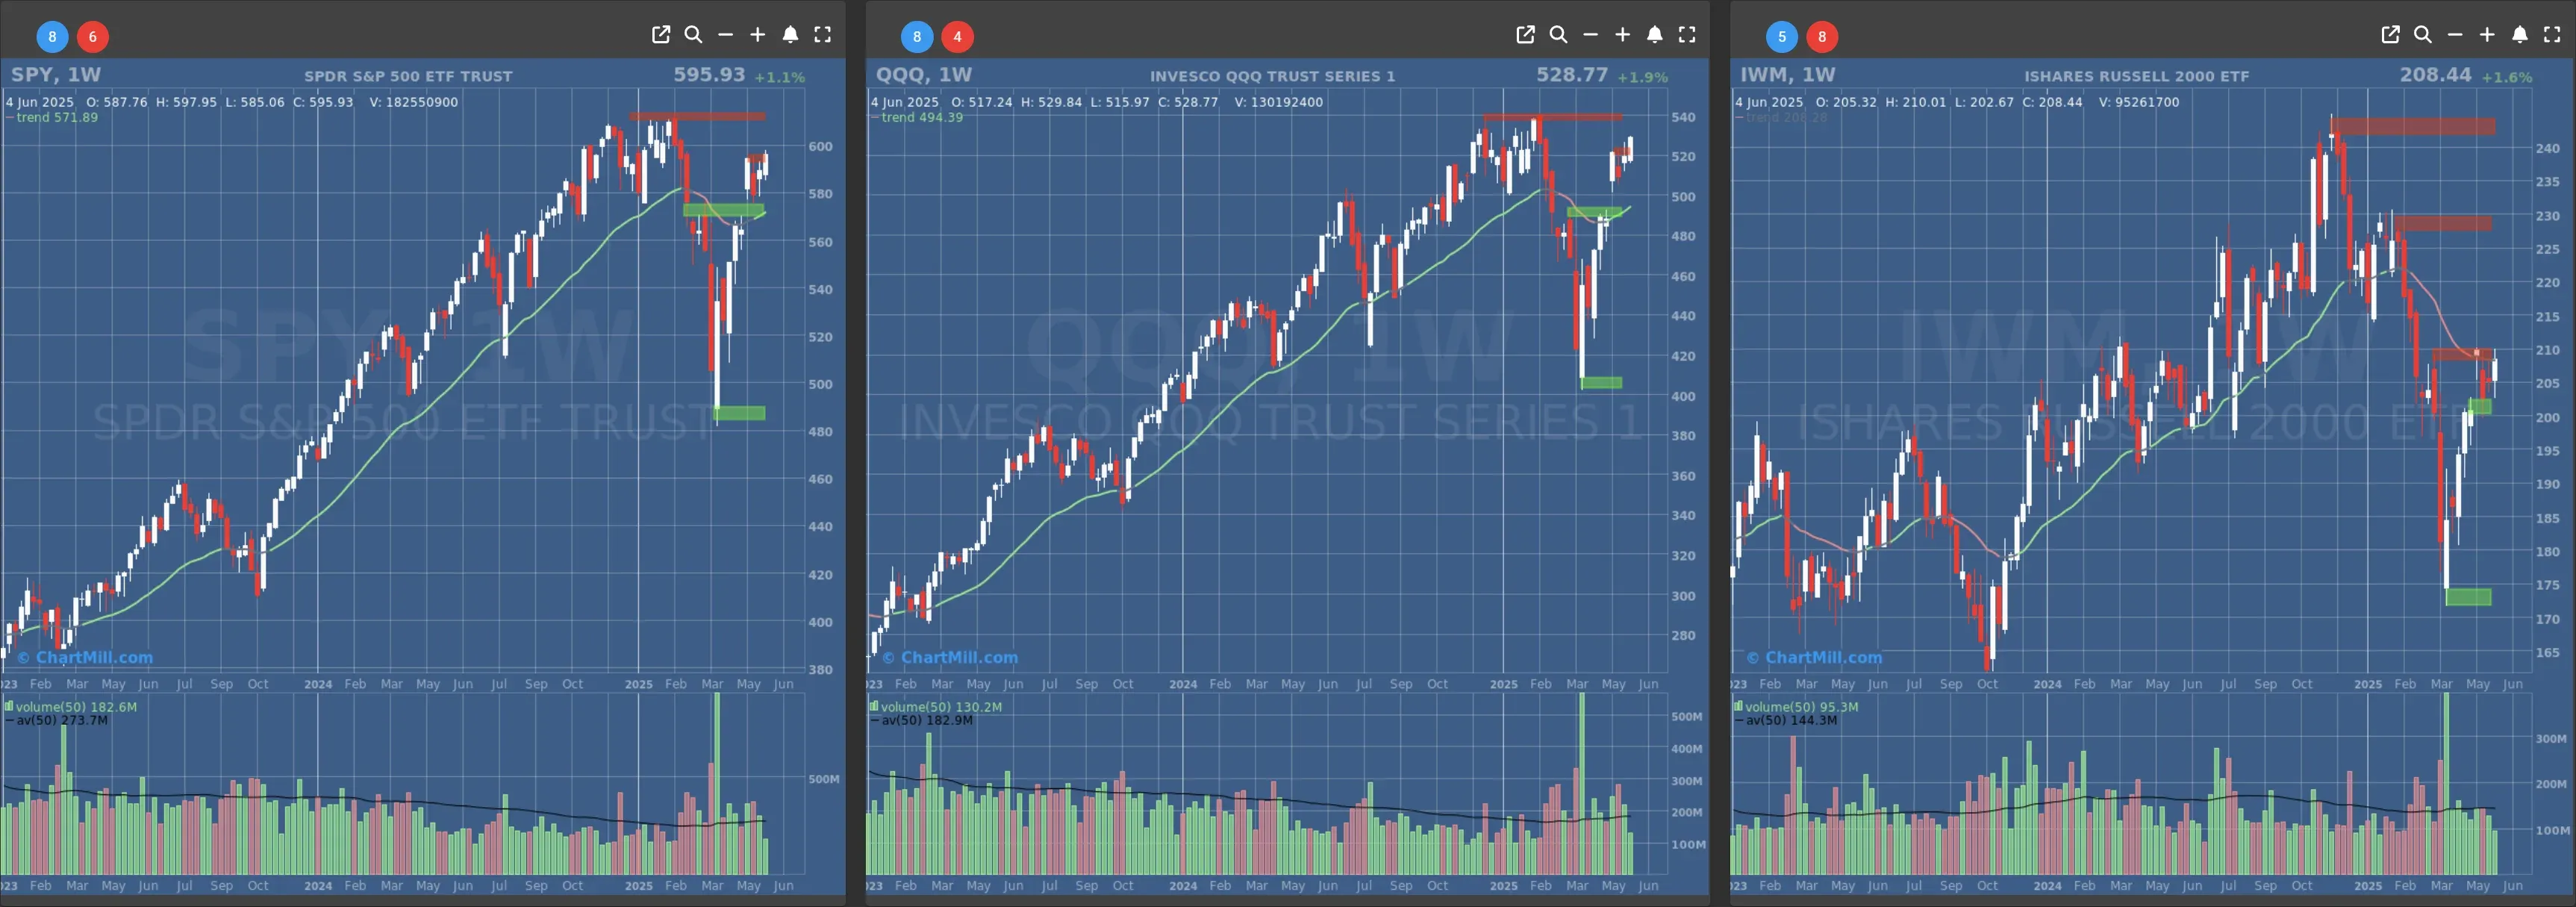
Daily Market Trend Analysis – June 04, 2025 (After Market Close)
After Tuesday's strong session, today was a quiet day for the major indexes.
Short Term Trend
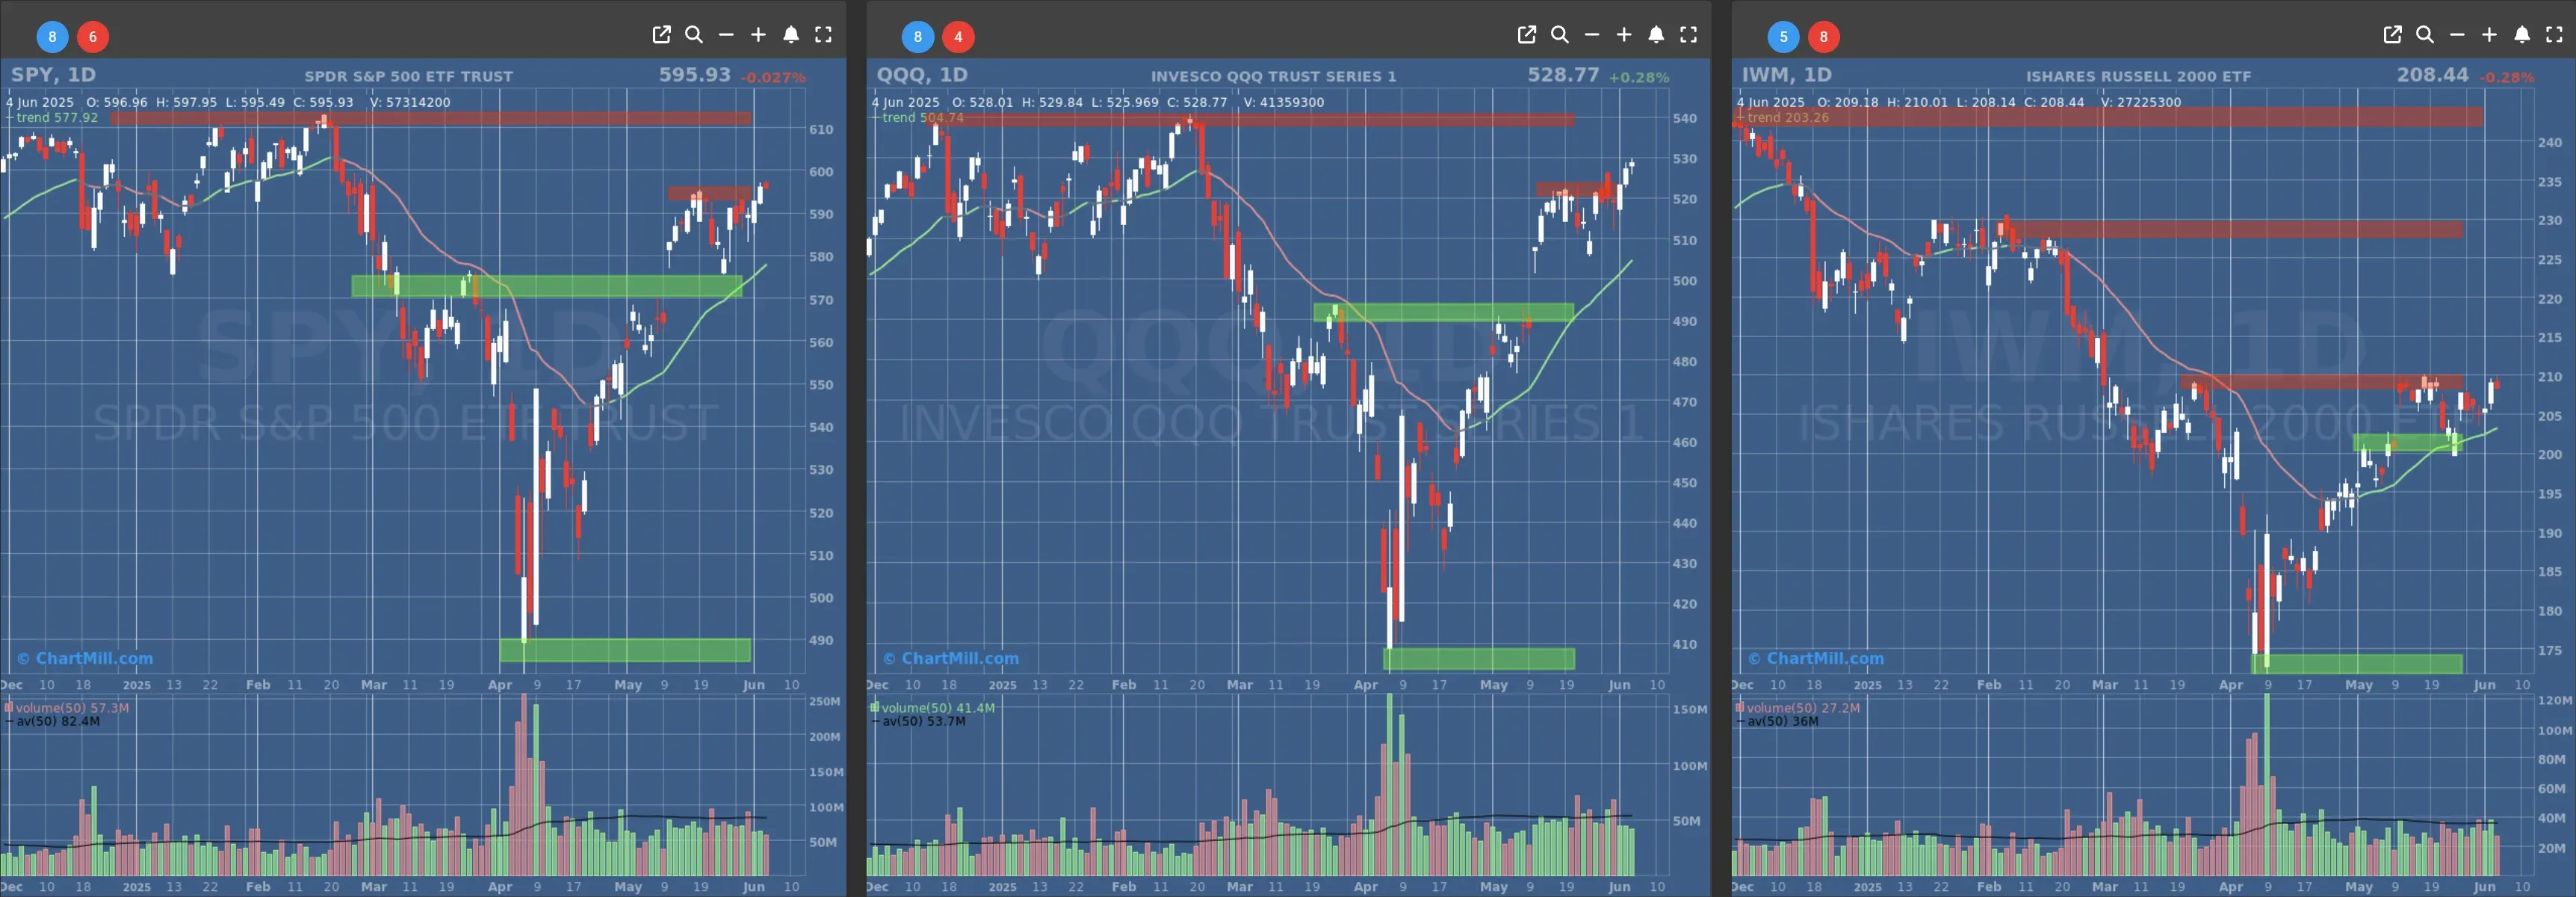
- Short-Term Trend: Bullish (no change)
- Next Support at $570
- Next Resistance at $595
- Volume: Below Average (50)
- Pattern: Dow Day
- Short-Term Trend: Bullish (no change)
- Next Support at $490
- Next Resistance at $520
- Volume: Below Average (50)
- Pattern: Down Day
- Short-Term Trend: Bullish (no change)
- Next Support at $200
- Next Resistance at $205 & $210
- Volume: Below Average (50)
- Pattern: Down Day
Long Term Trend
- Long-Term Trend: Positive (no change)
- Long-Term Trend: Positive (no change)
- Long-Term Trend: Neutral (no change)
Daily Market Breadth Analysis – June 04, 2025 (After Market Close)
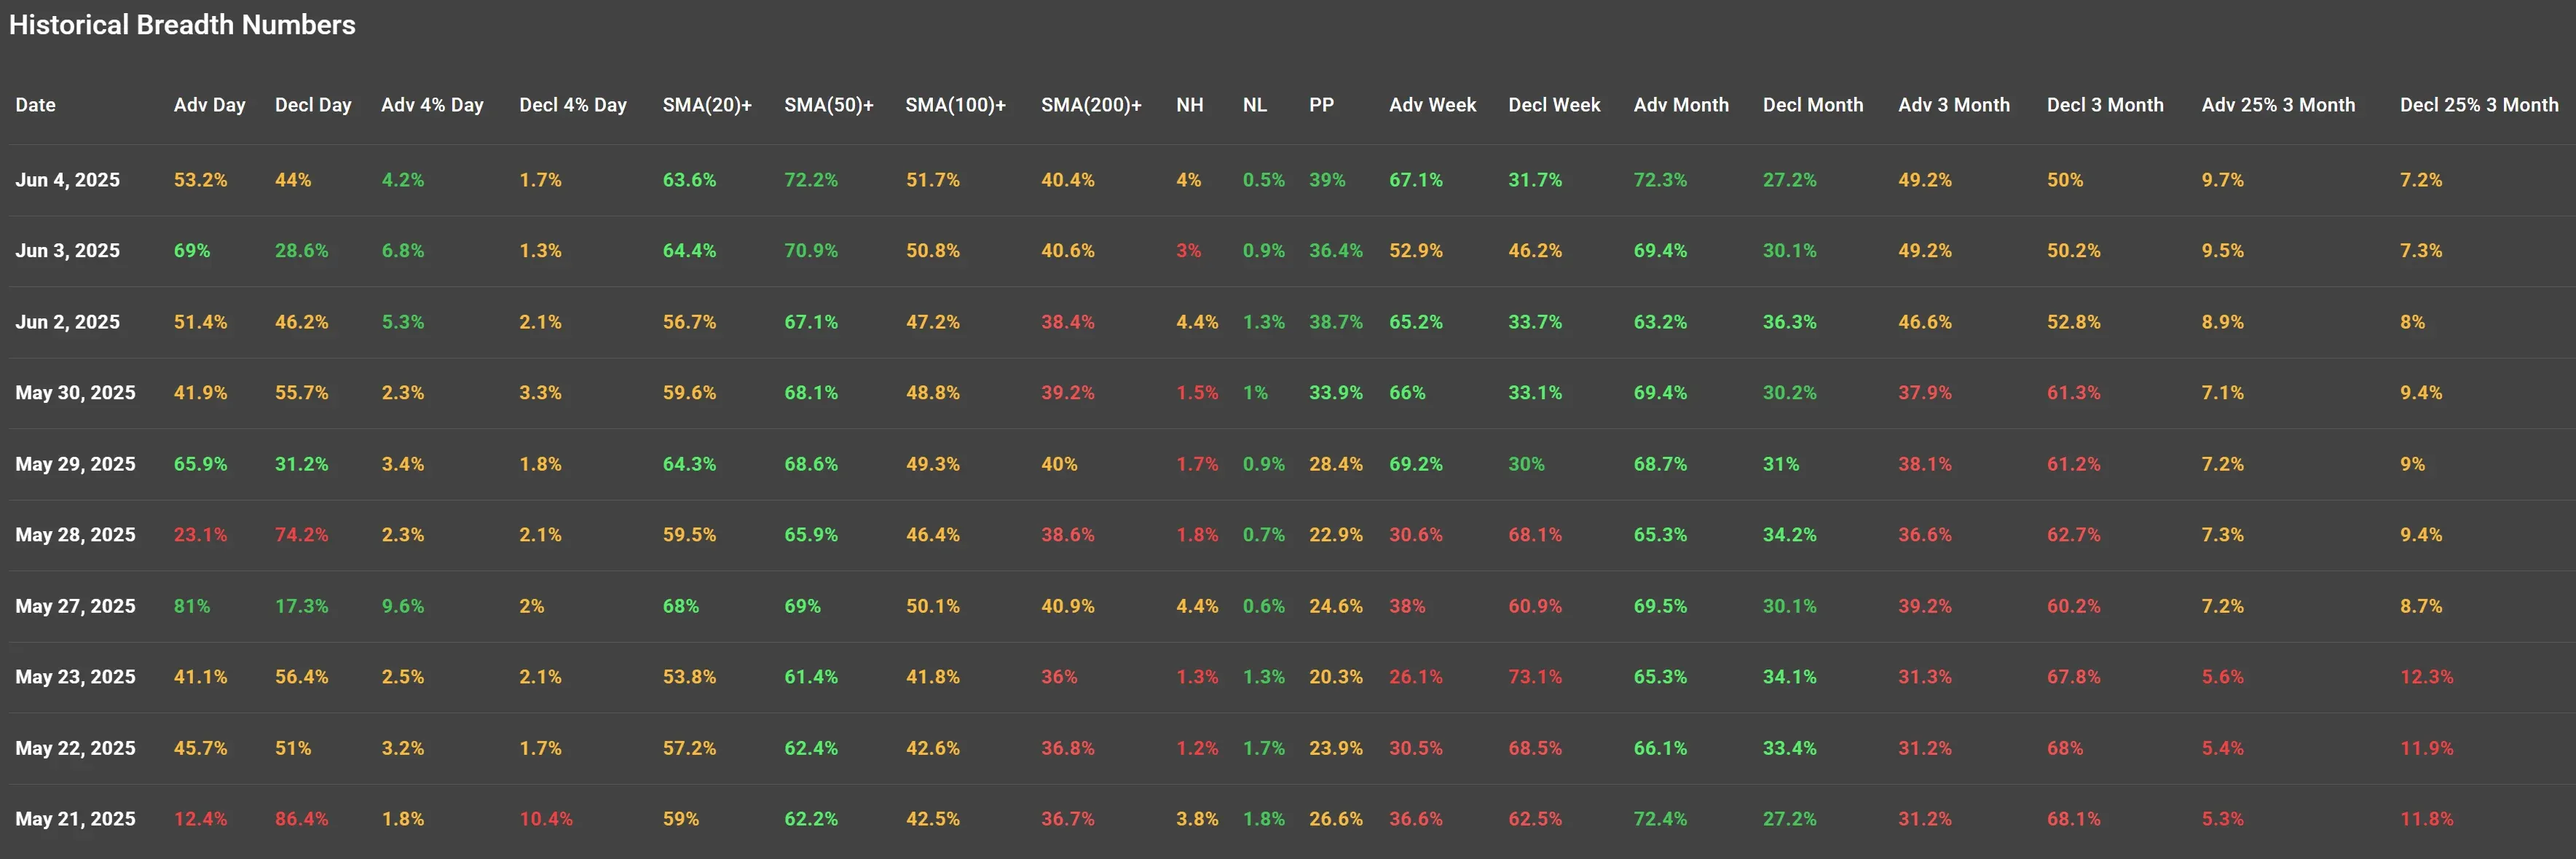
Market breadth on June 4, 2025, signaled a mixed but cautiously constructive outlook following Tuesday's strength.
While the broader market cooled off slightly, underlying technical trends remained firm. Below is an analysis of the key developments, with a comparison to the previous session.
Advancers vs. Decliners: Cooling, but Still Positive
-
Advancing stocks made up 53.2% of the market, down from 69.0% on June 3.
-
Decliners increased slightly to 44.0%, but still lagged the number of gainers.
-
Notably, 4.2% of stocks advanced by 4% or more, compared to 6.8% the day before, indicating fewer strong movers but still healthy participation.
-
Conversely, only 1.7% of stocks saw 4%+ declines, suggesting continued weakness remains limited.
Context: While breadth narrowed compared to June 3’s bullish surge, today's figures still support a constructive bias. This suggests the rally isn't unraveling but merely pausing.
Technical Health: SMA Participation Strengthens
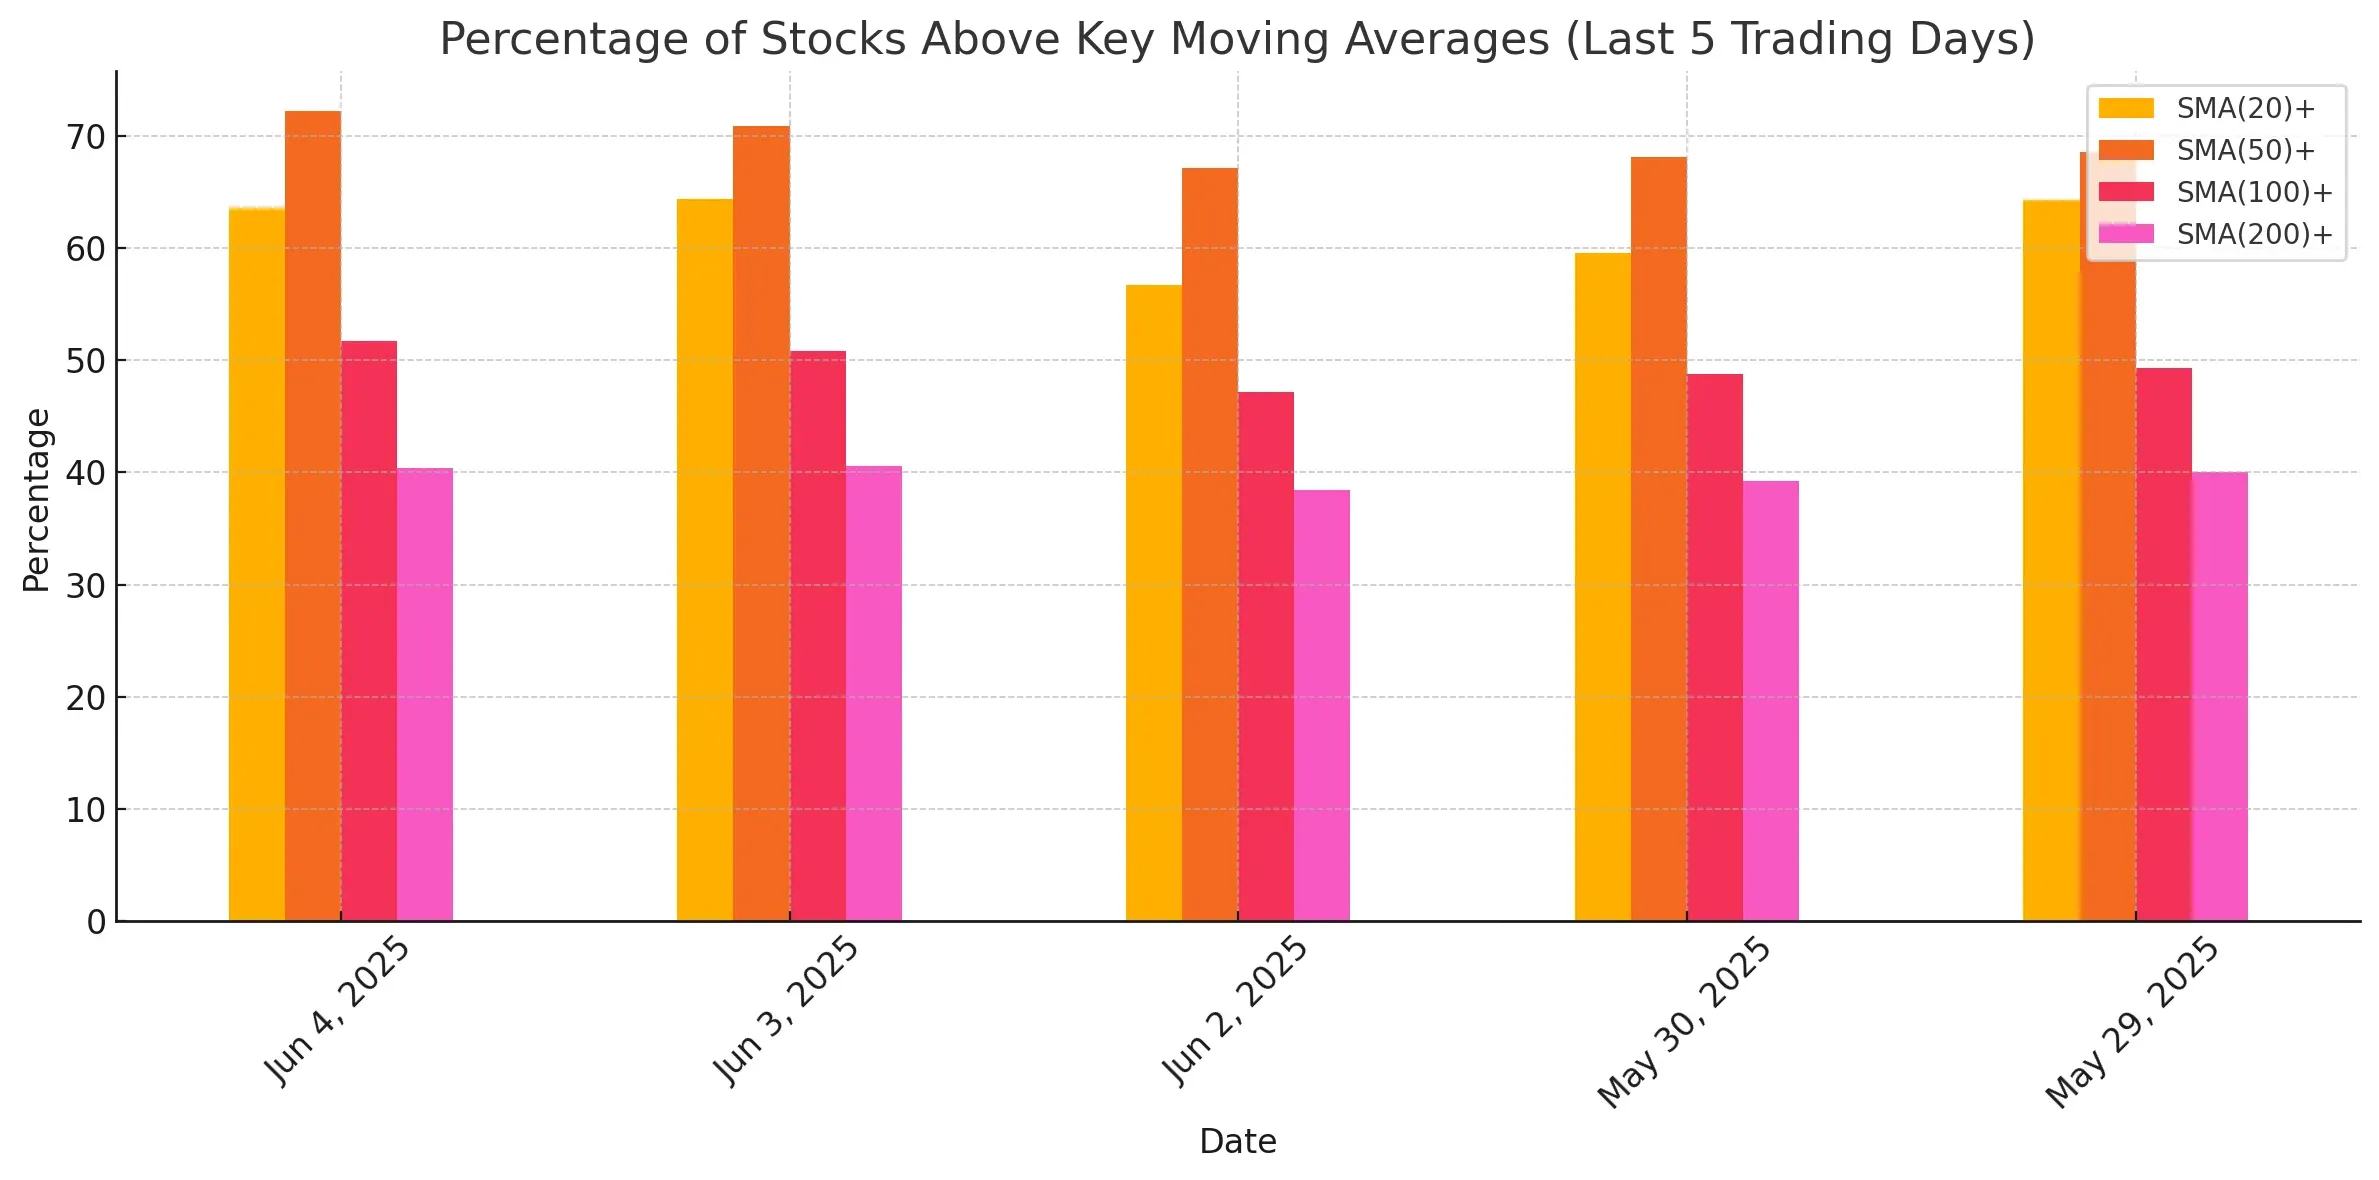
As shown in the chart above, the percentage of stocks trading above key moving averages remains stable or improving slightly:
-
SMA(20)+: 63.6% (vs. 64.4% on June 3)
-
SMA(50)+: 72.2% (↑ from 70.9%), a bullish sign of broad strength in mid-term trends
-
SMA(100)+: 51.7% (↑ from 50.8%)
-
SMA(200)+: 40.4% (↓ marginally from 40.6%)
The steady rise in SMA(50)+ and SMA(100)+ percentages reflects a deepening of the bullish structure across more names, despite minor day-to-day fluctuations.
New Highs vs. New Lows: Momentum Shifts
-
New Highs (NH) jumped to 4.0%, the highest in the last five sessions.
-
New Lows (NL) fell to just 0.5%, also the lowest in recent days.
This divergence suggests an increasing number of stocks are establishing new uptrends while fewer are breaking down, another supporting sign for the bulls.
Weekly and Monthly Breadth: Strong and Stable
-
Weekly Advancers surged to 67.1%, up sharply from 52.9% yesterday.
-
Monthly Advancers reached 72.3%, extending the steady improvement from prior days (69.4% on June 3).
This trend reinforces the medium-term bullish narrative, showing that market gains are not just limited to one-off bursts but have been broad-based over time.
Three-Month Breadth: Momentum Shift in Progress
-
The three-month picture shows 49.2% Advancers vs 50.0% Decliners, nearly balanced — a recovery from the more bearish readings late last week.
-
Stocks up more than 25% over 3 months climbed slightly to 9.7%, while the 25% decliner cohort shrank to 7.2%.
Though still not decisively bullish, the three-month trend shows a shifting momentum away from broad selling pressure.
Conclusion: Healthy Pause After Tuesday's Surge
Today’s breadth shows a slight step back from the euphoric tone of June 3 but remains broadly healthy:
-
Participation above key moving averages is either holding or improving.
-
New highs outpace new lows significantly.
-
Longer-term metrics continue to lean bullish, confirming medium-term resilience.
In summary, this appears to be a healthy pause, not a reversal.
If breadth readings remain this firm or improve, the market may be setting up for further gains, especially if macroeconomic fears (e.g., interest rate cuts) continue to abate.
Next to read: ChartMill Market Monitor News, June 05
211.9
+3.37 (+1.62%)
529.92
+5.13 (+0.98%)
599.14
+6.09 (+1.03%)
Find more stocks in the Stock Screener
IWM Latest News and Analysis
 2 days ago - ChartmillMarket Monitor Trends (SPY, QQQ, IWM) and Breadth June 06
SPY, QQQ both showing a distribution day after yesterday's session (down on above-average volume near the high).
 3 days ago - ChartmillMarket Monitor Trends (SPY, QQQ, IWM) and Breadth June 05
Breadth readings remain firm for now, this appears to be a healthy pause, not a reversal.
 4 days ago - ChartmillMarket Monitor Trends (SPY, QQQ, IWM) and Breadth June 04
Both the QQQ and the SPY broke out above their main resistance levels today.
 6 days ago - ChartmillMarket Monitor Trends (SPY, QQQ, IWM) and Breadth June 02
The indices continue to quote close to their next resistance. While headline indices may show only minor daily fluctuations, the underlying breadth data paints a more fragile picture.
 9 days ago - ChartmillMarket Monitor Trends (SPY, QQQ, IWM) and Breadth May 30
The data from May 29, 2025, confirms that market breadth has rebounded significantly, with strong participation and improving technical metrics across shorter moving averages.
 10 days ago - ChartmillMarket Monitor Trends (SPY, QQQ, IWM) and Breadth May 29
The breadth indicators signal a fragile and reactive market environment, prone to sharp swings and lacking sustained leadership. Bullish momentum may struggle to gain lasting traction.
 11 days ago - ChartmillMarket Monitor Trends (SPY, QQQ, IWM) and Breadth May 28
The May 27 surge in breadth confirms the bullish price action observed across major indices on that day, reinforcing the move’s credibility.
 13 days ago - ChartmillMarket Monitor Trends (SPY, QQQ, IWM) and Breadth May 26
The latest data show a market that is weakening internally, with fewer stocks supporting any upside and an increasing tilt toward broad-based selling.
 16 days ago - ChartmillMarket Monitor Trends (SPY, QQQ, IWM) and Breadth May 23
The market is in a cautious phase with waning momentum.
 17 days ago - ChartmillMarket Monitor Trends (SPY, QQQ, IWM) and Breadth May 22
The broad-based selling on May 21 wasn't a surprise, it was preceded by several days of narrowing breadth.
 18 days ago - ChartmillMarket Monitor Trends (SPY, QQQ, IWM) and Breadth May 21
While the major indices are holding up, breadth is beginning to diverge and fewer stocks are driving the rally, market participation is waning.
 19 days ago - ChartmillMarket Monitor Trends (SPY, QQQ, IWM) and Breadth May 20
Markets continued to show resilience at the start of the week, with all major indices maintaining their short-term bullish trends.
