Market Monitor Trends and Breadth June 30 BMO
By Kristoff De Turck - reviewed by Aldwin Keppens
Last update: Jun 30, 2025
(All data & visualisations by ChartMill.com)
Daily Market Trend Analysis – June 27, 2025 (After Market Close)
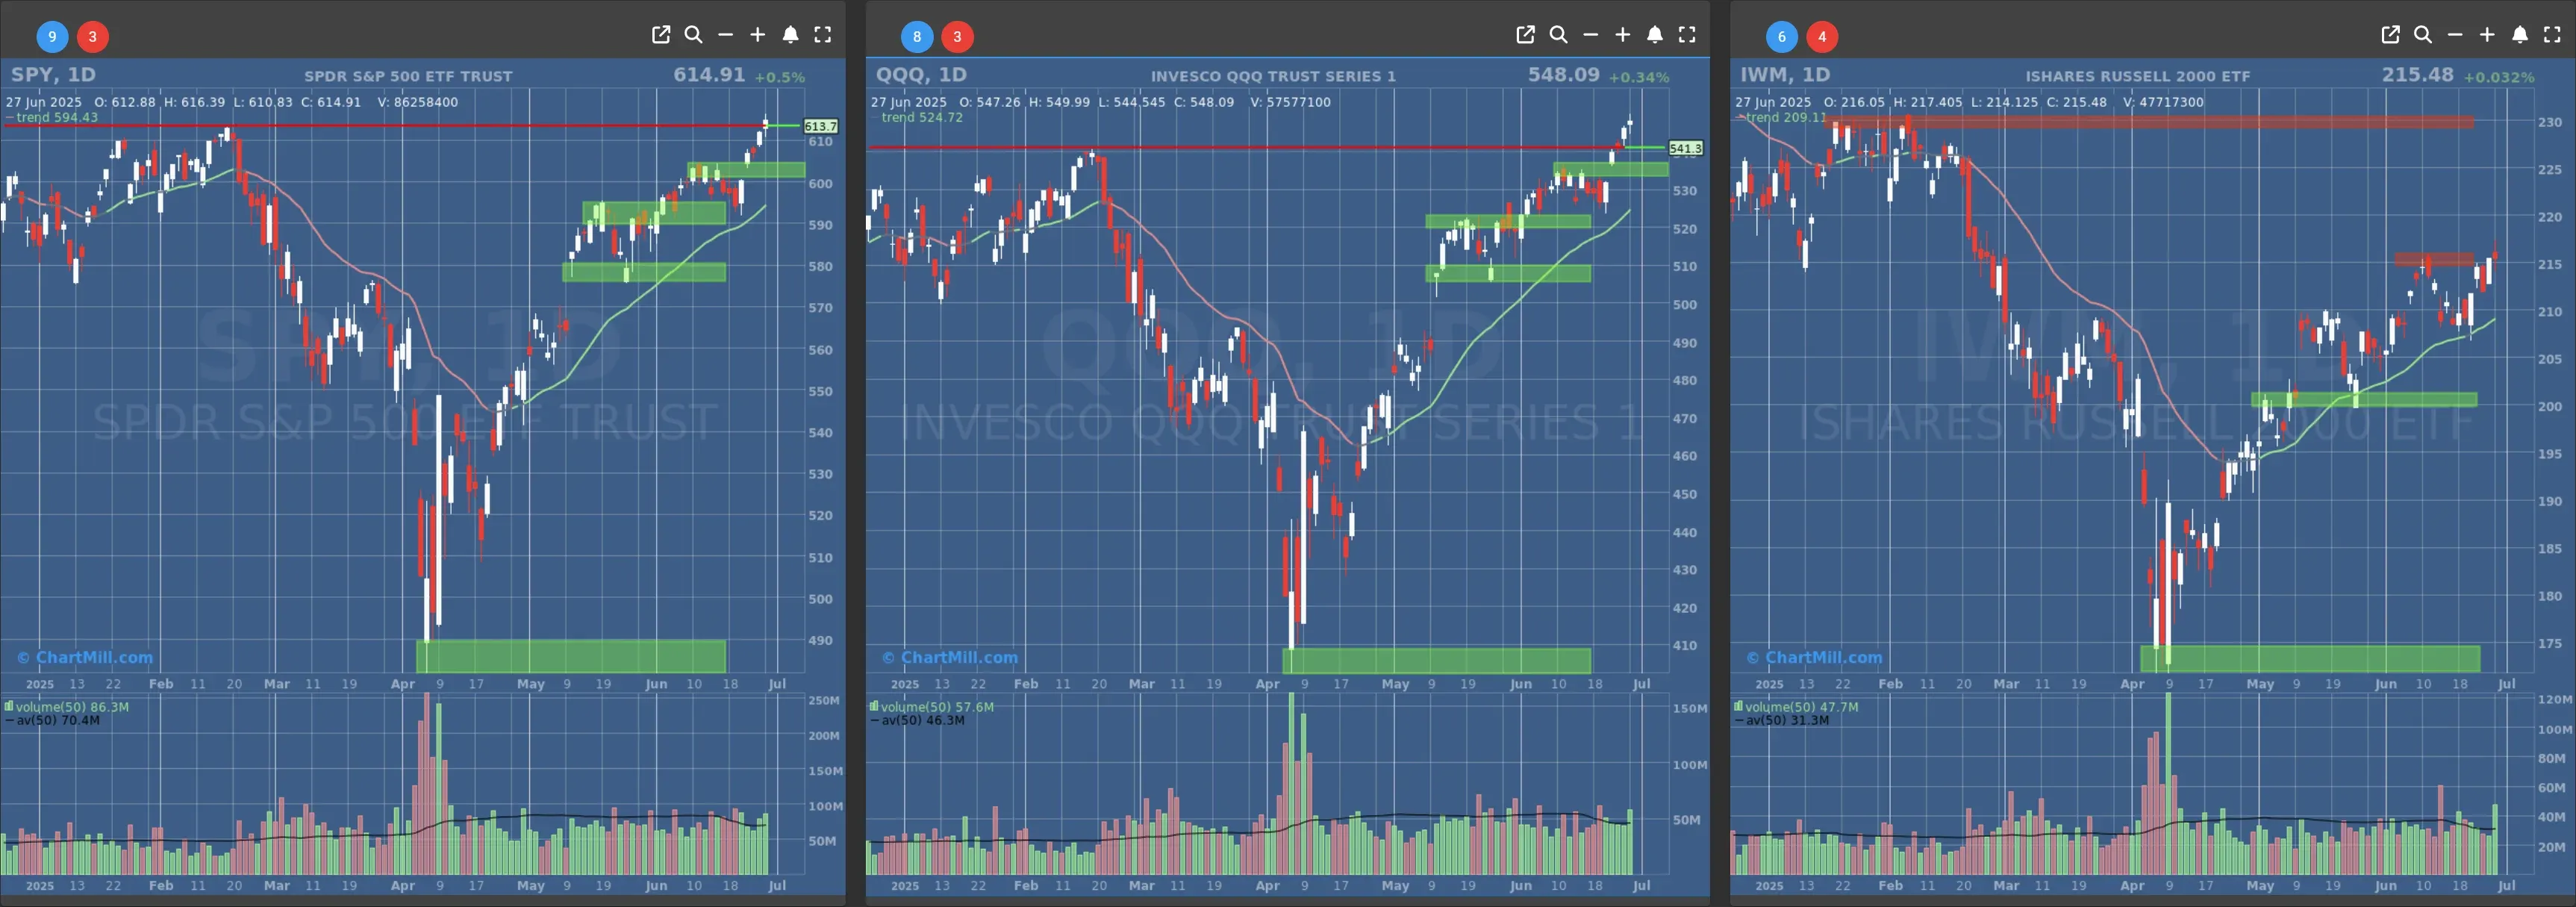
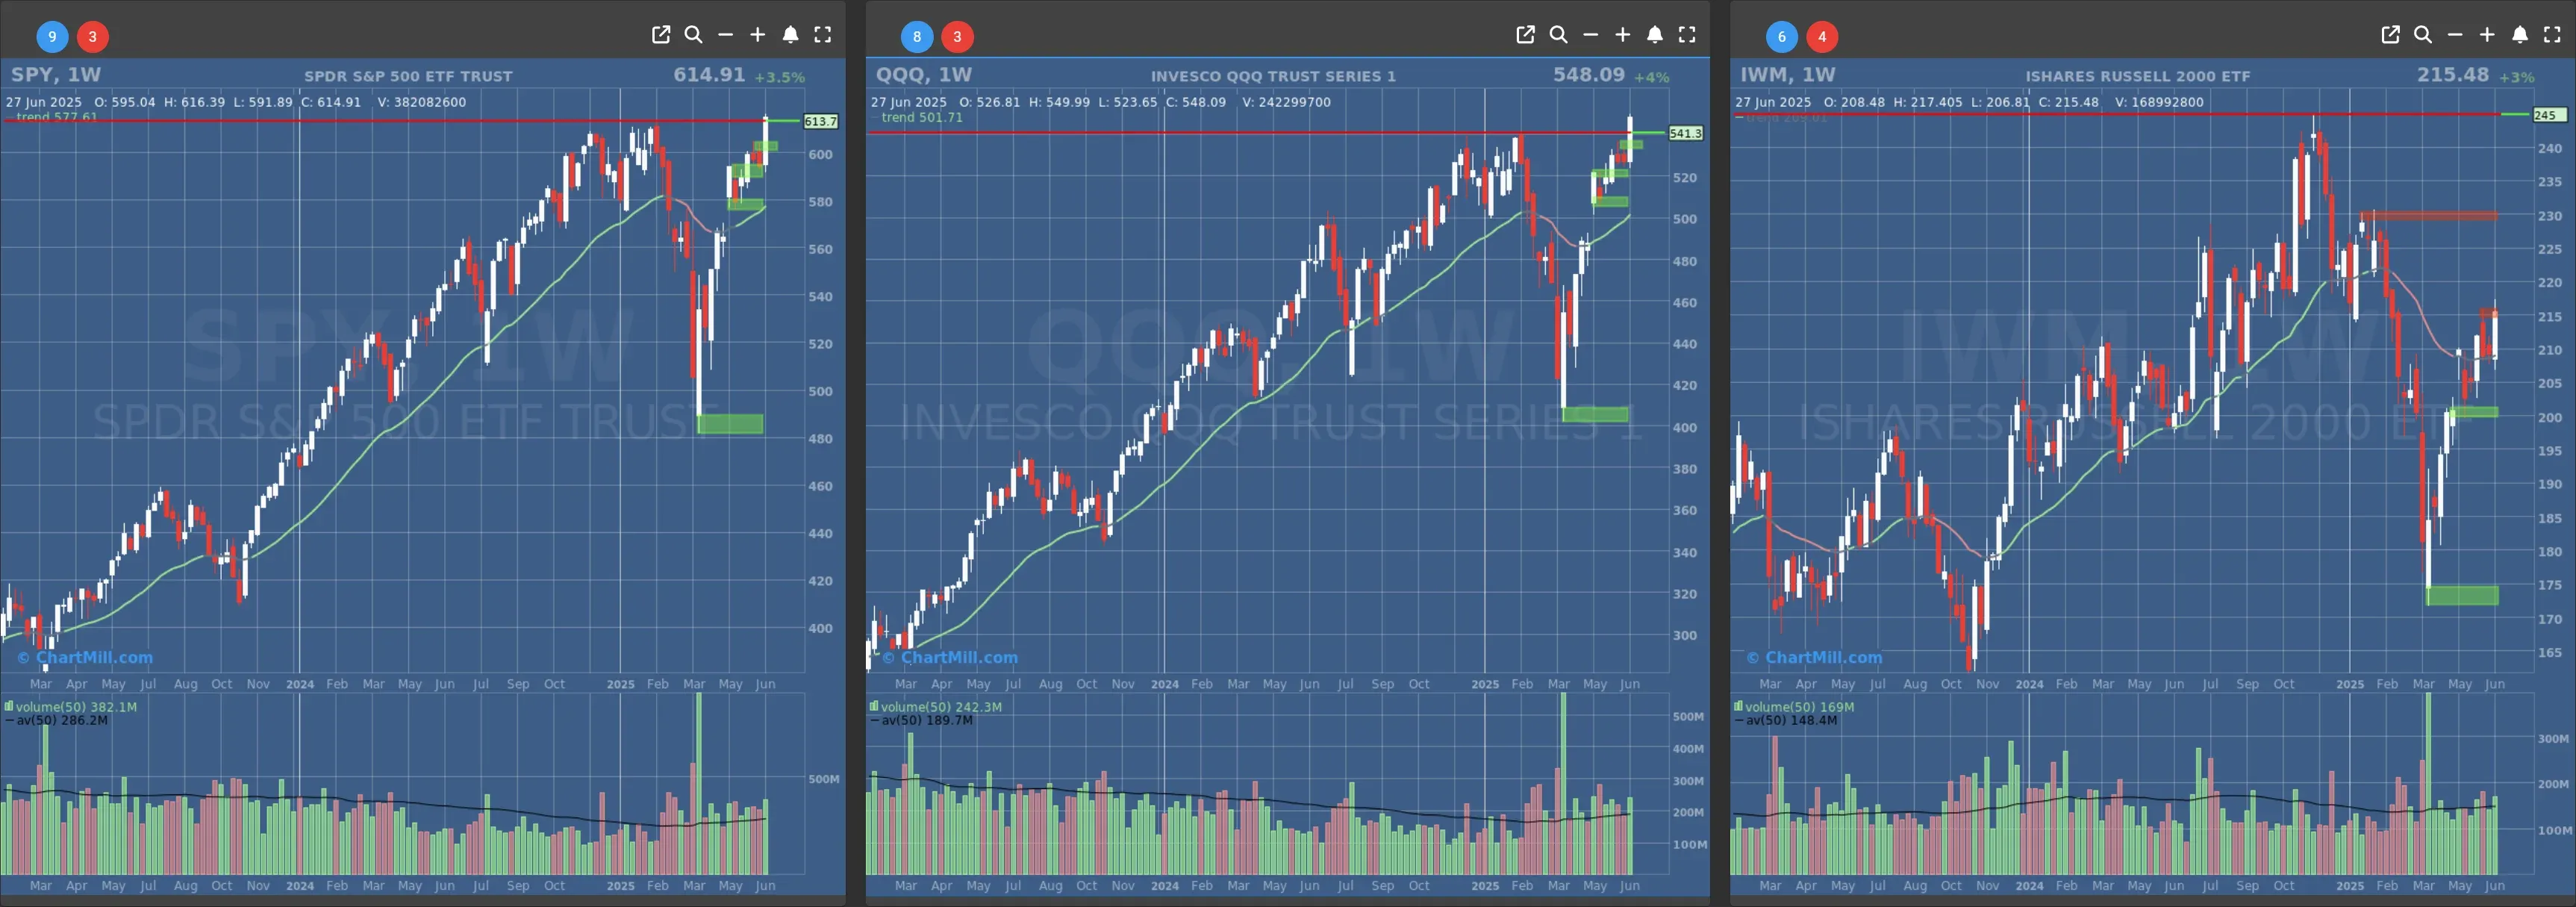
New All Time High for SPY!
Short Term Trend
- Short-Term Trend: Bullish (no change)
- Next Support at $580
- Next Resistance at $610
- Volume: Significant Above Average (50)
- Pattern: New All Time High
- Short-Term Trend: Bullish (no change)
- Next Support at $520
- Next Resistance at $540
- Volume: Significant Above Average (50)
- Pattern: Doji Candle, Up Day
- Short-Term Trend: Bullish (no change)
- Next Support at $210 & $205
- Next Resistance at $215 & $230
- Volume: Strong Above Average (50)
- Pattern: Doji Candle, struggling at resistance
Long Term Trend
- Long-Term Trend: Positive (no change)
- Long-Term Trend: Positive (no change)
- Long-Term Trend: Neutral (no change)
Daily Market Breadth Analysis – June 27, 2025 (After Market Close)
Stocks Hold the Line, but Under the Surface? Mixed Signals Persist
After Wednesday's bullish breadth blowout, Thursday's market action (June 27, 2025) looked… decent on the surface. But just like a duck gliding across a pond, the real story lies beneath the waterline.
Let’s dissect the numbers and see what’s really happening under the hood of this rally.
Headline Breadth: Holding Up, But Without Conviction
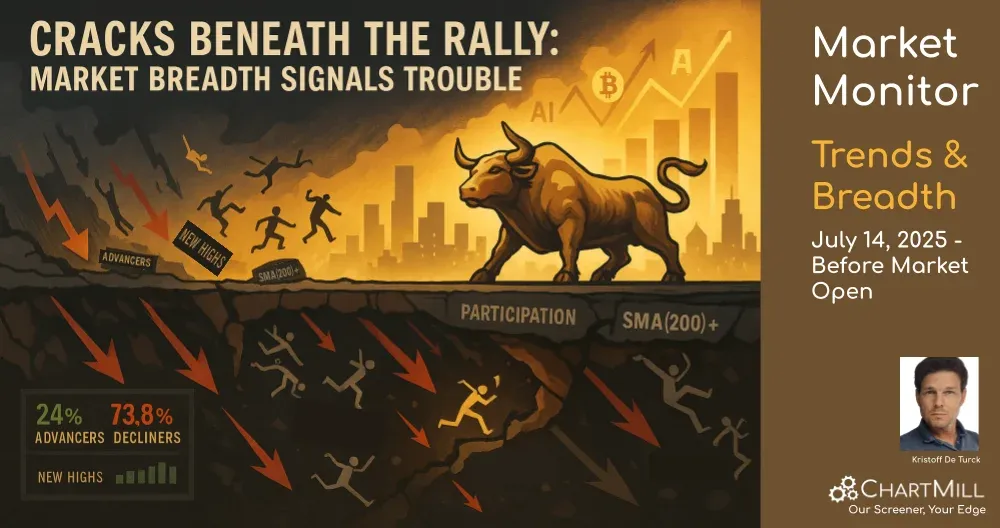
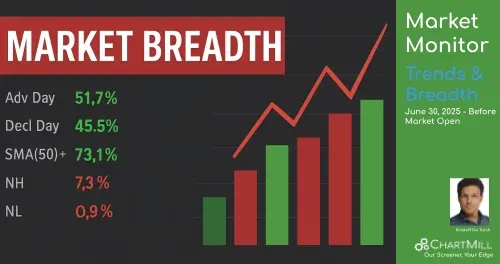
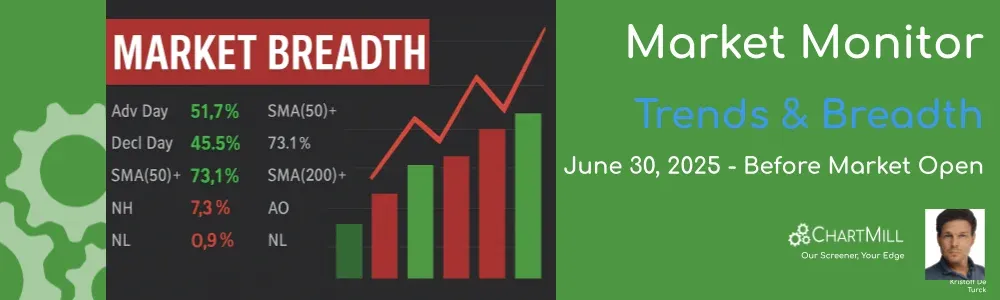
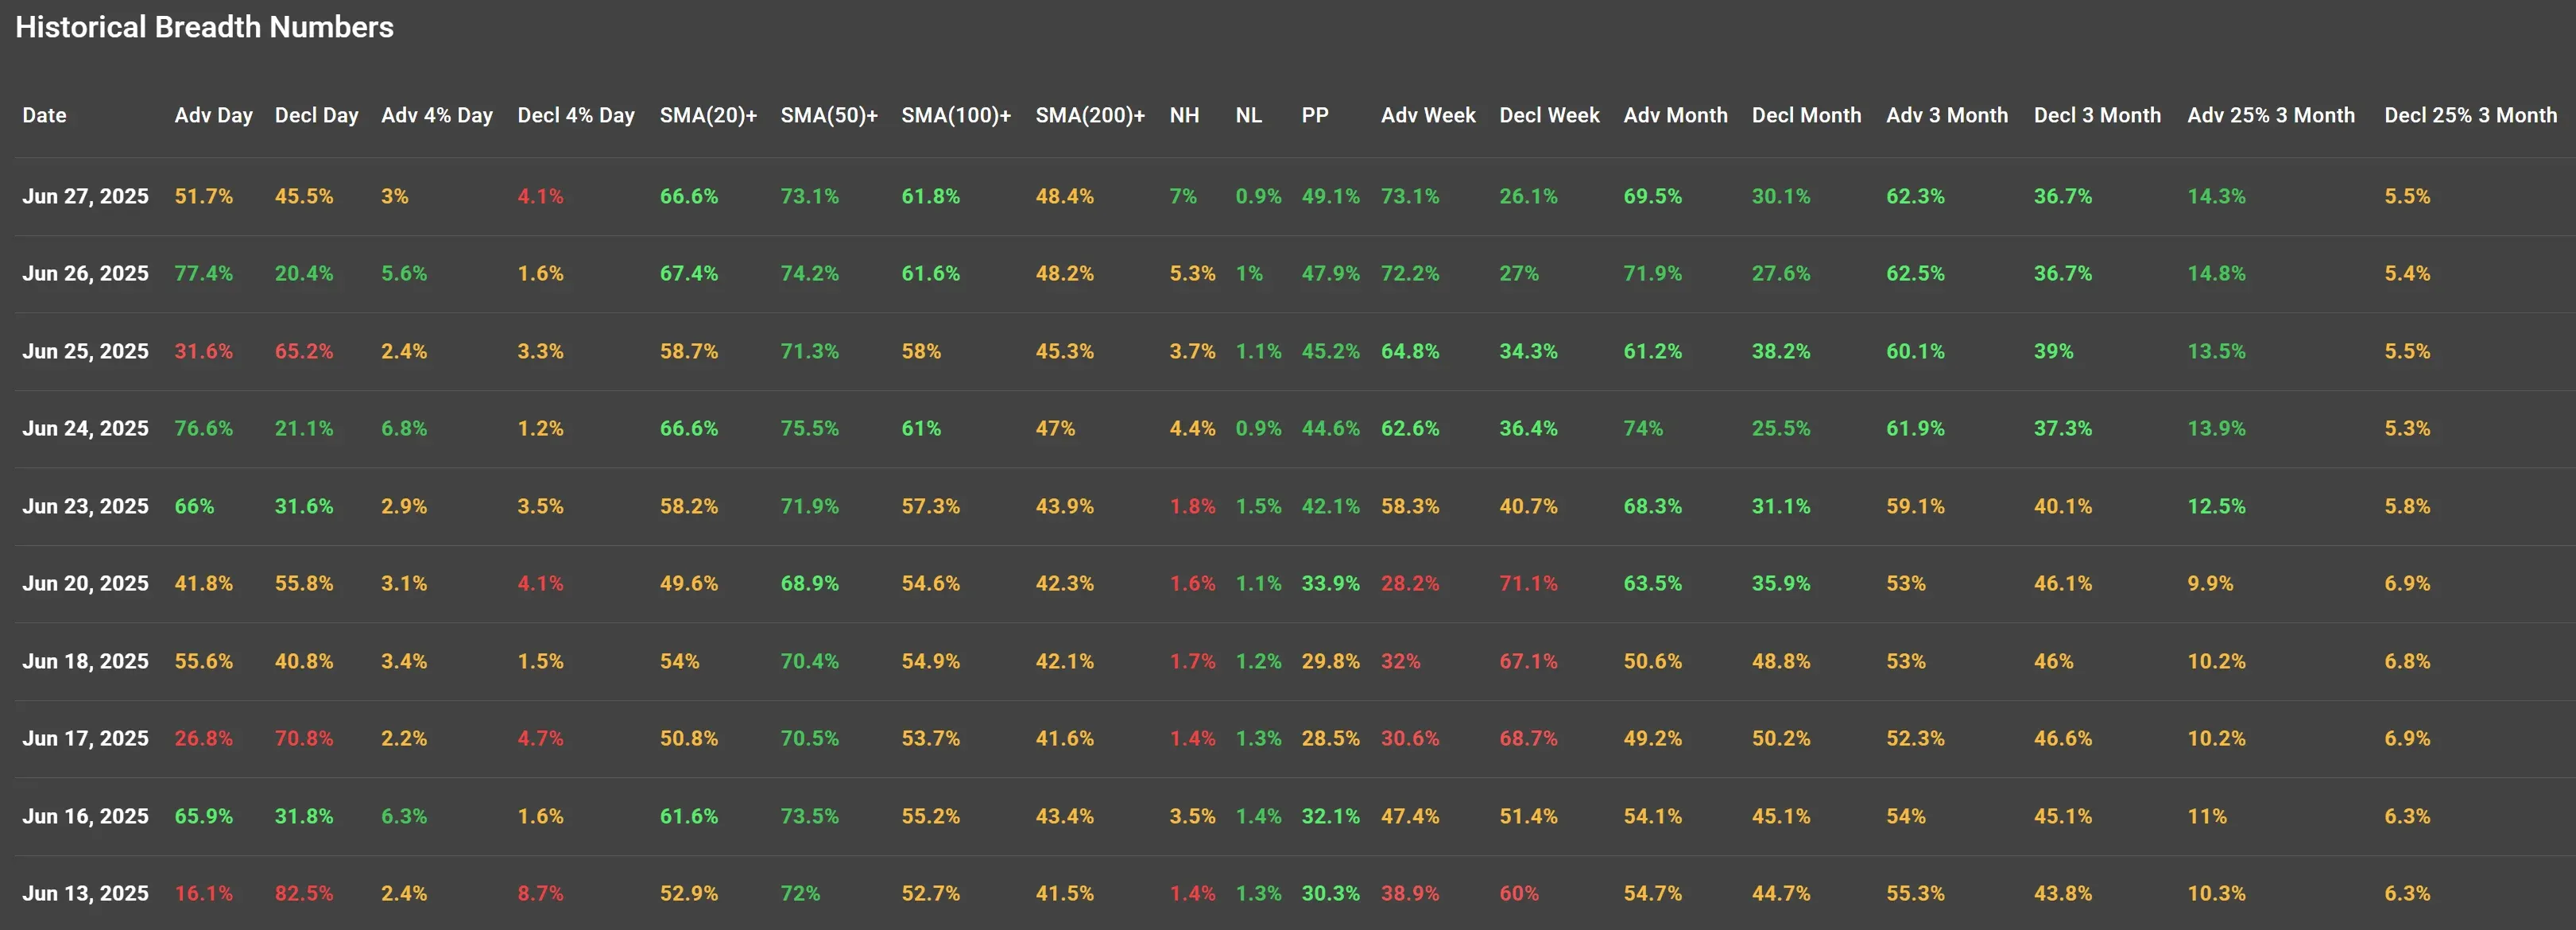
On Thursday, 51.7% of stocks advanced while 45.5% declined, technically a positive day, but just barely. This marks a clear pullback from Wednesday’s bullish burst where 77.4% of stocks finished green.
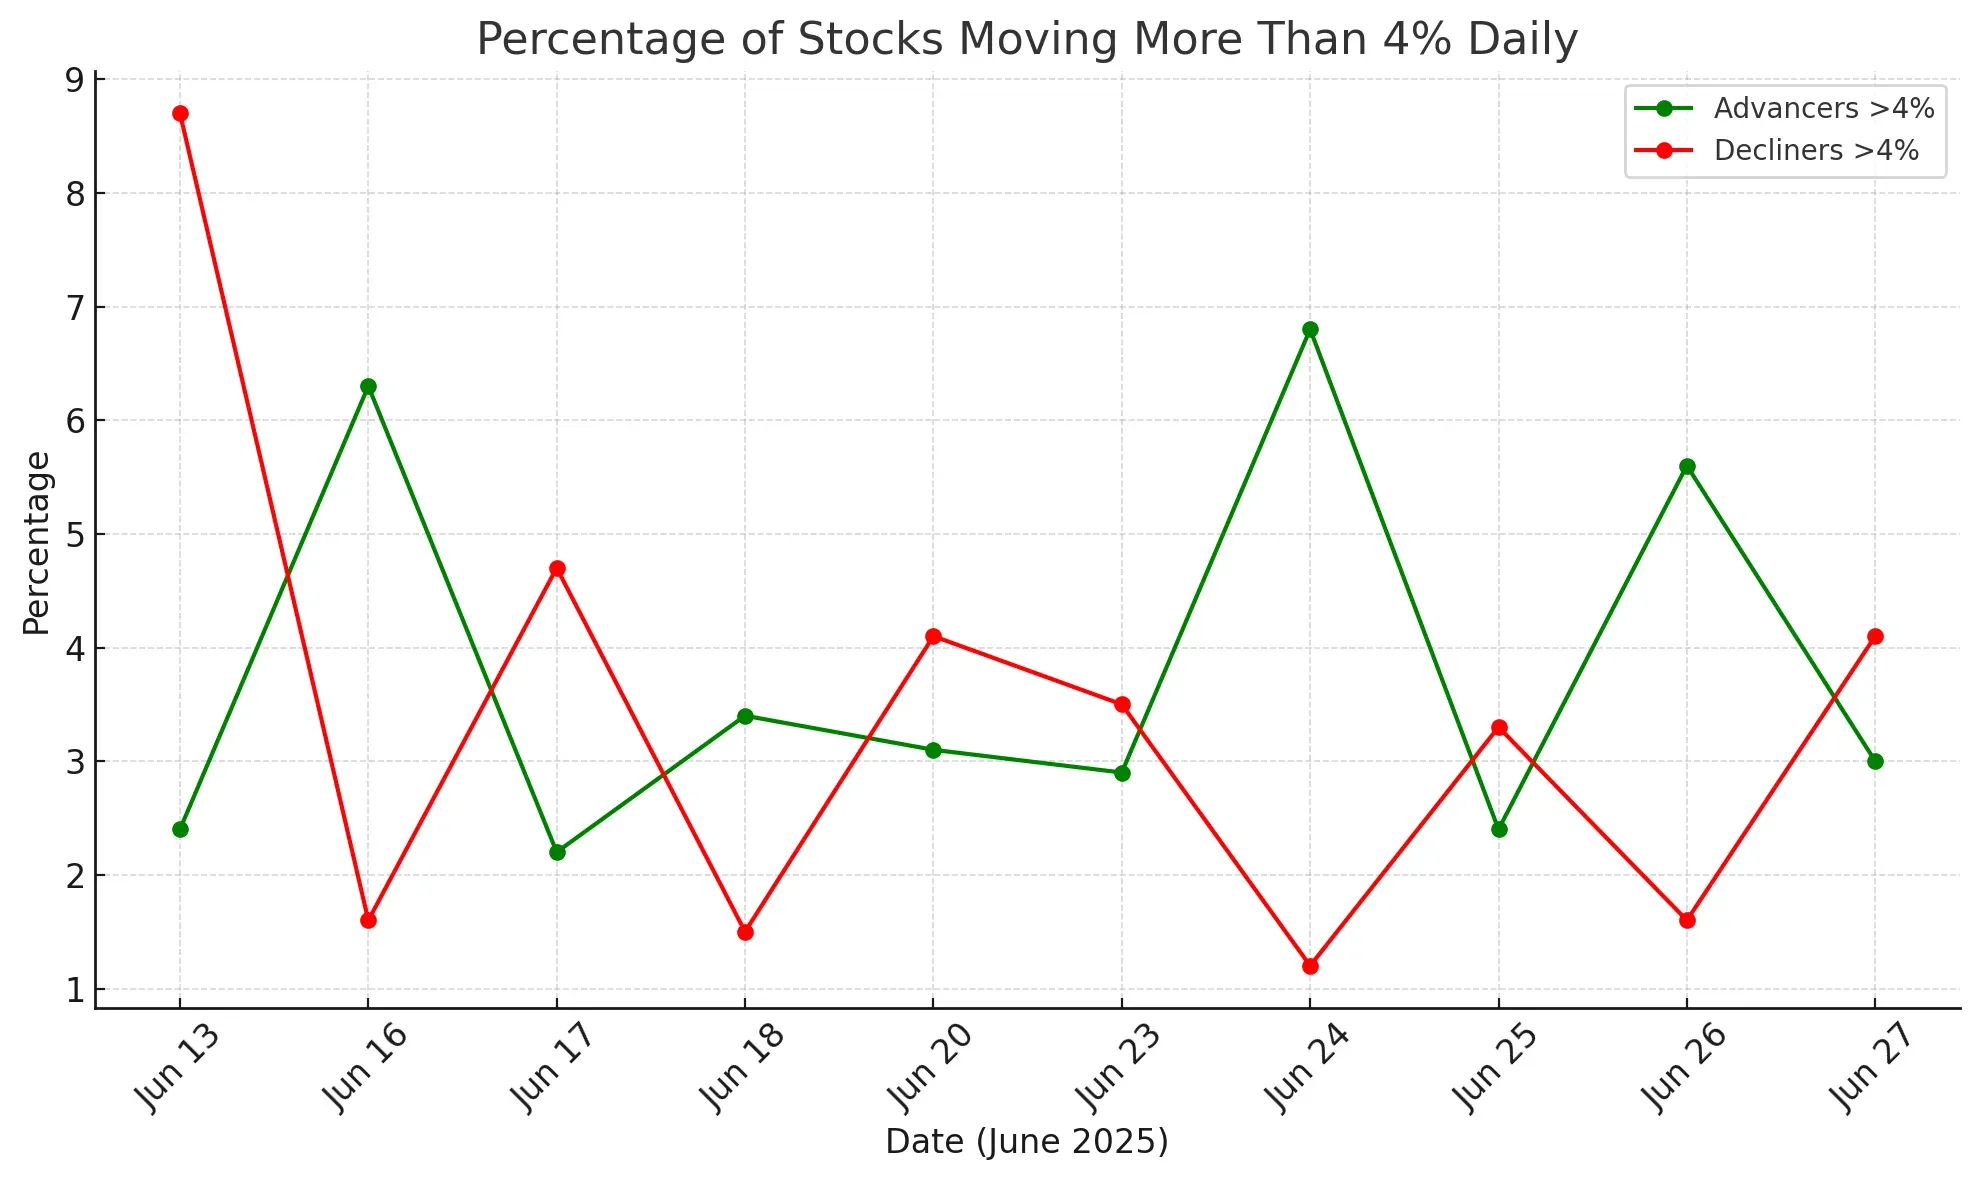
More importantly, the percentage of stocks up more than 4% dropped sharply to just 3% (from 5.6%), while decliners over 4% climbed to 4.1%, the highest since June 20. This divergence hints at a lack of upside momentum in individual names, even as the broader indices hit fresh highs.
Short-Term Strength: Still Above Water
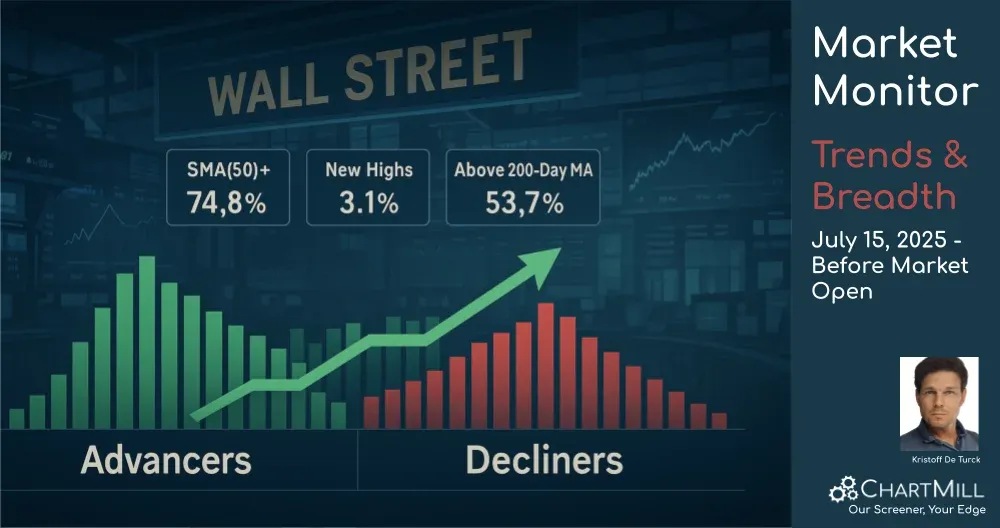
Breadth above key moving averages continues to support the idea of market health in the short term:
-
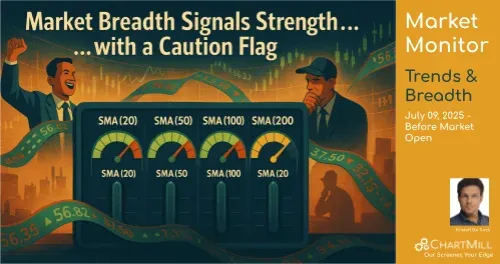
66.6% of stocks are above their 20-day SMA, barely changed from Wednesday (67.4%).
-
73.1% are above the 50-day SMA, also relatively flat.
-
61.8% sit above their 100-day SMA, maintaining strength.
-
However, SMA(200)+ at 48.4% shows that just under half of all stocks remain above long-term support—a subtle reminder that not everything is riding this rally equally.
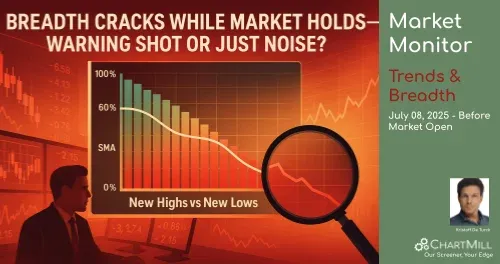
New Highs vs. New Lows: Not Much Follow-Through
-
New Highs (NH): Up slightly to 7%, the highest in over a week. Encouraging, but modest.
-
New Lows (NL): Still suppressed at 0.9%, unchanged.
This tiny bump in highs is a positive signal, but not yet convincing in scale.
Short-Term Trend: Weekly and Monthly Data Support Bulls
The weekly advance/decline picture remains strong:
-
73.1% of stocks rose over the past week, a continuation of Wednesday’s 72.2%.
-
The monthly advancers (69.5%) still heavily outnumber decliners (30.1%), although the rate of change has slowed slightly.
This kind of persistence over multiple time frames supports the case that institutional buying is not just speculative, it’s still active.
3-Month Momentum: Slight Cooling
The 3-month advance number ticked down slightly to 62.3%, while decliners in the same window rose to 36.7%. Nothing alarming here, but it’s worth watching in coming sessions to see if more rotation is underway.
The top quartile remains stable with 14.3% of stocks up more than 25% in the past 3 months, a solid showing for this stage of the cycle.
Key Takeaways
Momentum is still intact, but leadership is narrowing. The declining number of strong advancers (>4%) and flatline in new highs vs. lows suggest some fatigue.
Short-term support levels are being maintained, but we’re seeing no real surge in new participation. The market is grinding higher, but not without effort.
The drop from Wednesday’s near-euphoric breadth could be a one-day pause… or the start of rotation out of overbought names.
Conclusion:
While Thursday’s action technically kept bulls in control, the internals hint at potential stress. Fewer big winners, a slight rise in big losers, and a flattening breadth curve all tell me one thing: be selective.
The rally may be intact, but it's no longer lifting all boats. Don't mistake a rising tide for rising conviction.
I’ll be watching closely to see if the next few sessions deliver fresh leadership, or just more of the same under-the-hood divergence.
Stay sharp.
Kristoff - Co-founder, ChartMill
Next to read: Market Monitor News, June 30
218.82
-4.37 (-1.96%)
556.72
+0.51 (+0.09%)
622.14
-2.67 (-0.43%)
Find more stocks in the Stock Screener
IWM Latest News and Analysis