Market Monitor Trends (SPY, QQQ, IWM) and Breadth June 12
By Kristoff De Turck - reviewed by Aldwin Keppens
Last update: Jun 12, 2025

(All data & visualisations by ChartMill.com)
Daily Market Trend Analysis – June 11, 2025 (After Market Close)
SPY and QQQ opened with a gap up but could not hold those opening gains and ended up closing slightly lower.
IWM also ended the trading day slightly negative (-0.4%). However, a bearish engulfing topping pattern was formed.
Short Term Trend
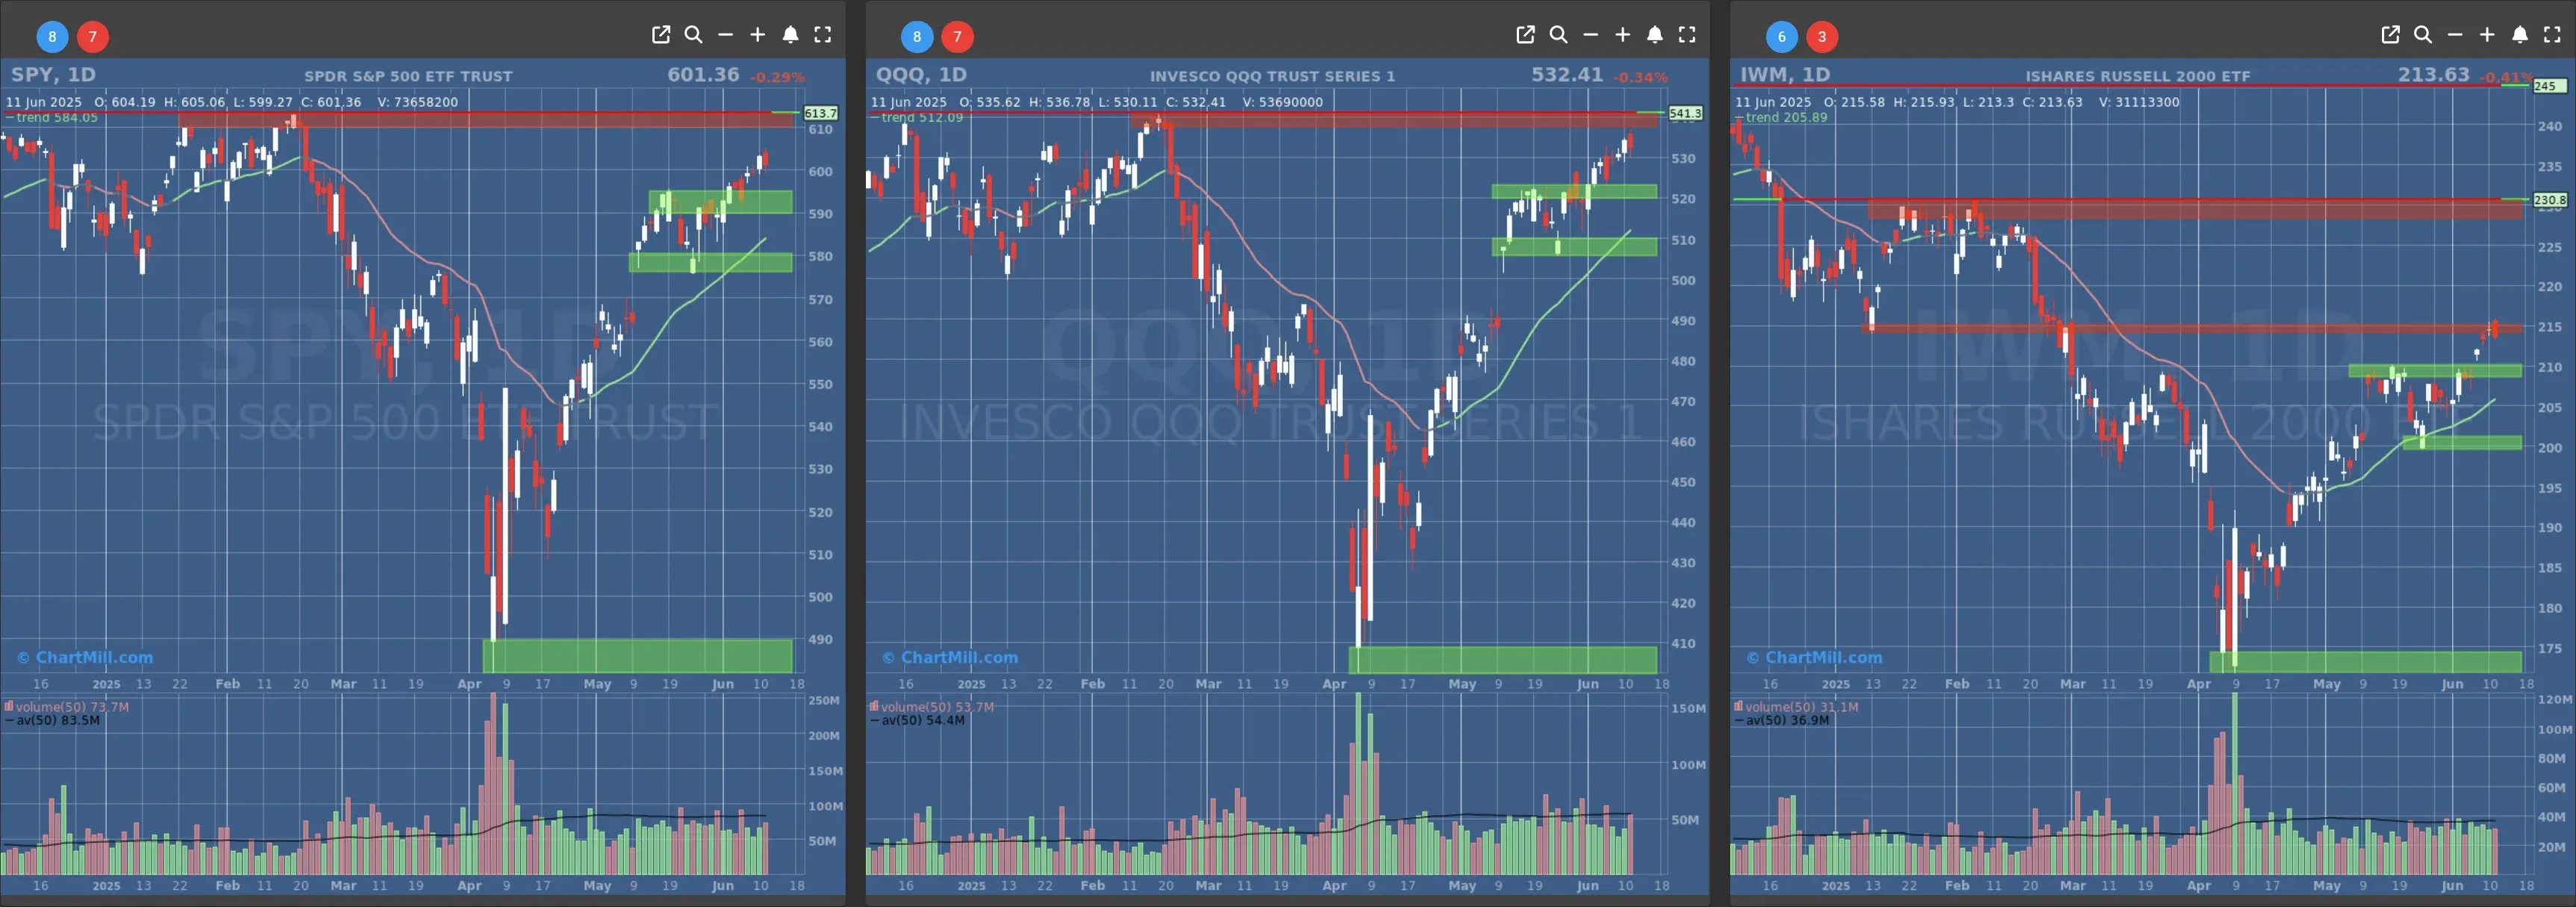
- Short-Term Trend: Bullish (no change)
- Next Support at $580
- Next Resistance at $610
- Volume: Slightly Below Average (50)
- Pattern: Down Day
- Short-Term Trend: Bullish (no change)
- Next Support at $520
- Next Resistance at $540
- Volume: At Average (50)
- Pattern: Down Day
- Short-Term Trend: Bullish (no change)
- Next Support at $210 & $205
- Next Resistance at $215 & $230
- Volume: Slightly below Average (50)
- Pattern: Bearish Engulfing Candle, at resistance
Long Term Trend
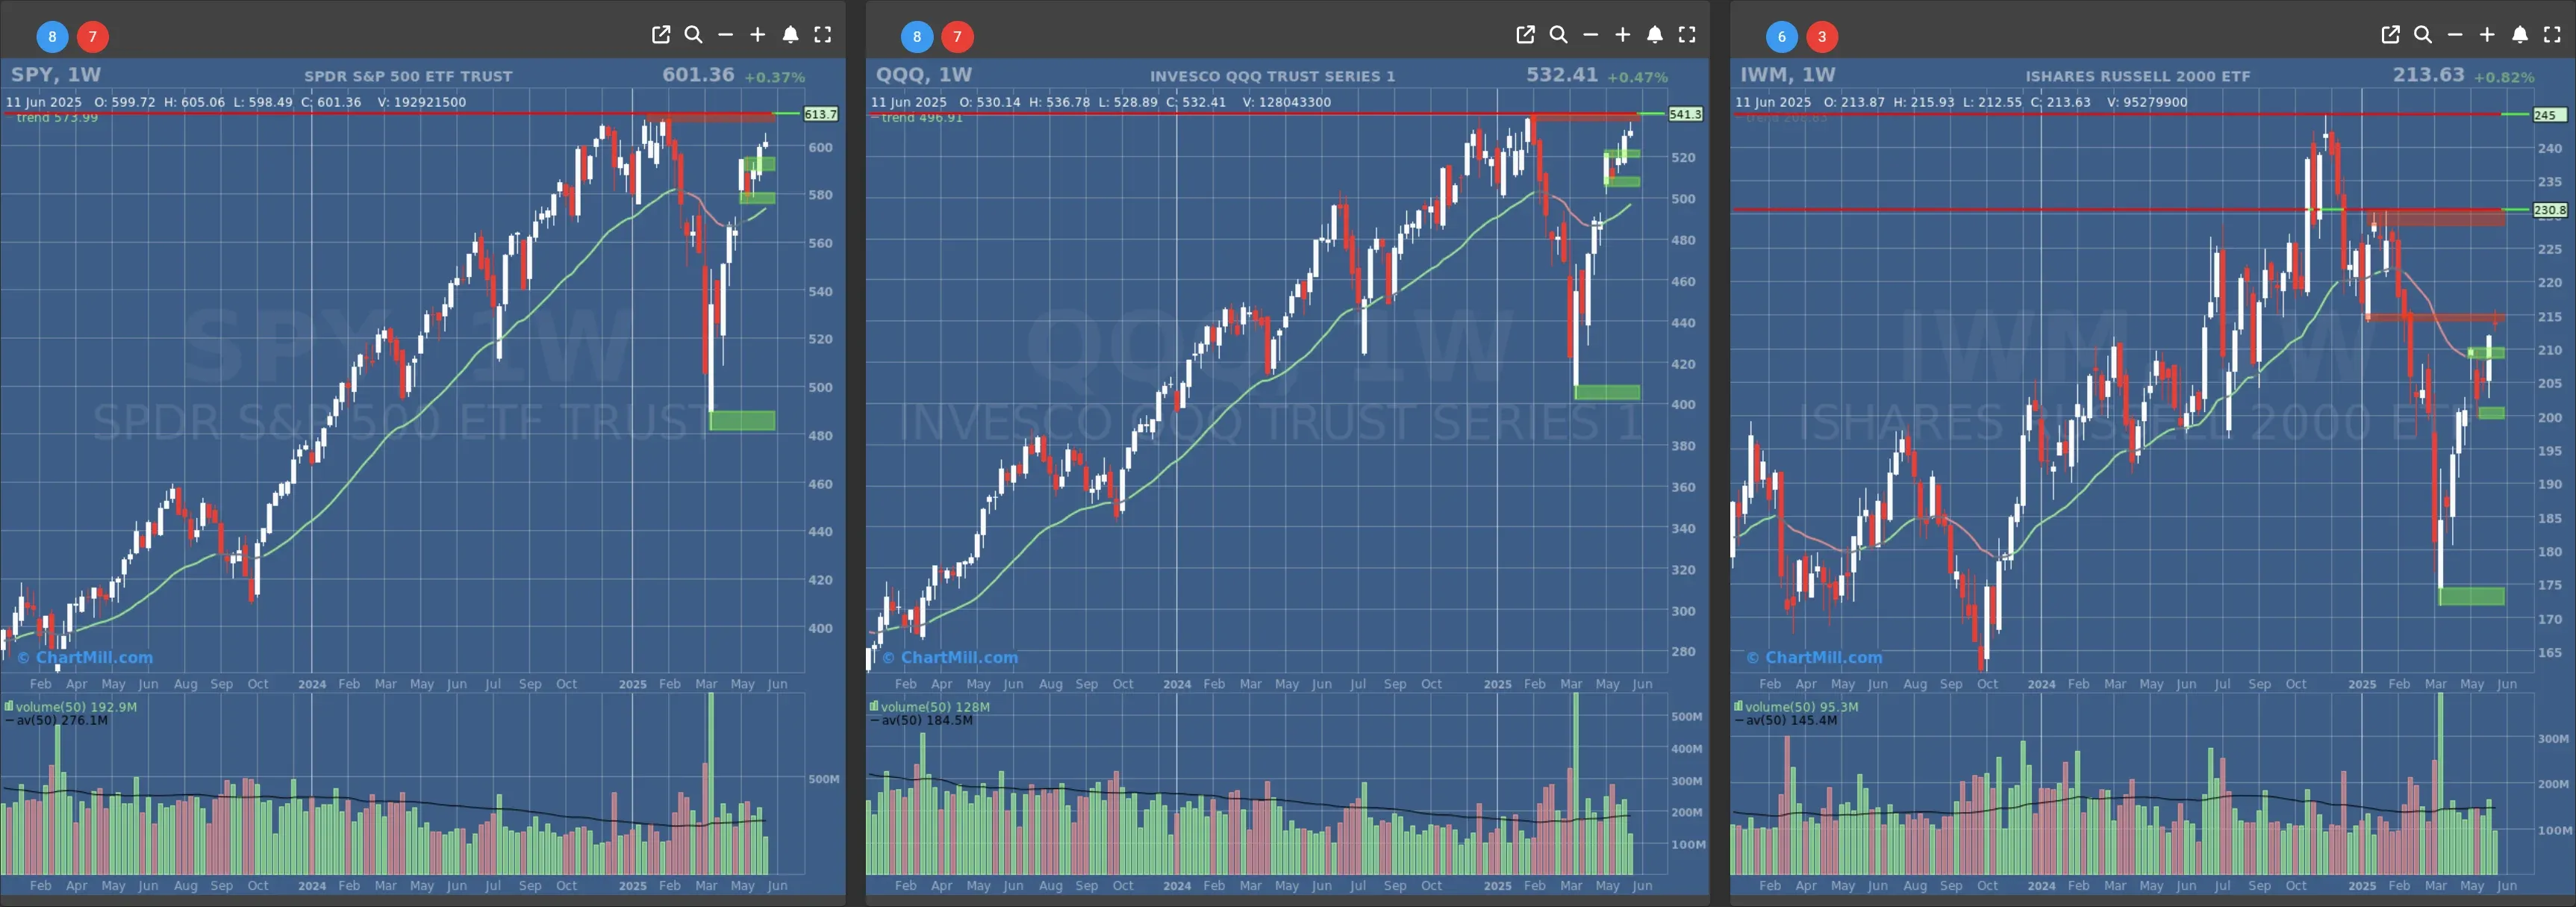
- Long-Term Trend: Positive (no change)
- Long-Term Trend: Positive (no change)
- Long-Term Trend: Neutral (no change)
Daily Market Breadth Analysis – June 11, 2025 (After Market Close)
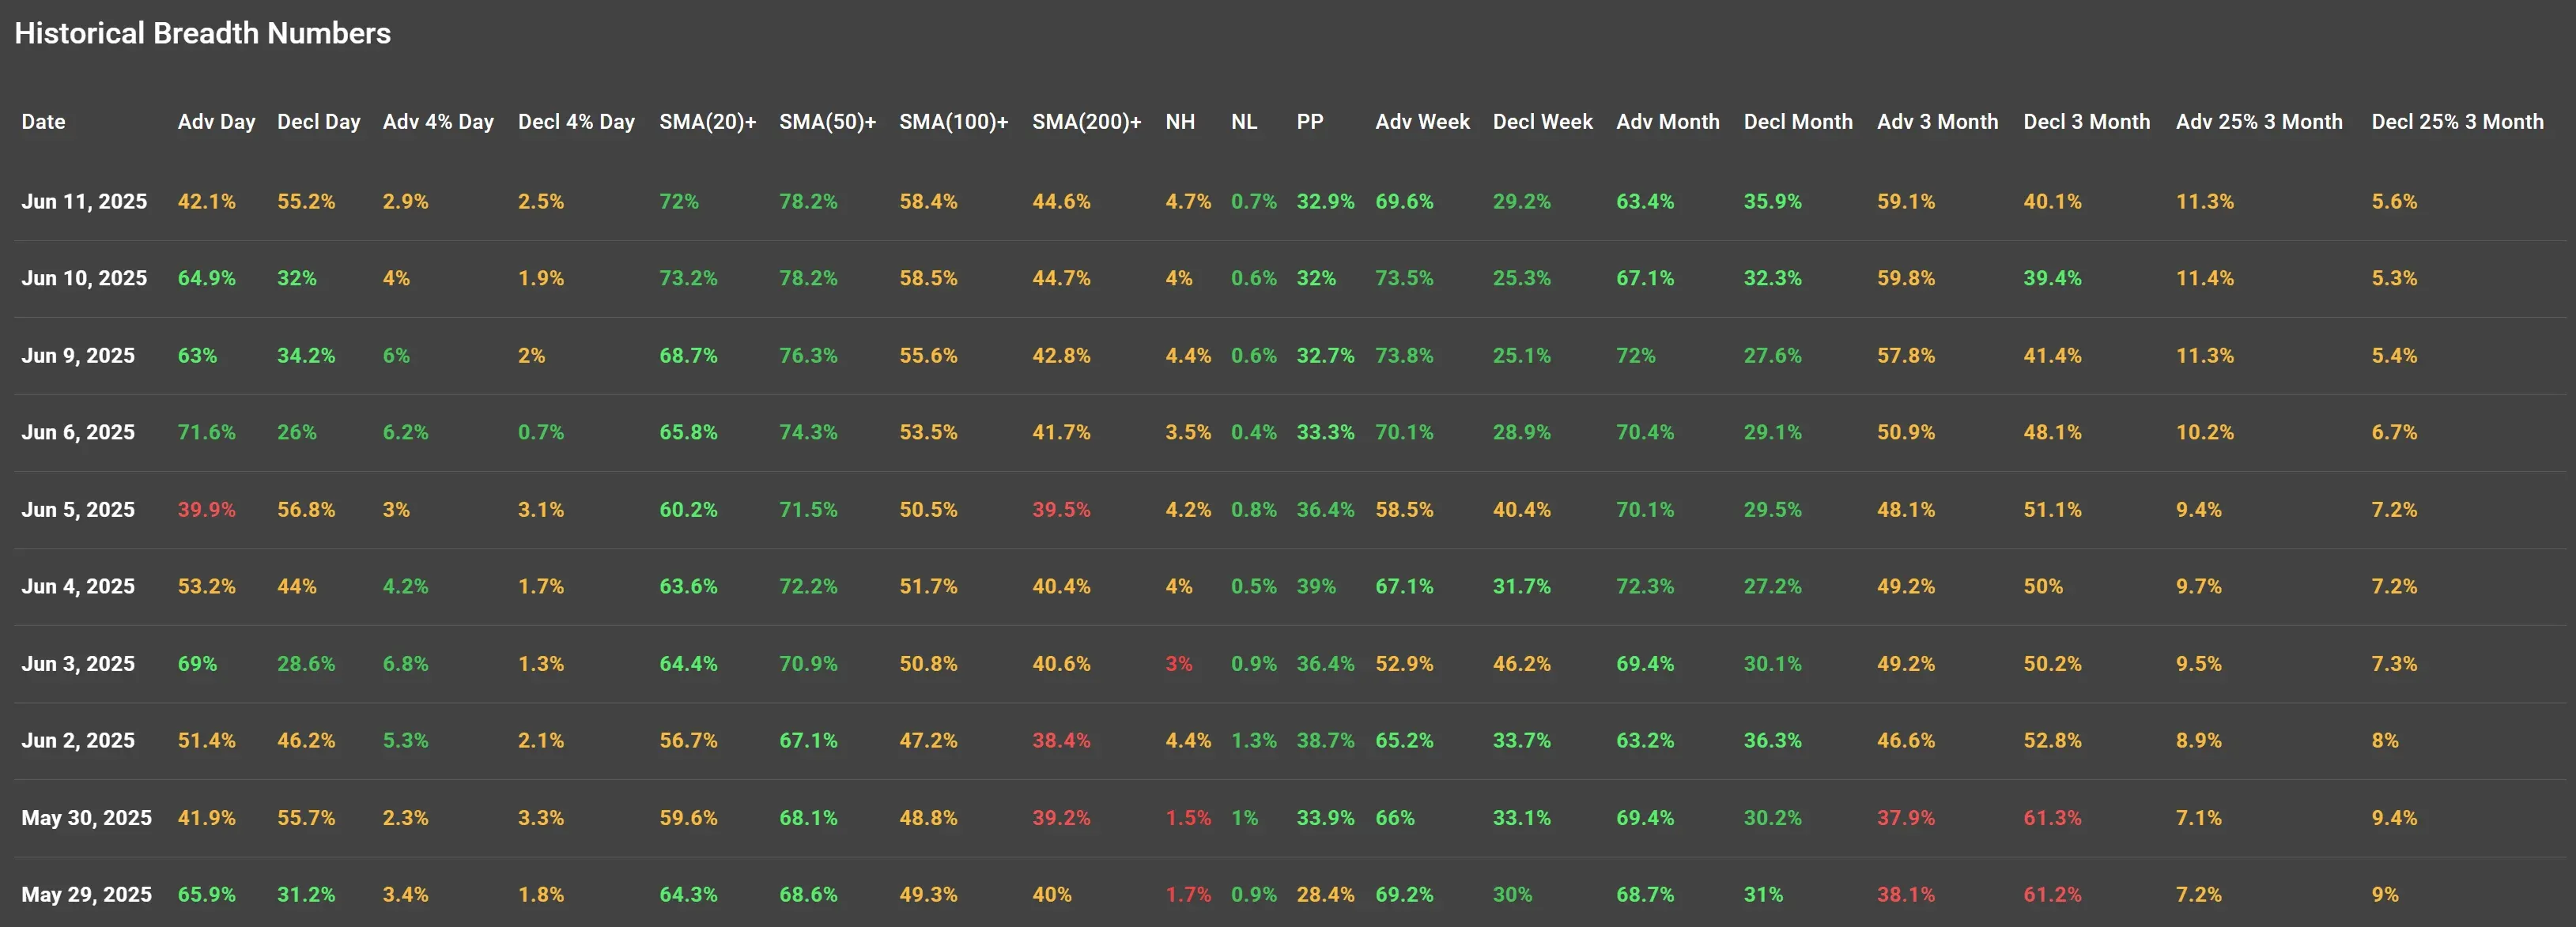
Reversal from Broad-Based Strength
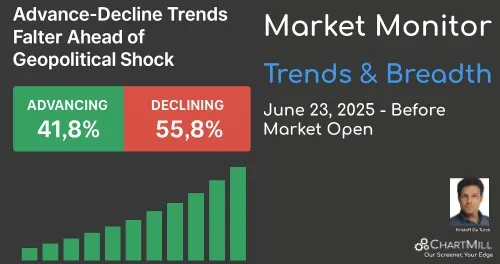
The latest session (June 11, 2025) showed a clear deterioration in market breadth compared to earlier this week. Only 42.1% of stocks advanced, down sharply from 64.9% the previous day and 71.6% on June 6.
Decliners surged to 55.2%, highlighting the shift in sentiment.
This marks a reversal of the strong participation seen in the prior analysis, where we observed three consecutive days of 63%+ advancing stocks, a signal that bullish momentum may have peaked for now.
Under the Surface: Still Above Support
Despite the weak daily performance, the percentage of stocks trading above key moving averages remains strong:
-
SMA(20)+: 72.0%
-
SMA(50)+: 78.2%
-
SMA(100)+: 58.4%
-
SMA(200)+: 44.6%
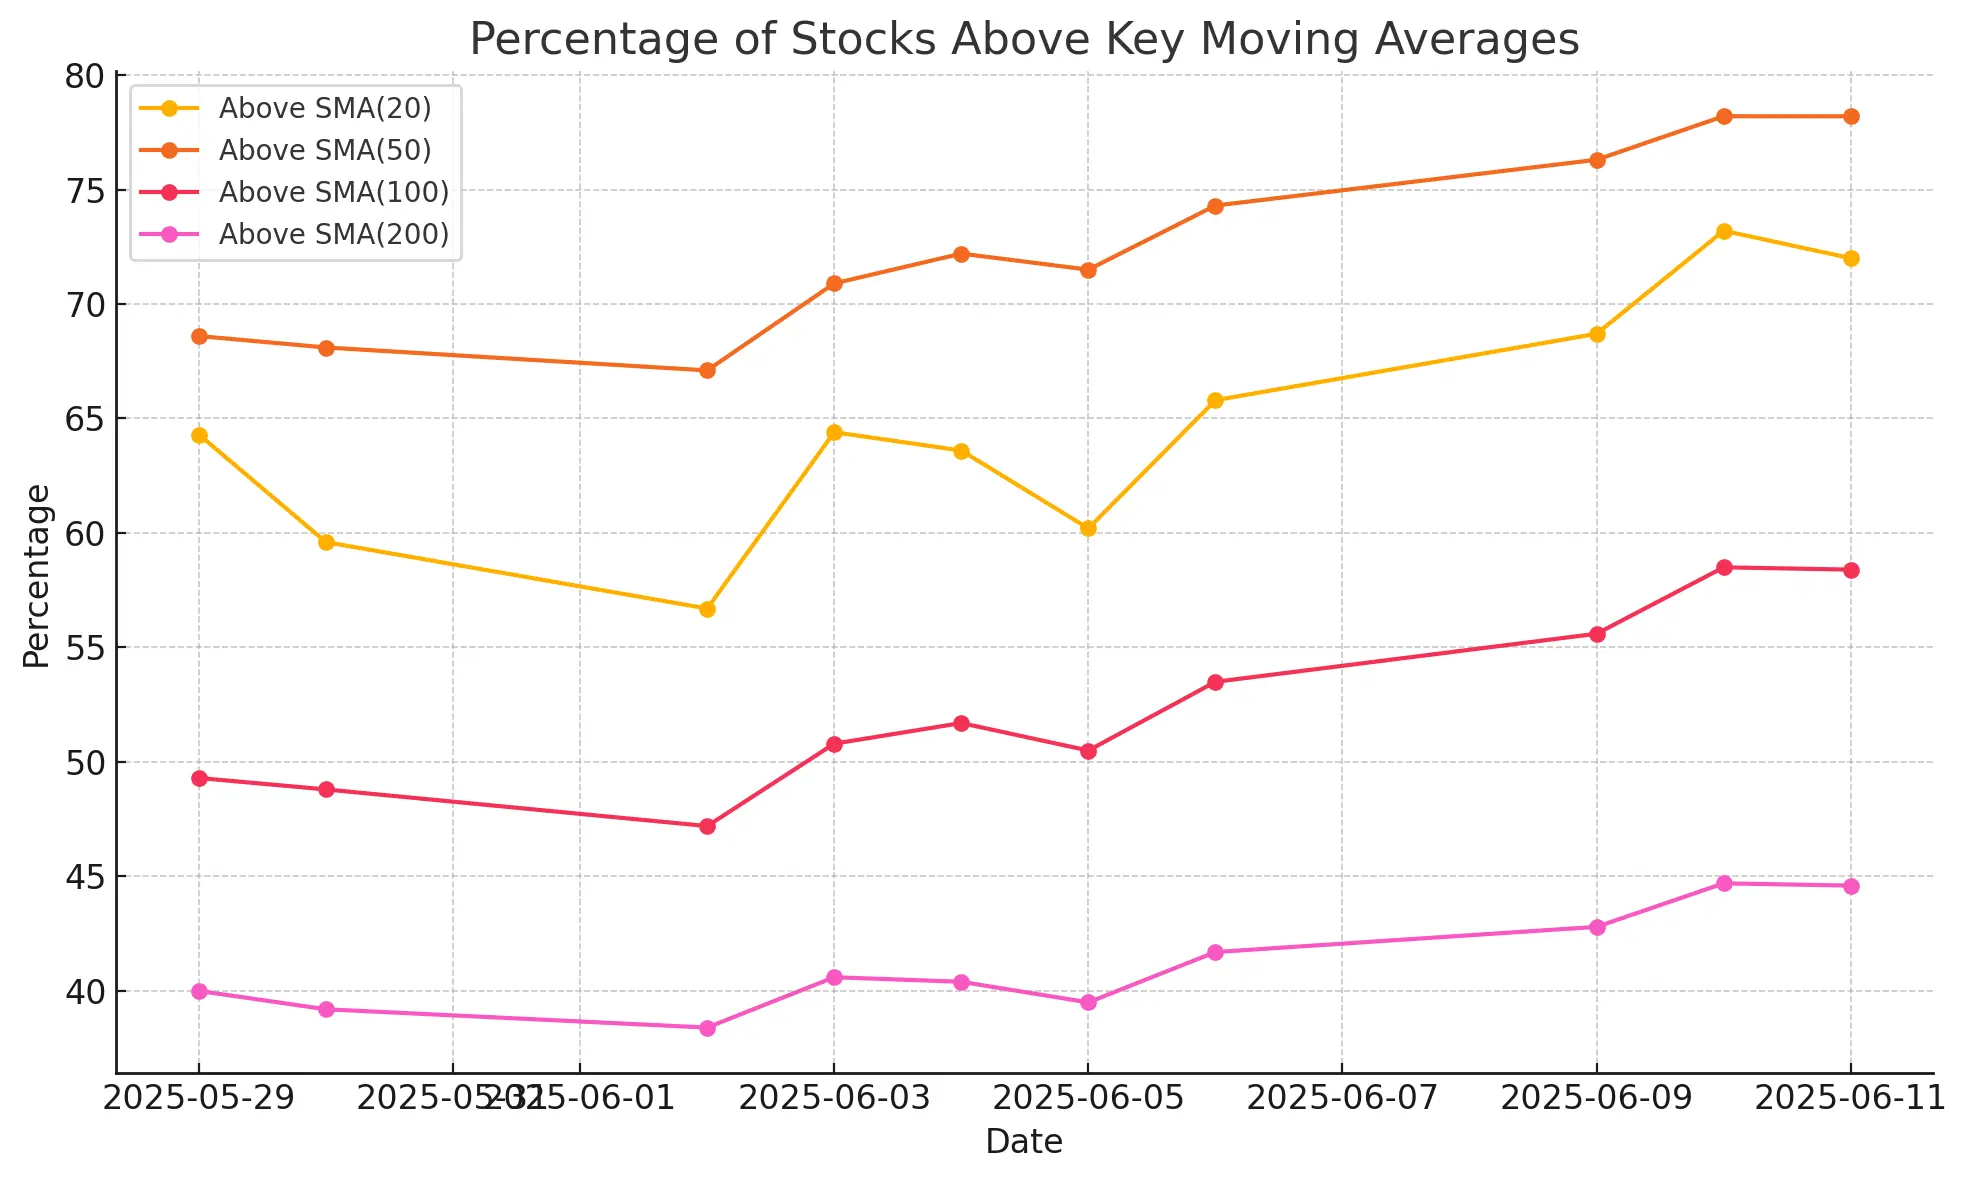
As shown in the chart, these indicators have been climbing steadily for over a week and have held steady despite today's pullback. This suggests that the recent weakness may still be a pause in an ongoing bullish structure rather than a trend reversal.
Narrowing Highs vs Lows Spread
New Highs (NH) crept up slightly to 4.7%, while New Lows (NL) ticked up to 0.7%. Although still tilted positively, this is the first day in over a week where new lows expanded meaningfully.
Continued erosion here would be a red flag.
Momentum Slowing on Longer Timeframes
While short-term breadth weakened, medium- and long-term trends are beginning to show cracks too:
-
Advancing 1-week: 69.6% (down from 73.8% on June 9)
-
Advancing 1-month: 63.4% (down from 72.3% on June 4)
-
Advancing 3-month: 59.1% (flattish)
-
Adv. 25% over 3-month: 11.3% (holding steady)
This cooling momentum, especially over 1-week and 1-month horizons, reflects a market digesting prior gains.
Interpretation & Outlook
The market breadth picture on June 11 signals a short-term pullback, not (yet) a breakdown. While fewer stocks participated in gains today, most remain above key moving averages, and longer-term momentum is holding. However, the declining trend in new highs and flattening of 3-month leaders warrants caution.
From the June 10 analysis, where we noted broad and sustained strength, we now face a “cooling-off” period that could evolve into either a healthy consolidation, or something more corrective, depending on whether breadth resumes upward.
Next to read: Market Monitor News, June 12
NYSEARCA:IWM (6/23/2025, 11:21:10 AM)
209.97
+0.76 (+0.36%)
NASDAQ:QQQ (6/23/2025, 11:21:10 AM)
529.775
+2.94 (+0.56%)
NYSEARCA:SPY (6/23/2025, 11:21:10 AM)
597.435
+3.15 (+0.53%)
Find more stocks in the Stock Screener
IWM Latest News and Analysis
 7 hours ago - ChartmillMarket Monitor Trends BMO (SPY, QQQ, IWM) and Breadth June 23
Market internals weaken ahead of U.S. strike on Iran; advance-decline ratios and breadth metrics flash growing risk aversion.
 3 days ago - ChartmillMarket Monitor Trends (SPY, QQQ, IWM) and Breadth June 20
Steady But Fragile: Breadth Signals a Market in Flux
 5 days ago - ChartmillMarket Monitor Trends (SPY, QQQ, IWM) and Breadth June 18
The Market Breathes Out Again – But It’s a Nervous Exhale
 6 days ago - ChartmillMarket Monitor Trends (SPY, QQQ, IWM) and Breadth June 17
Friday’s breadth collapse raised some eyebrows, but Monday erased a lot of that doubt.
 7 days ago - ChartmillMarket Monitor Trends (SPY, QQQ, IWM) and Breadth June 16
Sharp Reversal as Breadth Collapses
 10 days ago - ChartmillMarket Monitor Trends (SPY, QQQ, IWM) and Breadth June 13
Bulls still have the ball, but they’re no longer sprinting. They’re looking over their shoulder.
 11 days ago - ChartmillMarket Monitor Trends (SPY, QQQ, IWM) and Breadth June 12
While fewer stocks participated in gains today, most remain above key moving averages, and longer-term momentum is holding.
 12 days ago - ChartmillMarket Monitor Trends (SPY, QQQ, IWM) and Breadth June 11
The market breadth on June 10, 2025, points to a strengthening bullish undercurrent, especially after the volatility of early June. Breadth metrics now show consistency across daily, weekly, and medium-term indicators.
 13 days ago - ChartmillMarket Monitor Trends (SPY, QQQ, IWM) and Breadth June 10
Breadth metrics for June 9 confirm that last week’s sharp selloff on June 5 was likely a short-lived pullback rather than the start of a new bearish phase.
 15 days ago - ChartmillMarket Monitor Trends (SPY, QQQ, IWM) and Breadth June 09
The June 6 session confirms that breadth is not only improving but now supporting the index-level gains we’ve seen in the major averages.
 17 days ago - ChartmillMarket Monitor Trends (SPY, QQQ, IWM) and Breadth June 06
SPY, QQQ both showing a distribution day after yesterday's session (down on above-average volume near the high).
 18 days ago - ChartmillMarket Monitor Trends (SPY, QQQ, IWM) and Breadth June 05
Breadth readings remain firm for now, this appears to be a healthy pause, not a reversal.
