

(All data & visualisations by ChartMill.com)
Daily Market Trend Analysis – June 13, 2025 (After Market Close)
All three major US Index-etf's gapped down on friday and are now close (SPY, QQQ) or already at (IWM) resistance levels.
Short Term Trend
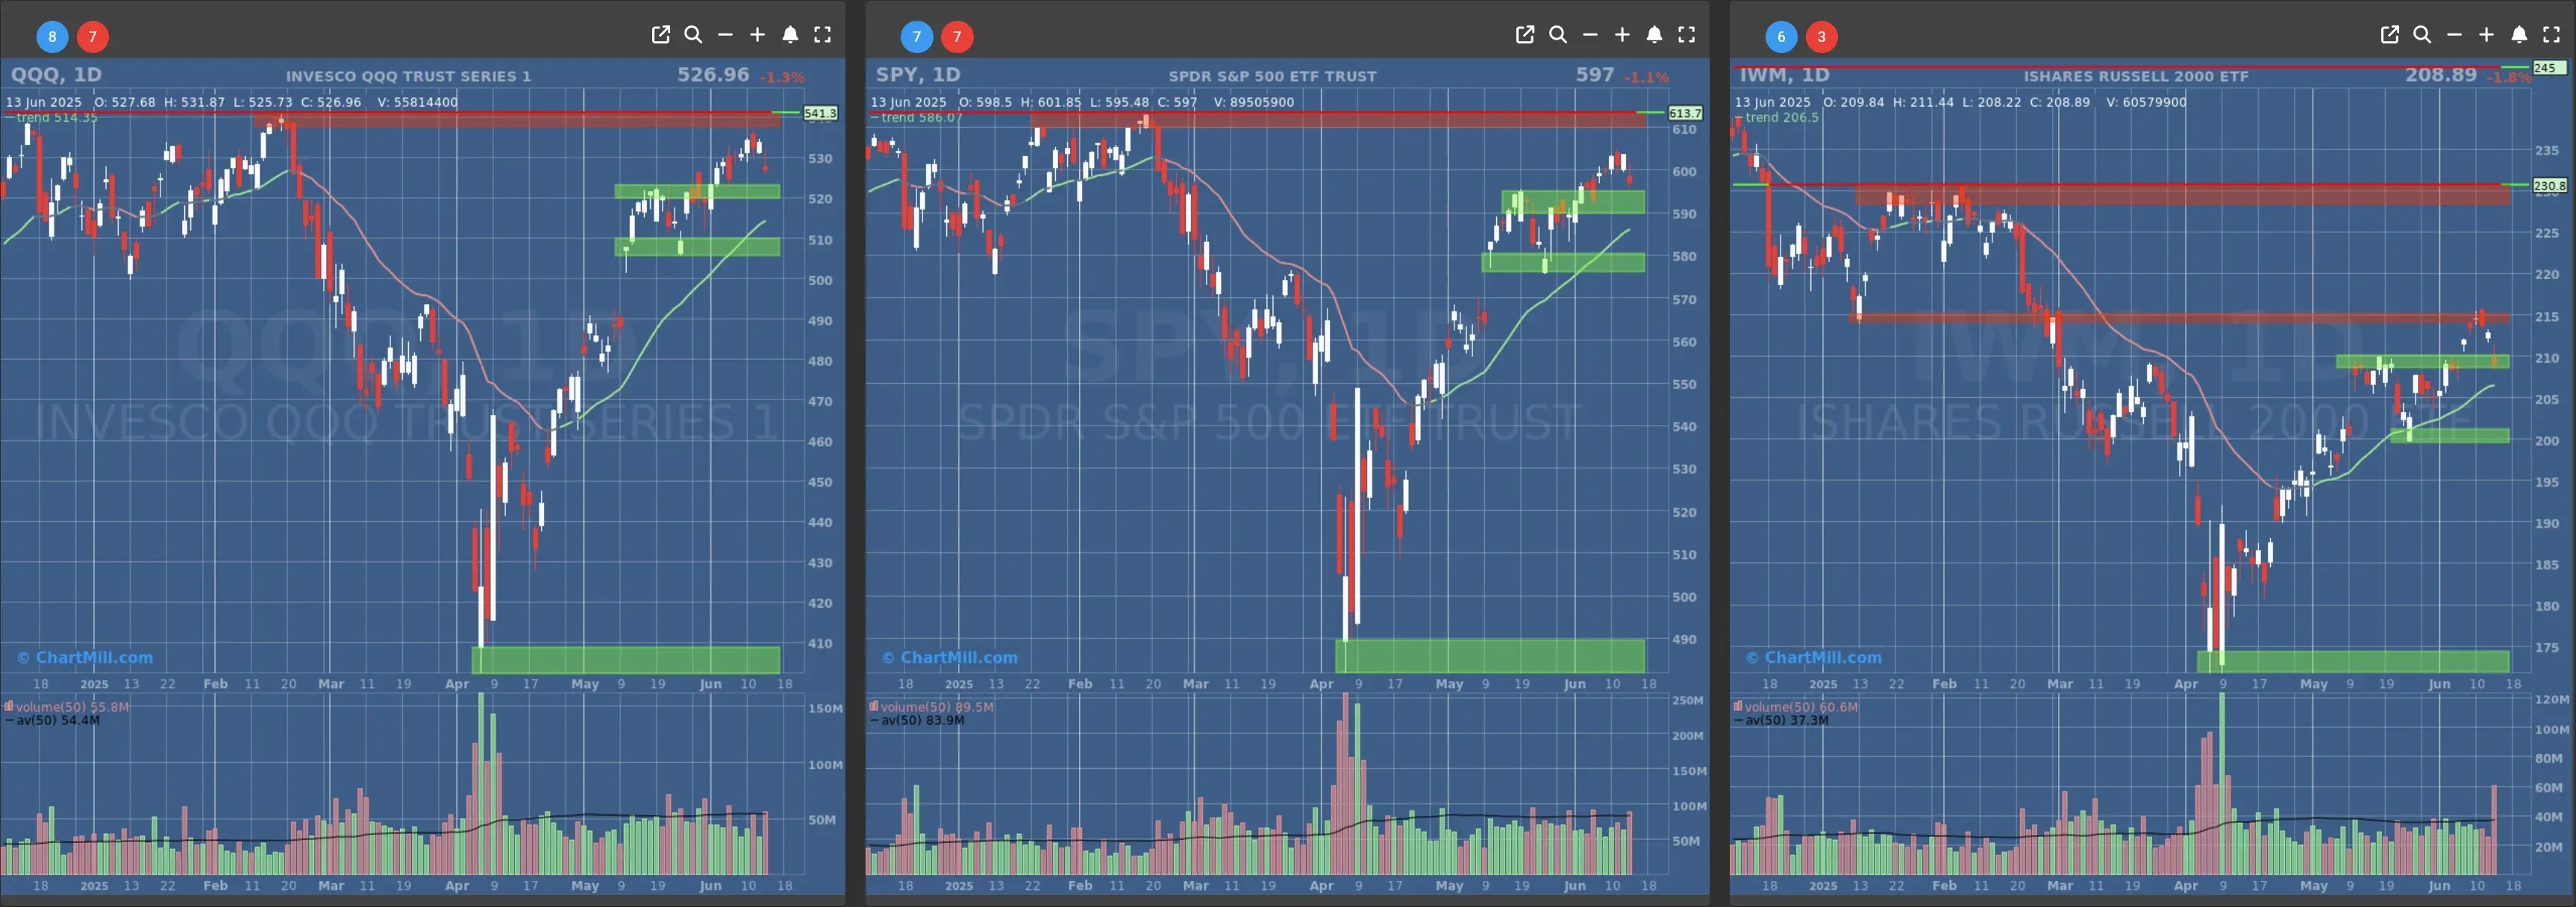
- Short-Term Trend: Bullish (no change)
- Next Support at $580
- Next Resistance at $610
- Volume: Slightly Above Average (50)
- Pattern: Gap Down, Down Day
- Short-Term Trend: Bullish (no change)
- Next Support at $520
- Next Resistance at $540
- Volume: Slightly Above Average (50)
- Pattern: Gap Down, Down Day
- Short-Term Trend: Bullish (no change)
- Next Support at $210 & $205
- Next Resistance at $215 & $230
- Volume: Far Above Average (50)
- Pattern: Down Day, Gap Down, into Resistance
Long Term Trend
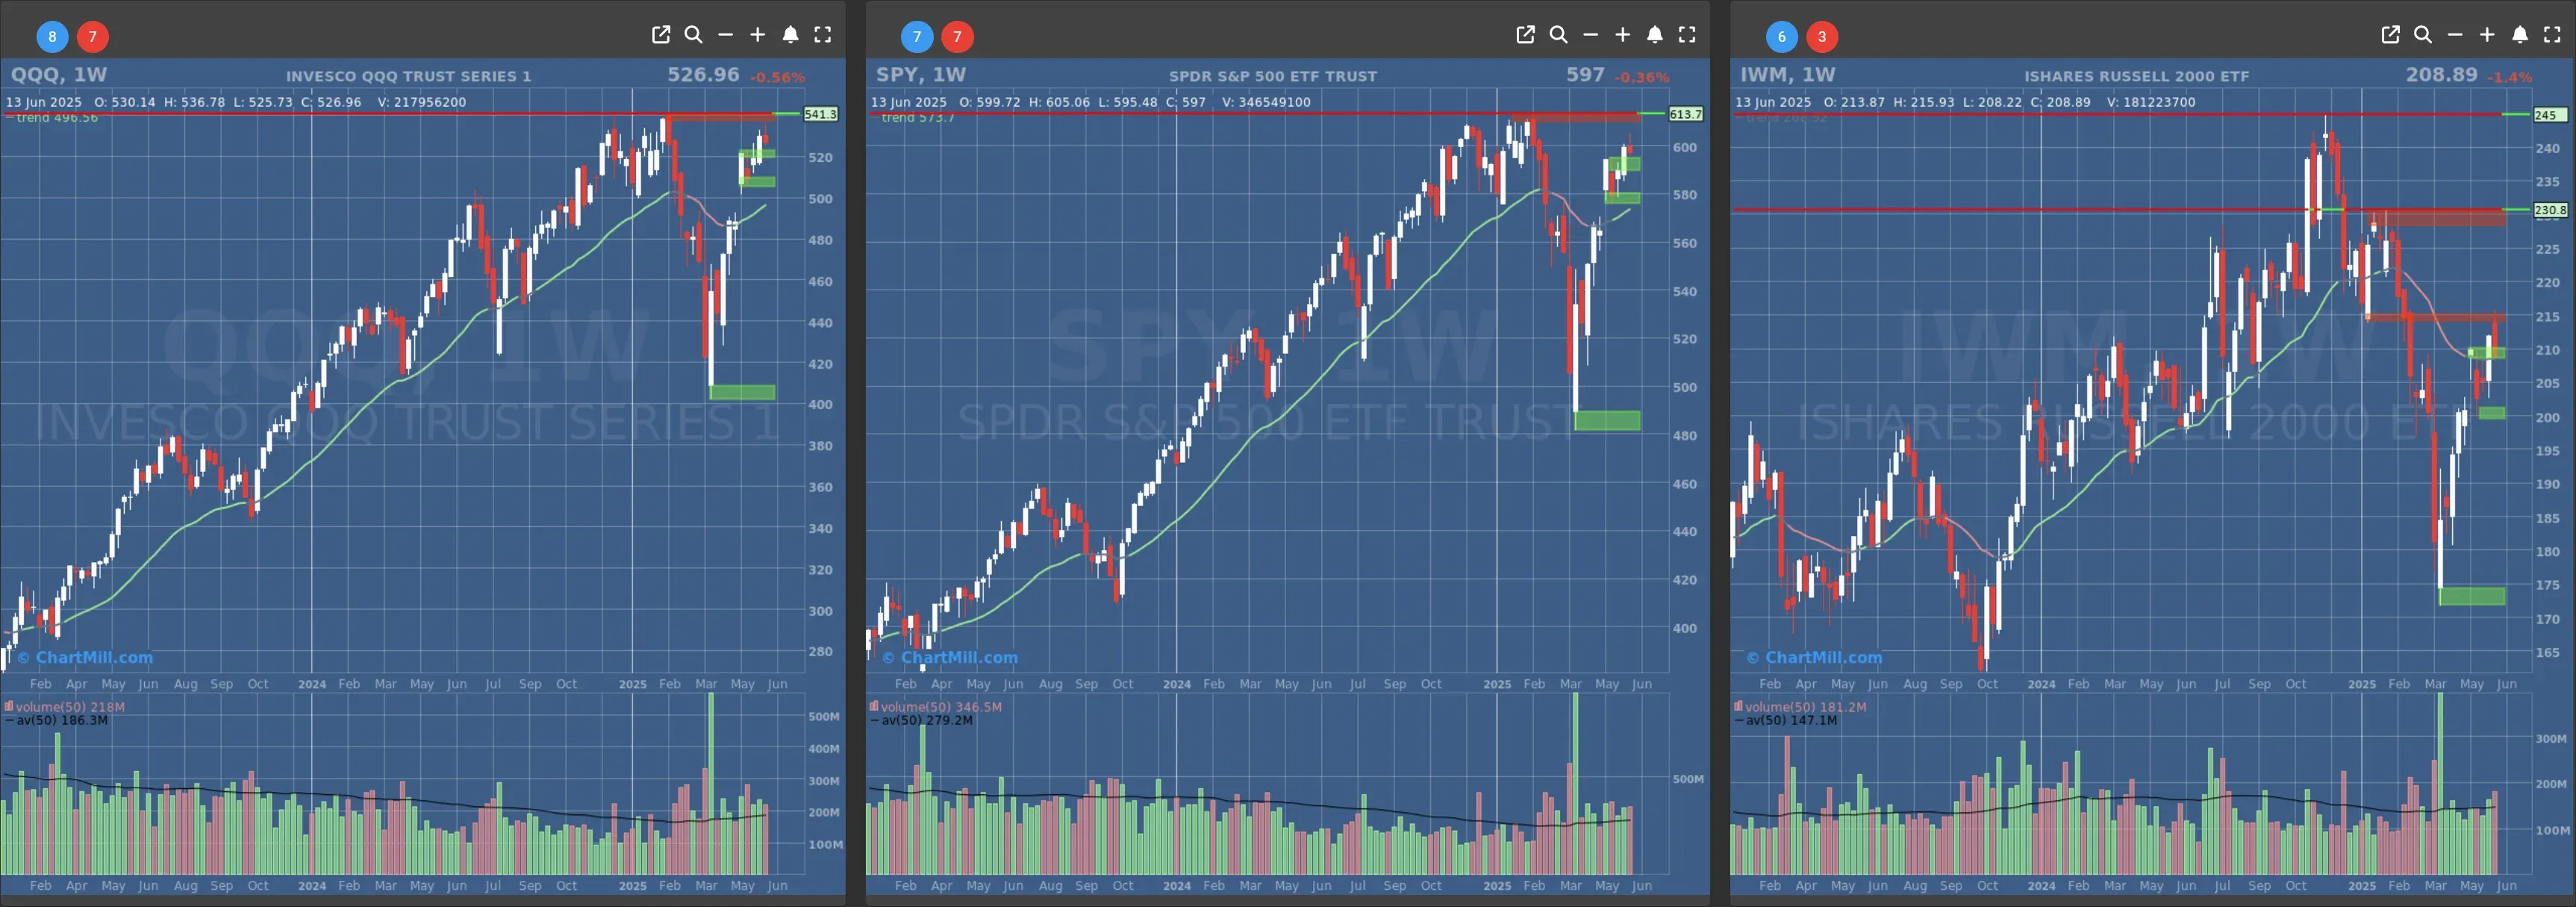
- Long-Term Trend: Positive (no change)
- Long-Term Trend: Positive (no change)
- Long-Term Trend: Neutral (no change)
Daily Market Breadth Analysis – June 13, 2025 (After Market Close)
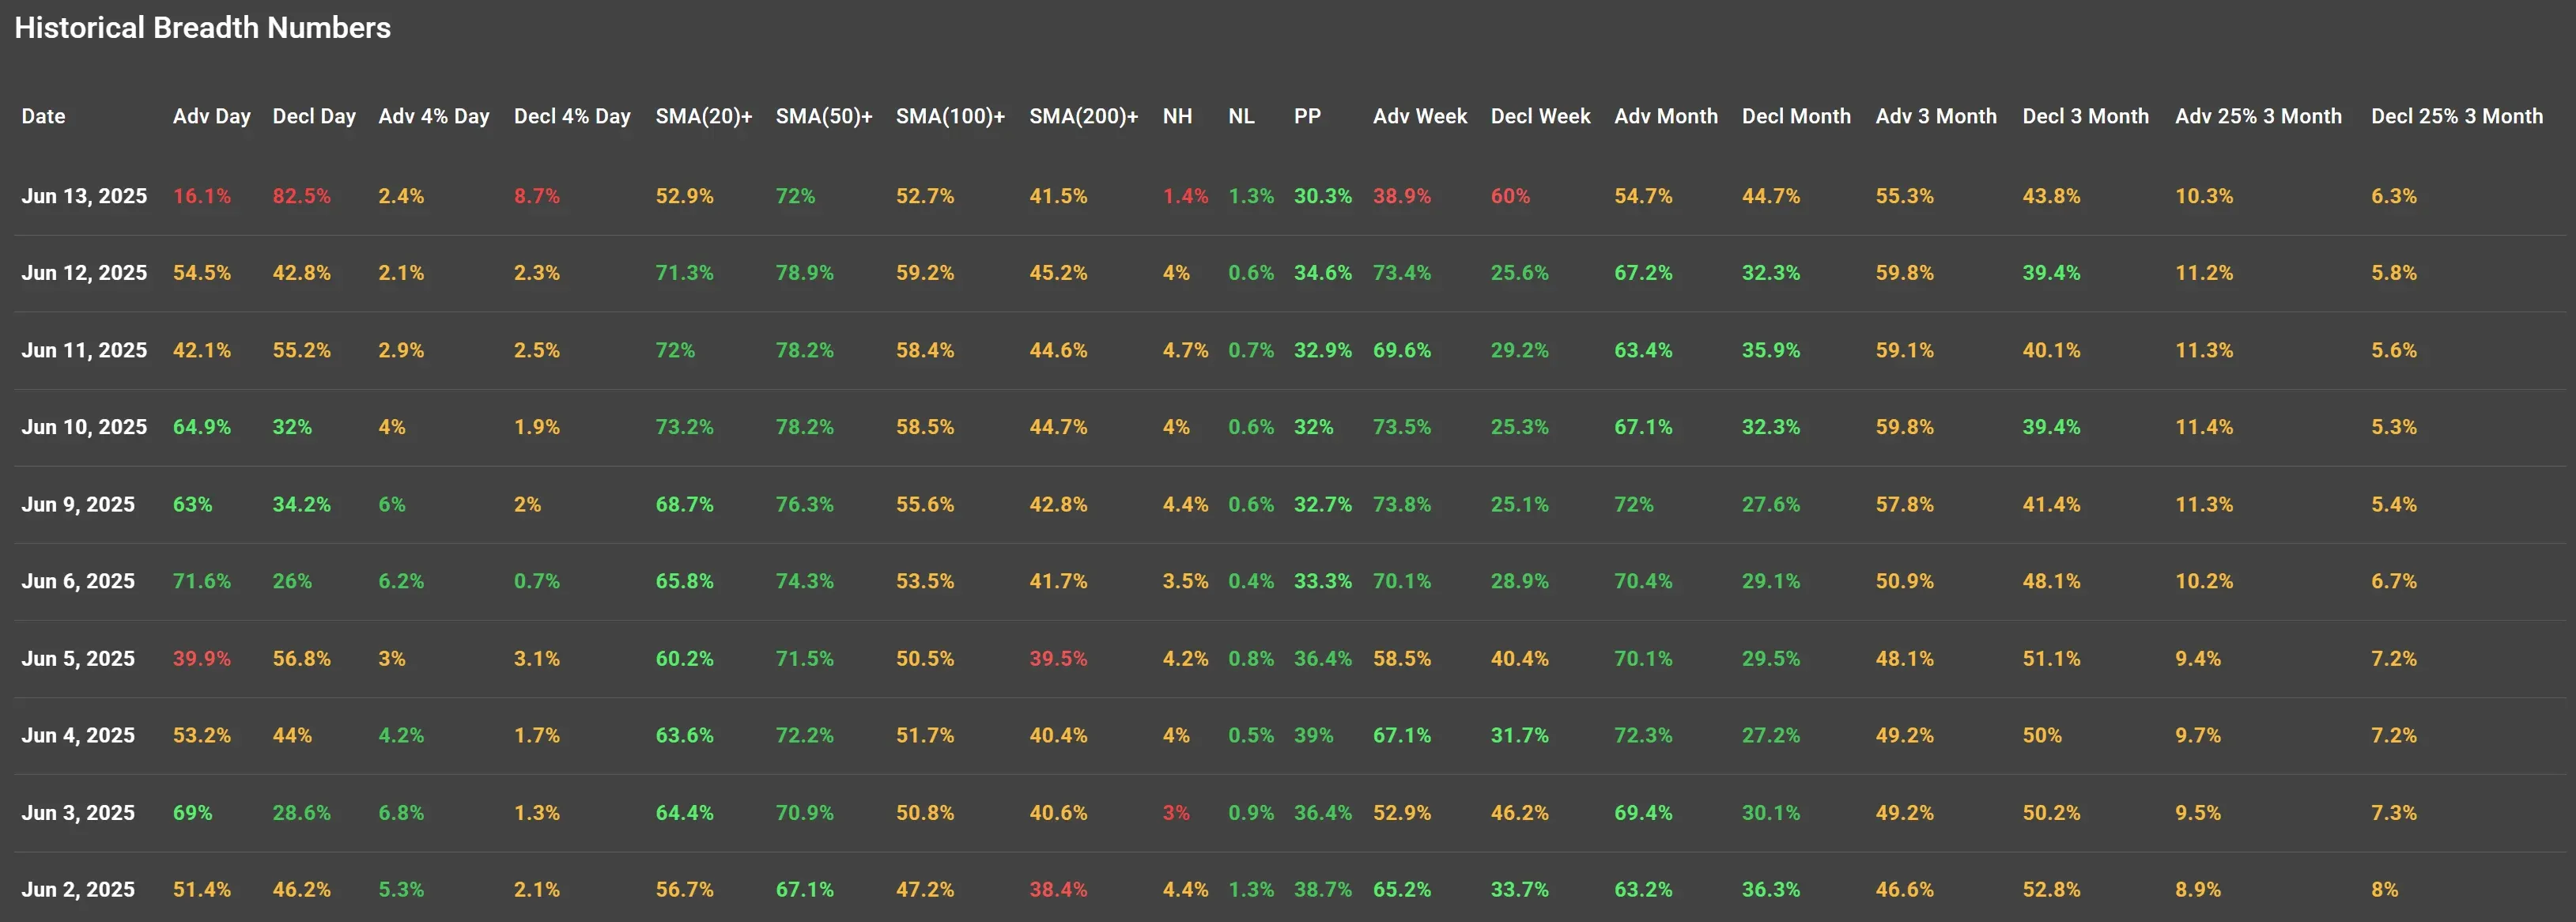
Friday’s breadth numbers confirmed exactly what the price action had already been screaming: this market got hit hard and broad. The deterioration in internals wasn’t just significant, it was violent. And it marked a full 180 from what we saw earlier in the week.
Let’s break it down.
Breadth Breakdown: From Resilience to Carnage
Advancing issues collapsed to just 16.1%, the lowest in at least two weeks.
Meanwhile, declining issues spiked to 82.5%, an extreme level that underlines just how one-sided the selling was.
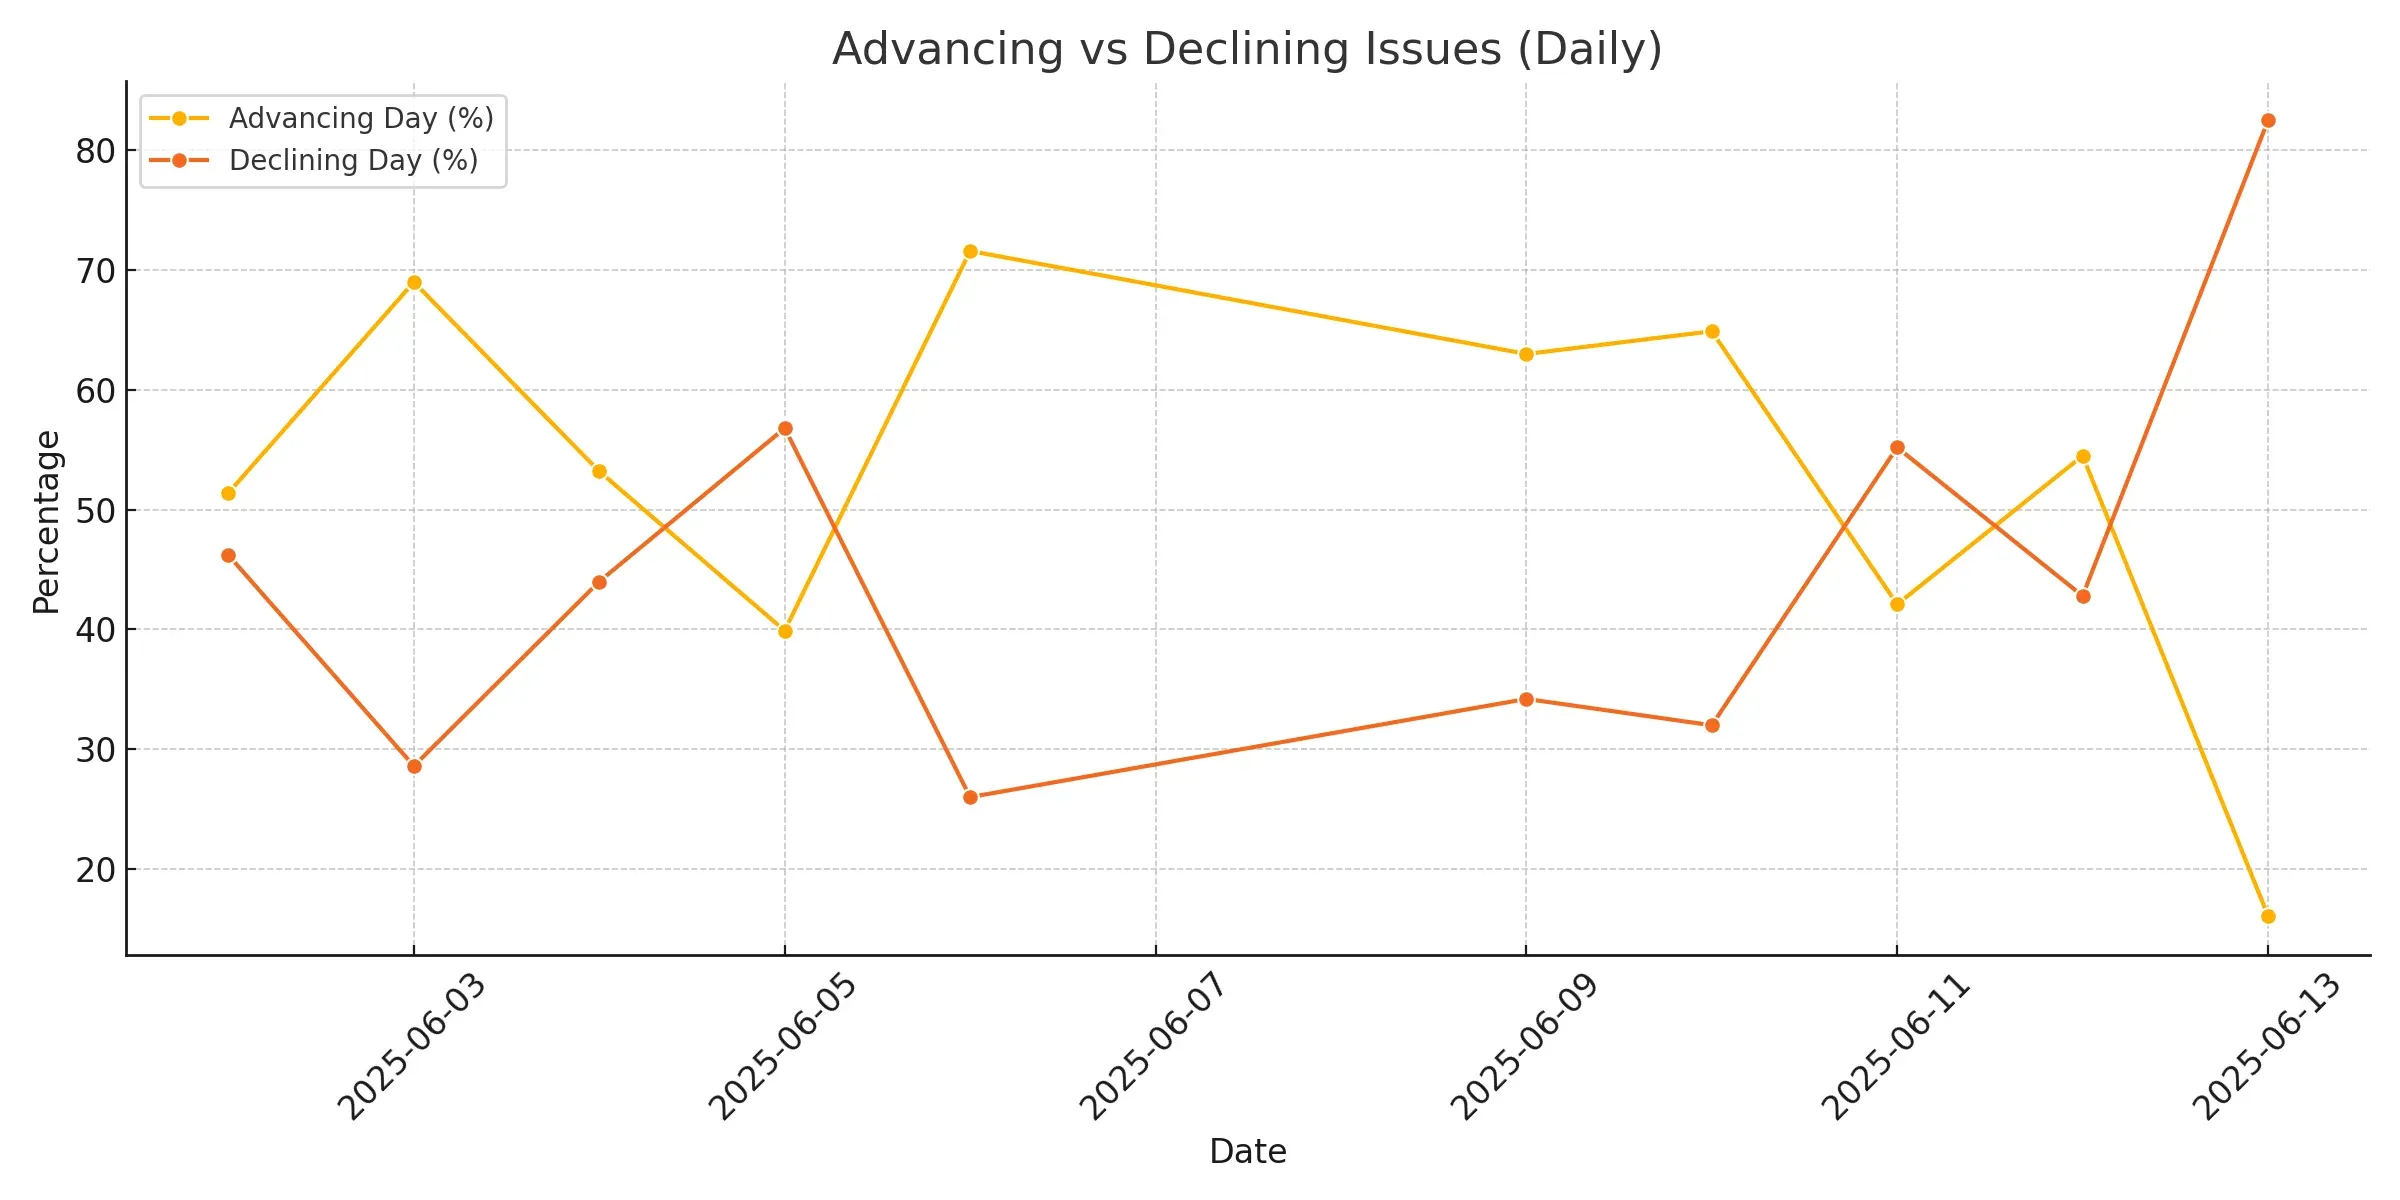
Compare that to Thursday’s numbers: 54.5% advancers vs 42.8% decliners. That wasn't exactly strong breadth, but it suggested stability. Friday blew that picture apart.
Even more concerning: this wasn’t just a blip. The weekly advance/decline ratio also cratered:
-
Adv Week dropped to 38.9% (from 73.4% the day before)
-
Decl Week surged to 60% (vs 25.6%)
That’s a complete sentiment reversal in just 24 hours.
Support Levels Break as SMA Participation Weakens
Participation above key moving averages held up remarkably well earlier in the week, even on down days. But Friday's damage cracked that structure too:
-
SMA(50)+ dropped to 72% (from 78.9%)
-
SMA(200)+ slipped to 41.5% (from 45.2%)
Now, we’re still technically above the danger zone (i.e., below 40% on the 50-day, below 35% on the 200-day), but we’re sliding. If Monday brings another risk-off session, I’d expect this to deteriorate fast.
Context Matters: This Wasn’t Just a Soft Pullback
Looking at the Previous Breadth Commentary from Thursday, I noted how the advancing stocks still outnumbered decliners (54.5% vs 42.8%) and the 50-day breadth remained impressively high (78.9%). That painted a market that was digesting rather than breaking.
Well, digestion turned into panic selling after the Iran–Israel headlines dropped. The NH/NL (New Highs/New Lows) data confirmed the souring tone: new highs dropped to just 1.4%, nearly matched by 1.3% new lows.
This suggests even the strongest names are now facing pressure.
What Now?
If you’re positioned bullish, you now have a clear inflection point. Breadth has shifted violently, and we’re back to watching for follow-through next week.
Key levels to watch Monday:
Does SMA(50)+ hold above 70%?
Do we bounce back toward 50% advancers, or does this roll into deeper risk aversion?
If we don’t see a strong counter-move early next week, I expect increasing cracks in the broader uptrend, especially given the fragile macro backdrop and geopolitical uncertainty.
Let’s see if this was a one-day shakeout or the start of something bigger. Either way, the internals have spoken and they’re not whispering.
Kristoff - Co-founder, ChartMill
Next to read: Market Monitor News, June 16