(All data & visualisations by ChartMill.com)
Daily Market Trend Analysis – June 09, 2025 (After Market Close)
Another tight range with little animosity for QQQ and SPY. IWM gapped up as it did yesterday and closed near $215 resistance.
Short Term Trend
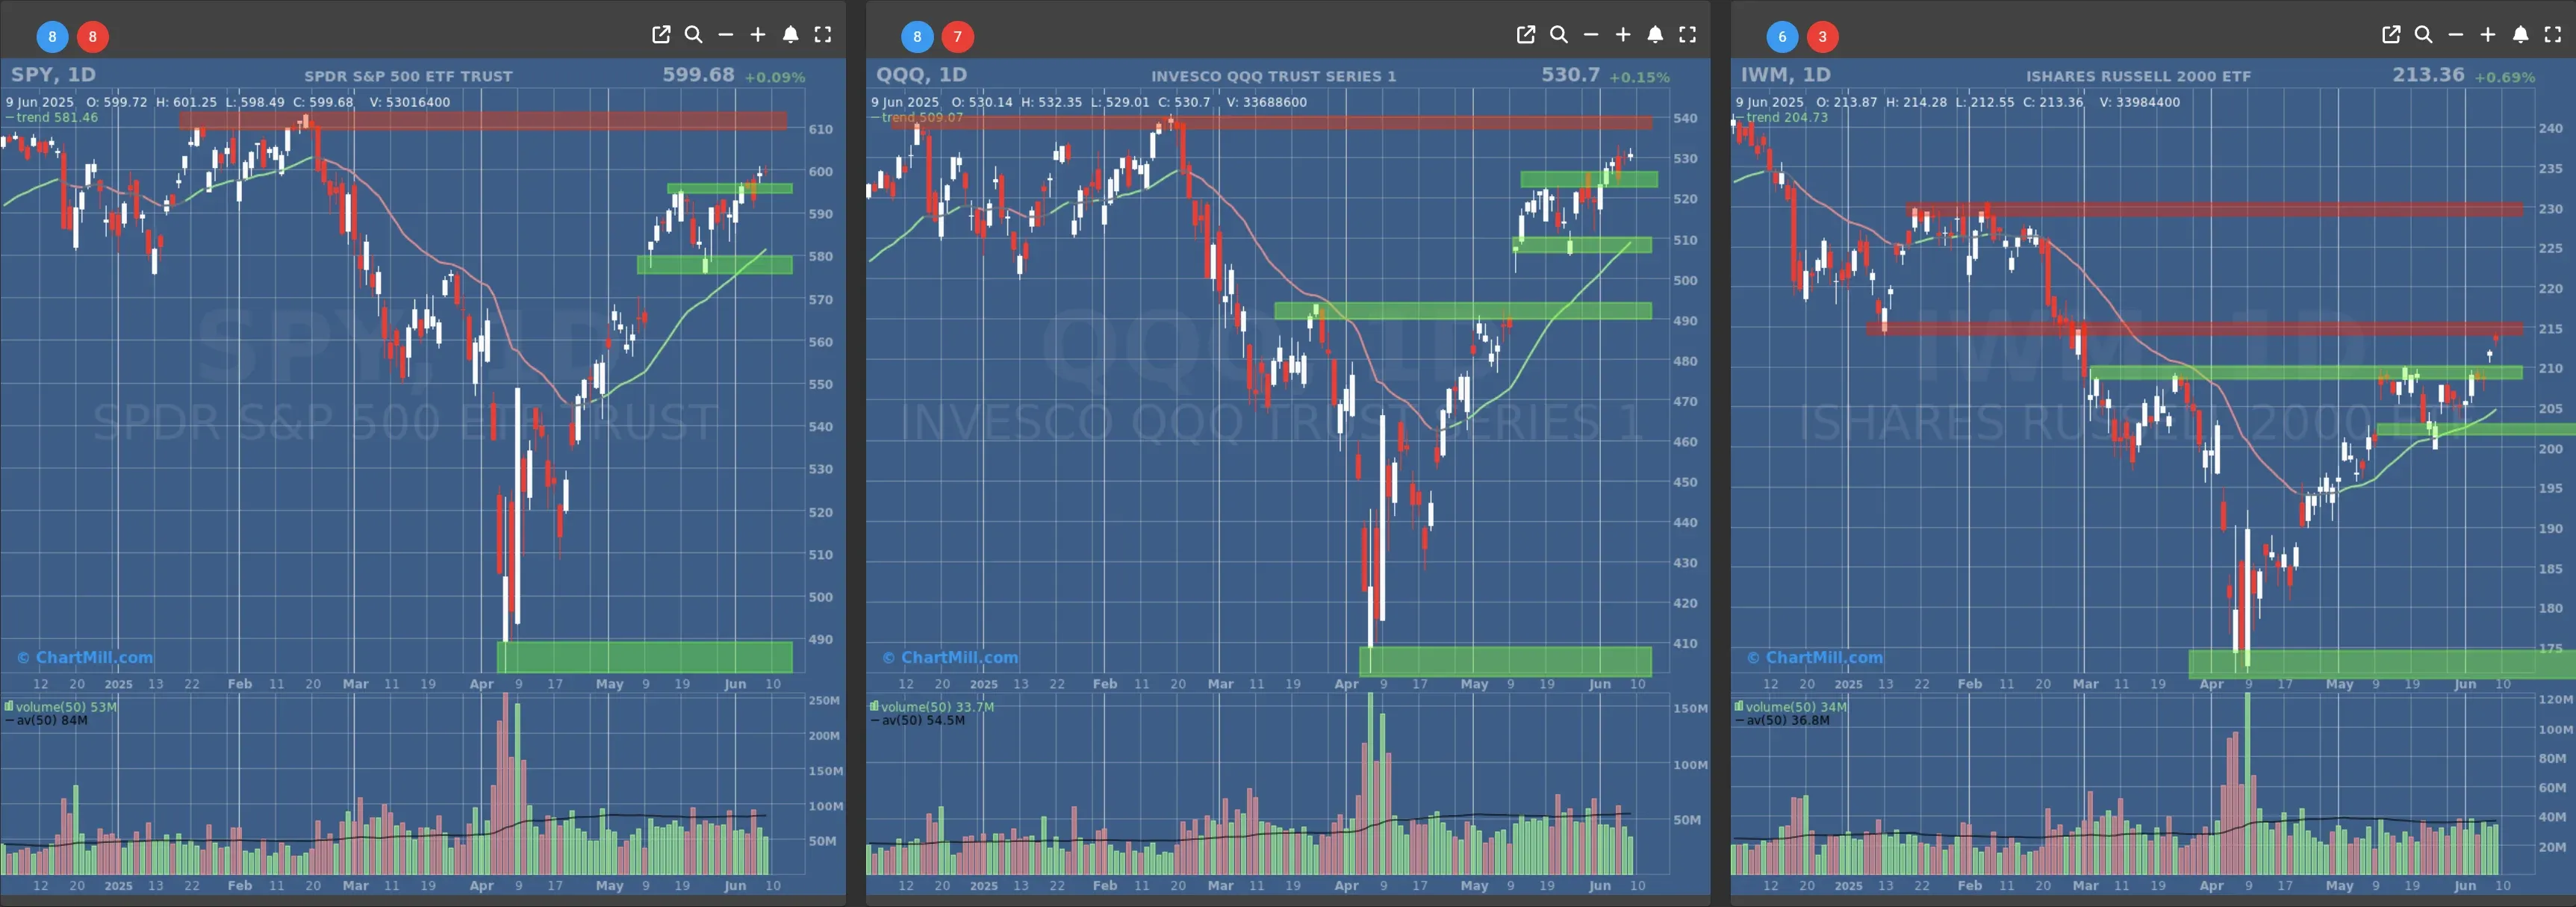
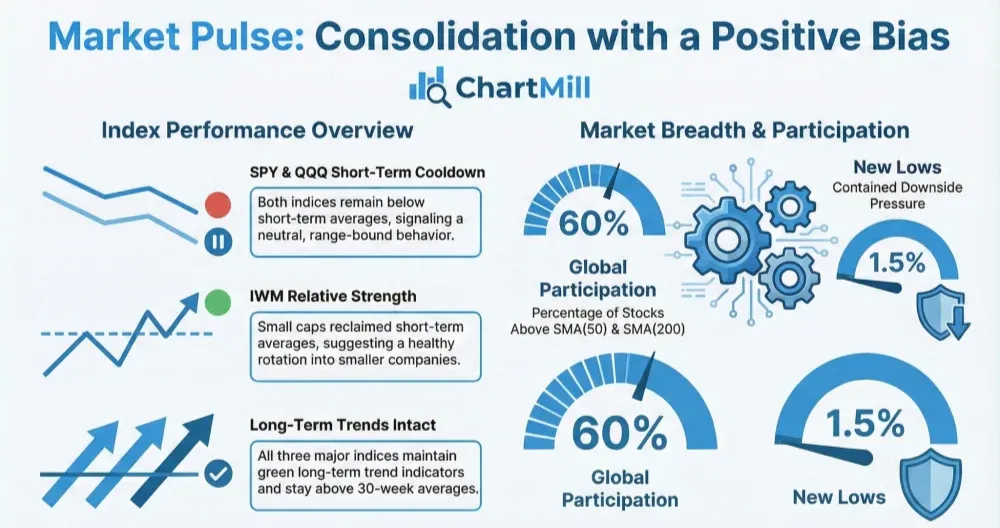
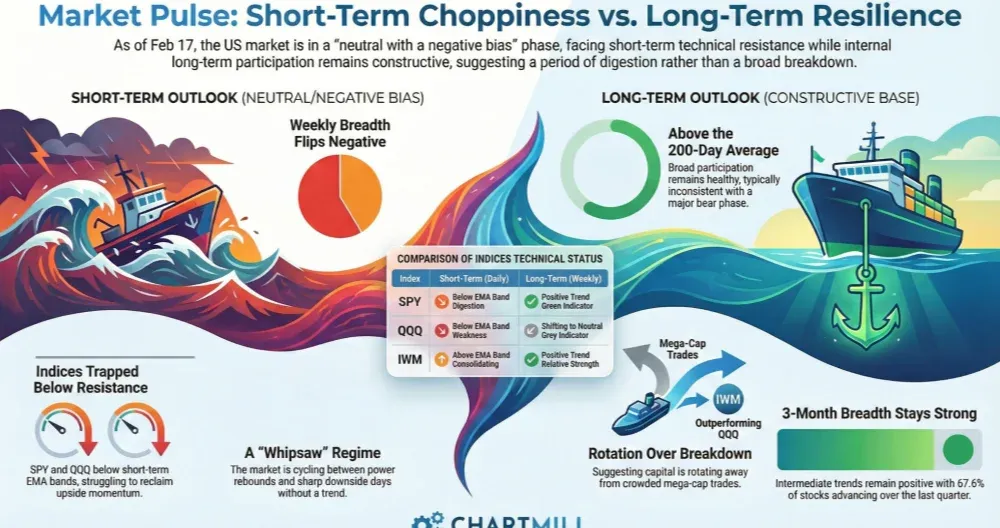
- Short-Term Trend: Bullish (no change)
- Next Support at $580
- Next Resistance at $610
- Volume: Below Average (50)
- Pattern: Doji Candle
- Short-Term Trend: Bullish (no change)
- Next Support at $520
- Next Resistance at $540
- Volume: Below Average (50)
- Pattern: Doji Candle
- Short-Term Trend: Bullish (no change)
- Next Support at $210 & $205
- Next Resistance at $215 & $230
- Volume: Slightly below Average (50)
- Pattern: Gap Up, Hanging Man Candle
Long Term Trend
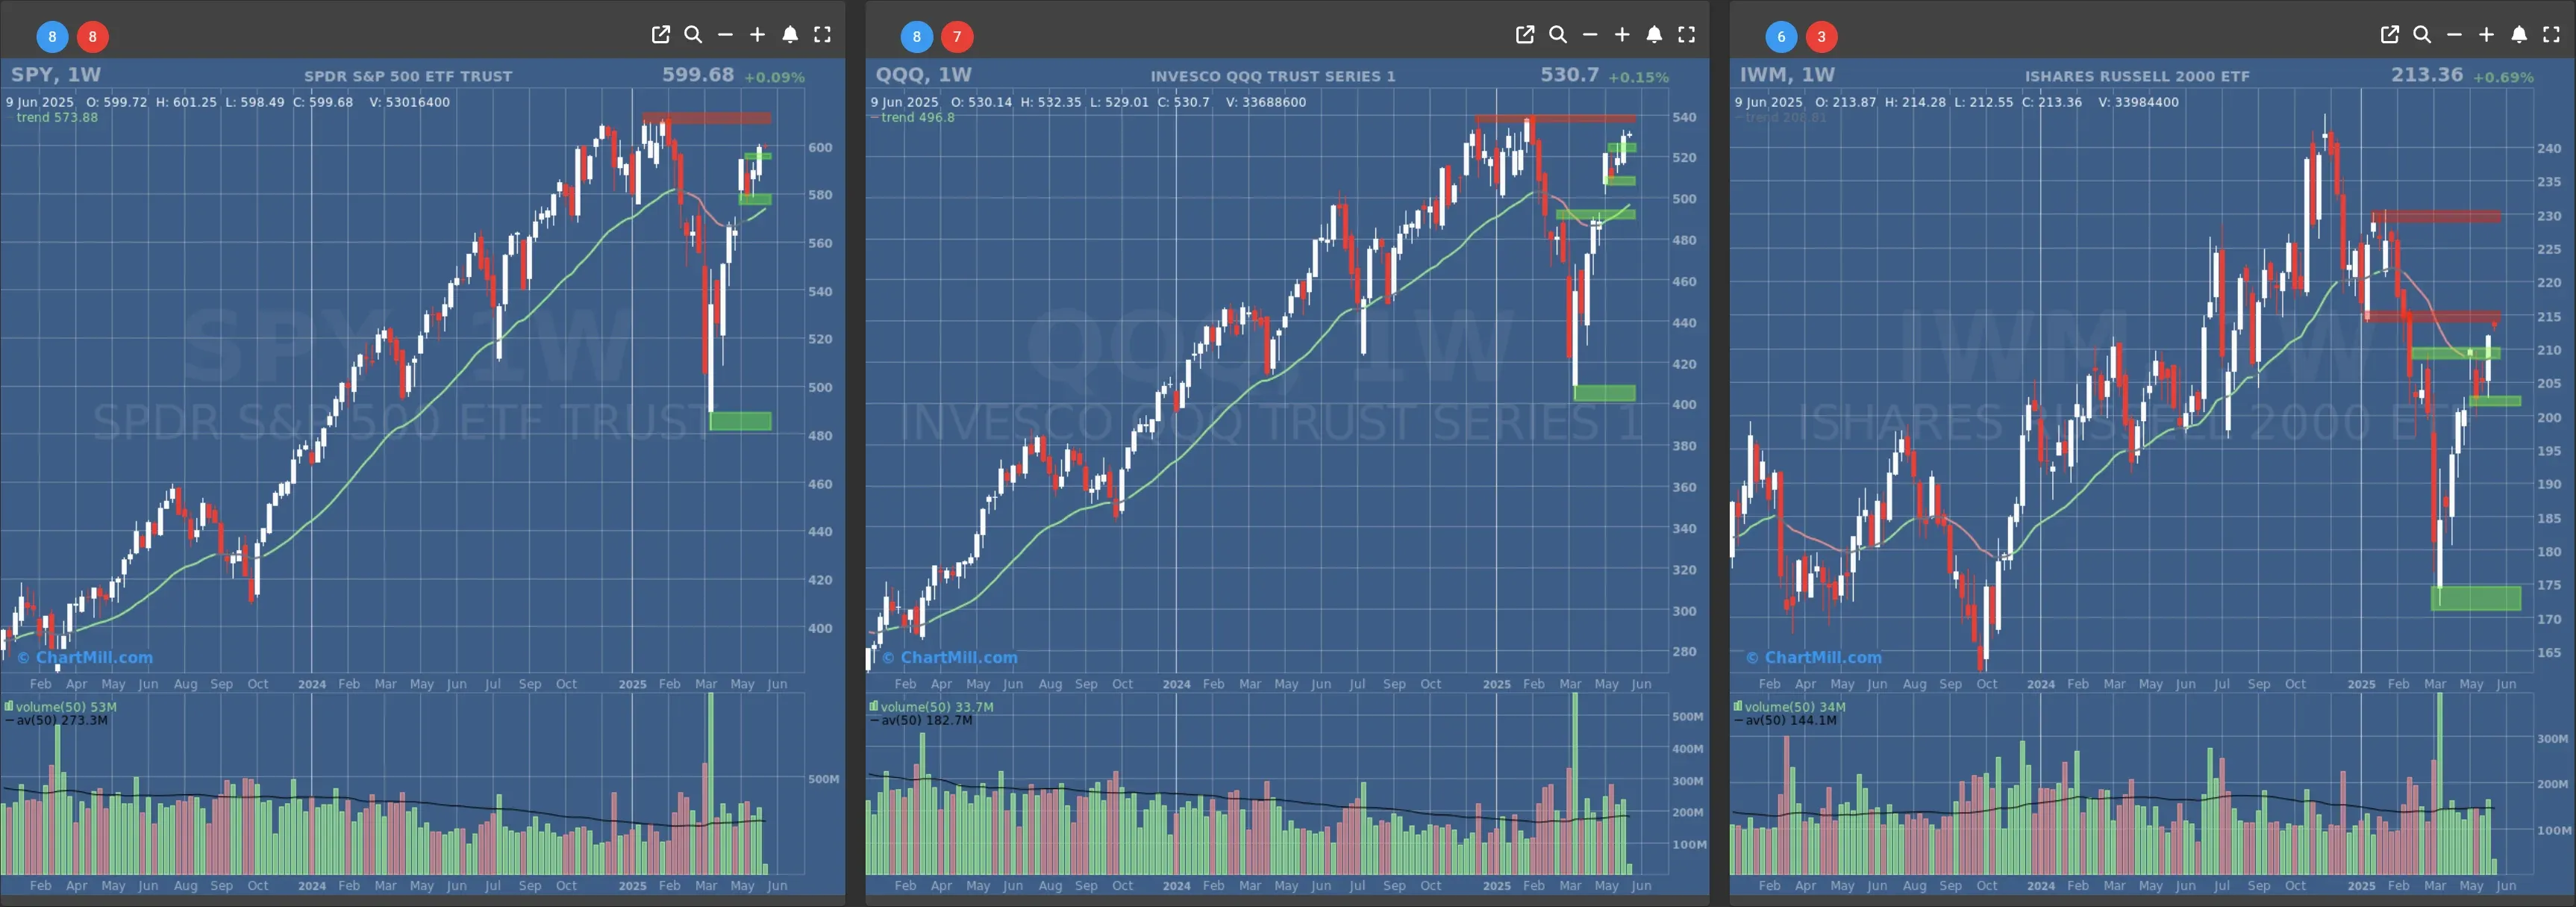
- Long-Term Trend: Positive (no change)
- Long-Term Trend: Positive (no change)
- Long-Term Trend: Neutral (no change)
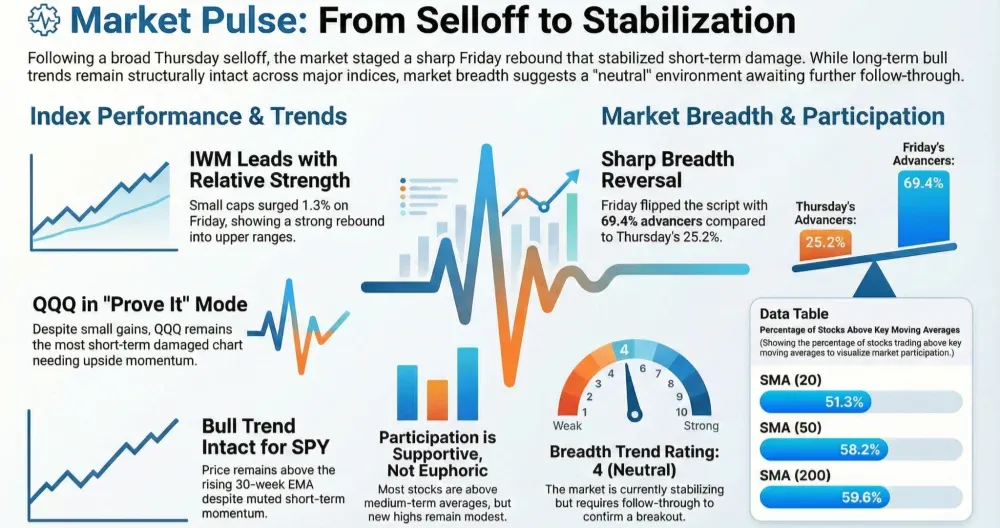
Daily Market Breadth Analysis – June 09, 2025 (After Market Close)
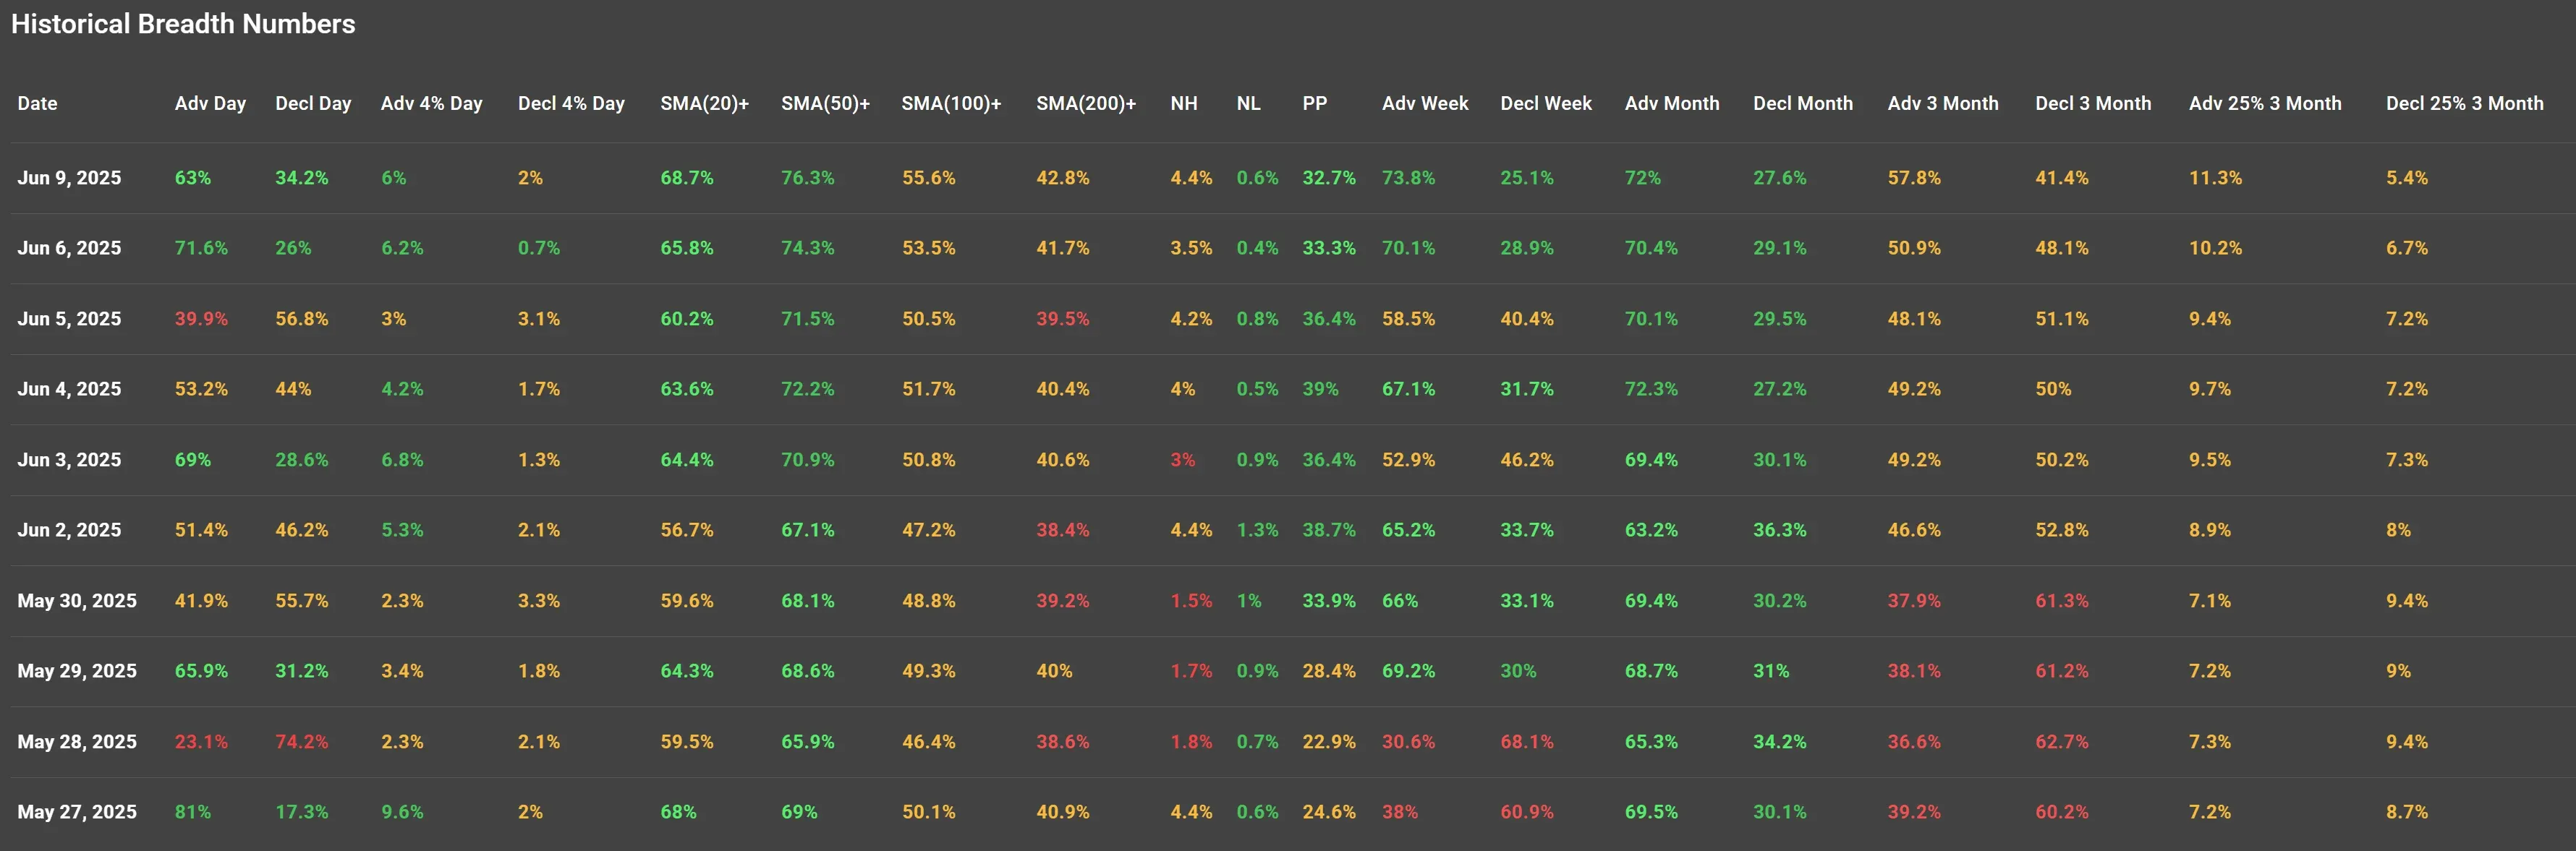
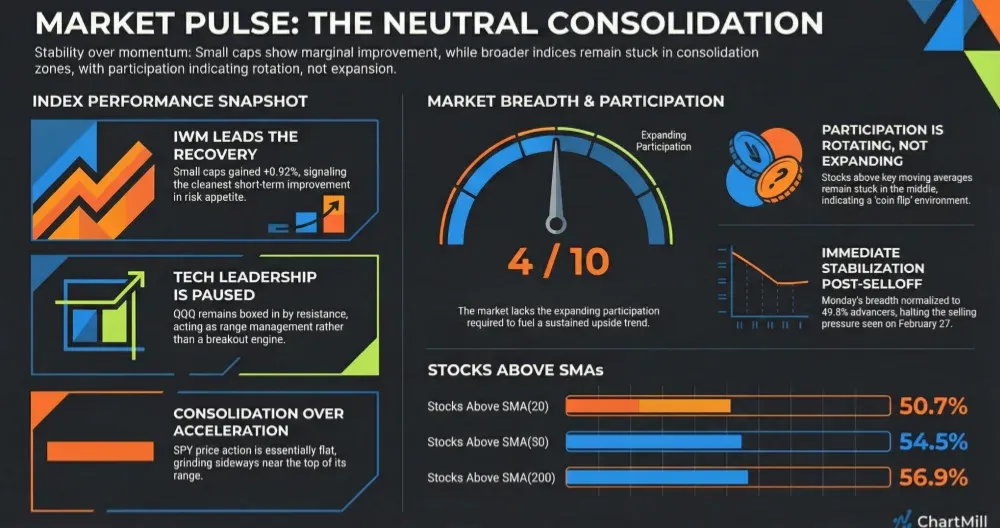
Market breadth modestly improved, continuing the rebound from June 5 lows, with stronger support above major moving averages.
Short-Term Momentum Holding
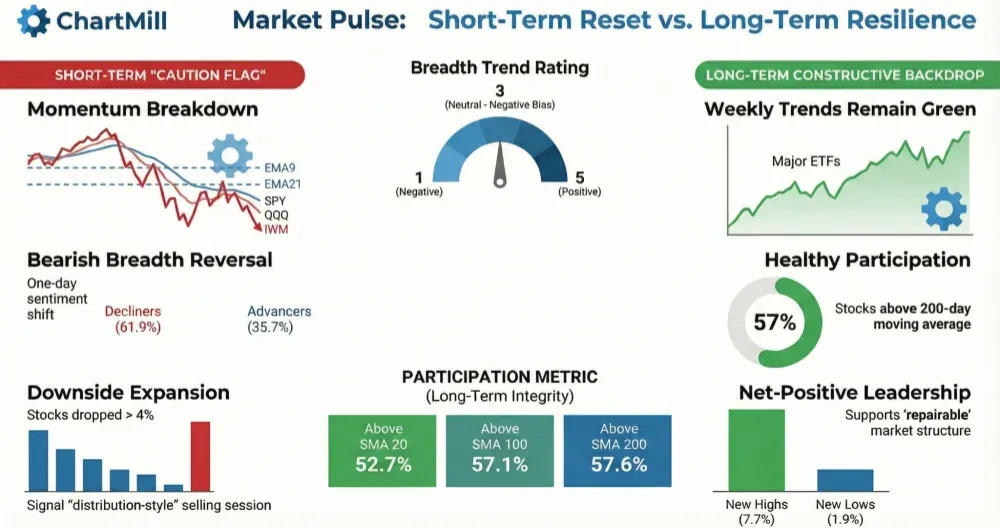
On Monday, 63% of stocks advanced versus 34.2% that declined, a slight retreat from Friday’s 71.6% advancers, but still indicative of a healthy upside bias.
This reinforces a short-term trend of positive breadth following the dip seen on June 5, when advancers fell to just 39.9%. That sharp pullback has since been countered by three sessions of advancing stocks outpacing decliners.
The percentage of stocks making strong moves (up more than 4%) remained relatively stable at 6%, signaling consistent bullish conviction among select names.
Breadth Across Moving Averages Still Strong
Looking at the broader trend:
-
68.7% of stocks are trading above their 20-day SMA, a slight increase from 65.8% Friday.
-
76.3% are above their 50-day SMA, the highest level recorded over the last week.
-
55.6% are above their 100-day SMA, continuing the slow climb from 50.5% on June 5.
-
42.8% are above the 200-day SMA, maintaining a gradual improvement from the 38.4% low on June 2.
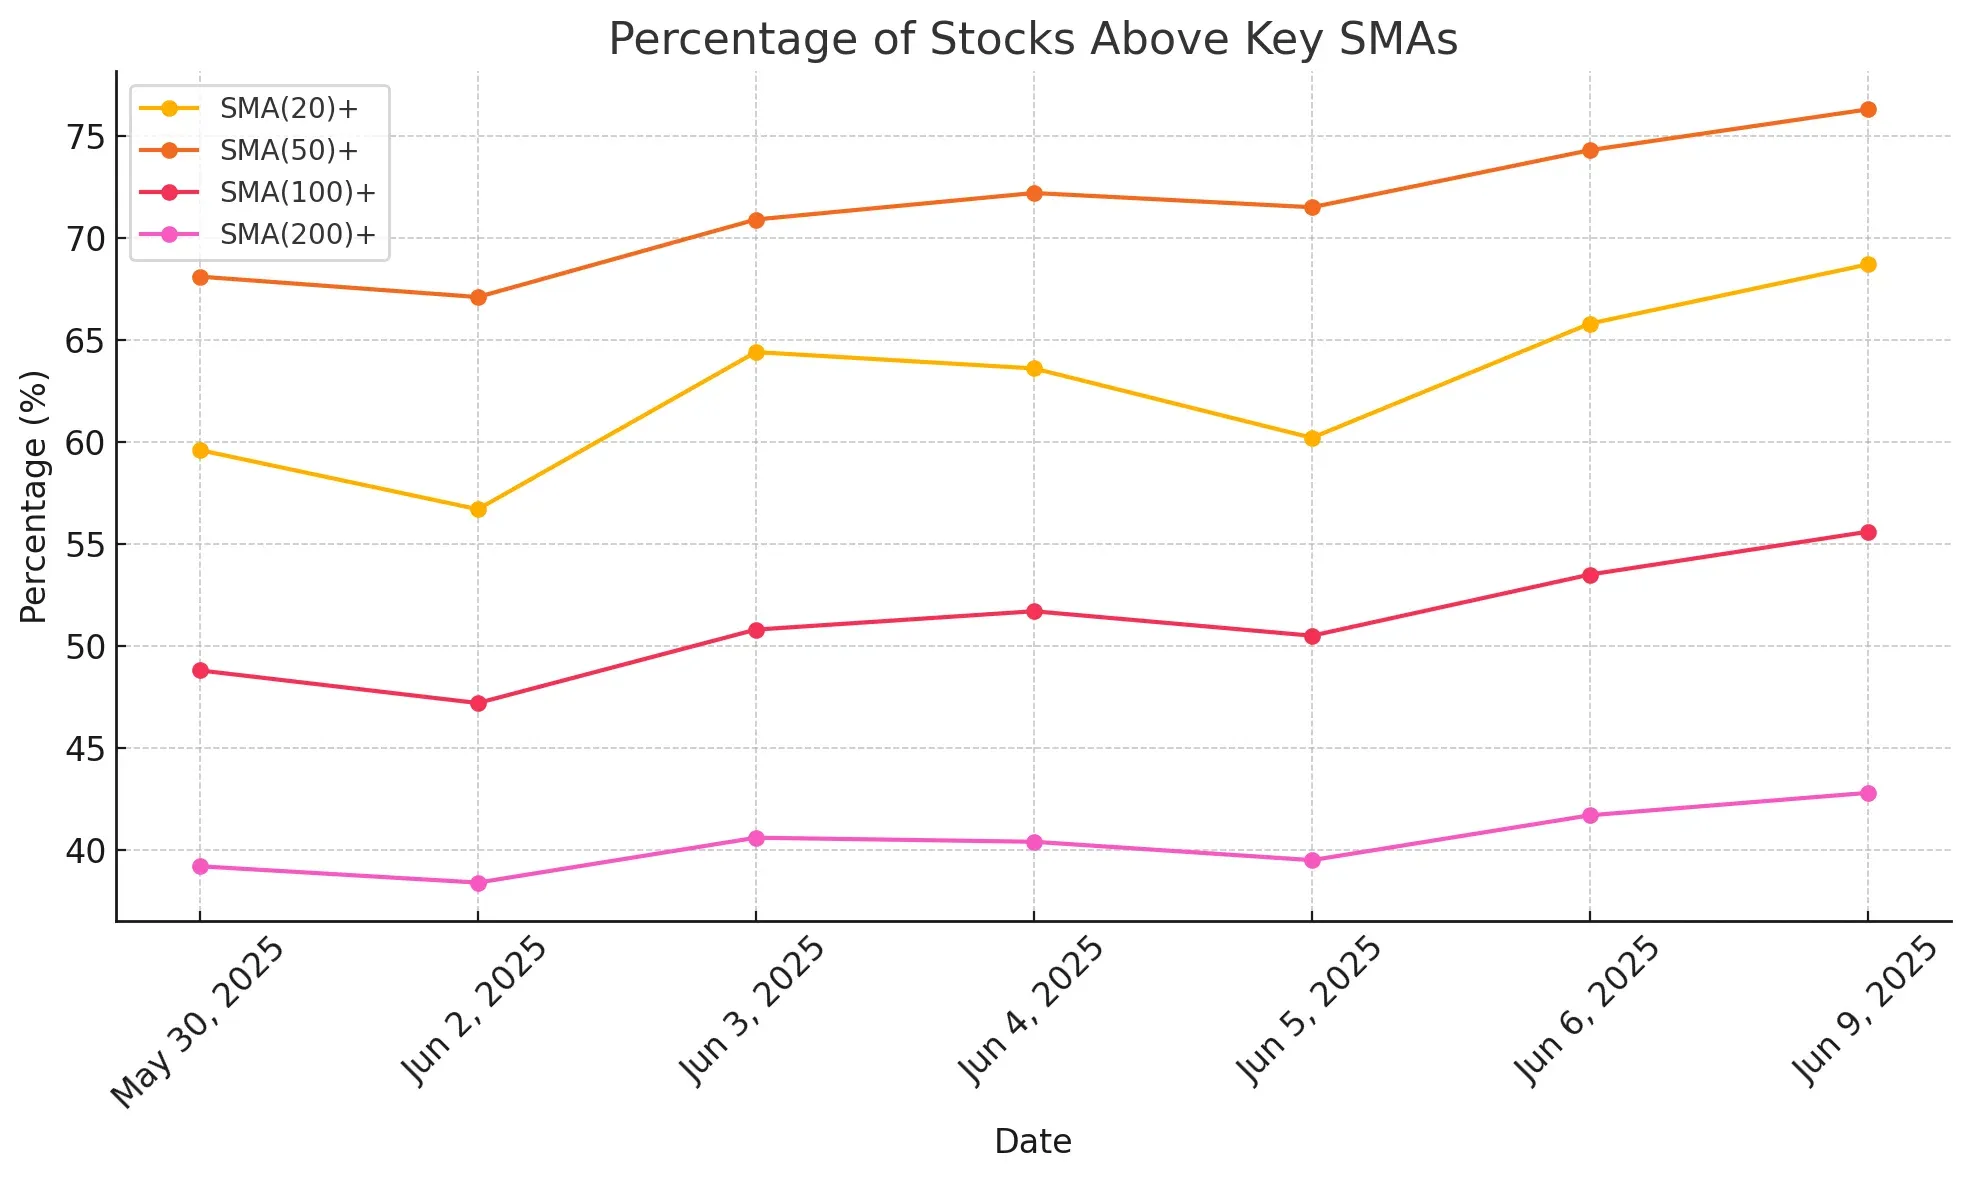
This uptick across all SMA metrics underscores improving medium- to long-term sentiment, especially after the sharp contraction seen earlier last week.
New Highs vs Lows: No Red Flags
New highs (NH) stood at 4.4%, nearly matching levels from the previous sessions, while new lows (NL) held steady at 0.6%, matching the lowest reading in the dataset.
This confirms that market strength is not just shallow or driven by a few names—weakness is broadly contained.
Weekly and monthly breadth measures also remain strong:
-
Adv Week: 73.8% (vs 70.1% on June 6)
-
Adv Month: 72% (vs 70.4%)
-
Adv 3 Month: 57.8% (vs 50.9%)
All these mark gradual but clear improvement, particularly the Adv 3 Month trend, which has now recovered nearly 10 points from the May 30 low of 37.9%.
Notable Trend: Fewer Deep Decliners
The percentage of stocks declining 25% or more over the past 3 months dropped again to 5.4%, the lowest reading in the series, down from 9.4% just seven sessions ago.
Combined with 11.3% of stocks gaining 25% or more, this indicates a healthier long-term structure building under the surface.
Conclusion
Breadth metrics for June 9 confirm that last week’s sharp selloff on June 5 was likely a short-lived pullback rather than the start of a new bearish phase.
The consistent improvement in stocks trading above key SMAs, fewer stocks making new lows, and broad participation in upward trends all suggest underlying market strength is building—even as index moves remain modest.
Expectations heading into this week’s inflation data are cautious, but from a breadth perspective, the market appears to be gaining internal momentum.
Next to read: Market Monitor News, June 10