Market Monitor Trends (SPY, QQQ, IWM) and Breadth June 09
By Kristoff De Turck - reviewed by Aldwin Keppens
Last update: Jun 9, 2025
(All data & visualisations by ChartMill.com)
Daily Market Trend Analysis – June 06, 2025 (After Market Close)
After Friday, the IWM etf finally broke out of its inverted head-and-shoulders pattern.
The SPY and QQQ also opened higher and closed Friday with a 1% gain. Both ETFs are now quoting very close to their all time highs. However, the doji candle indicates some investor caution.
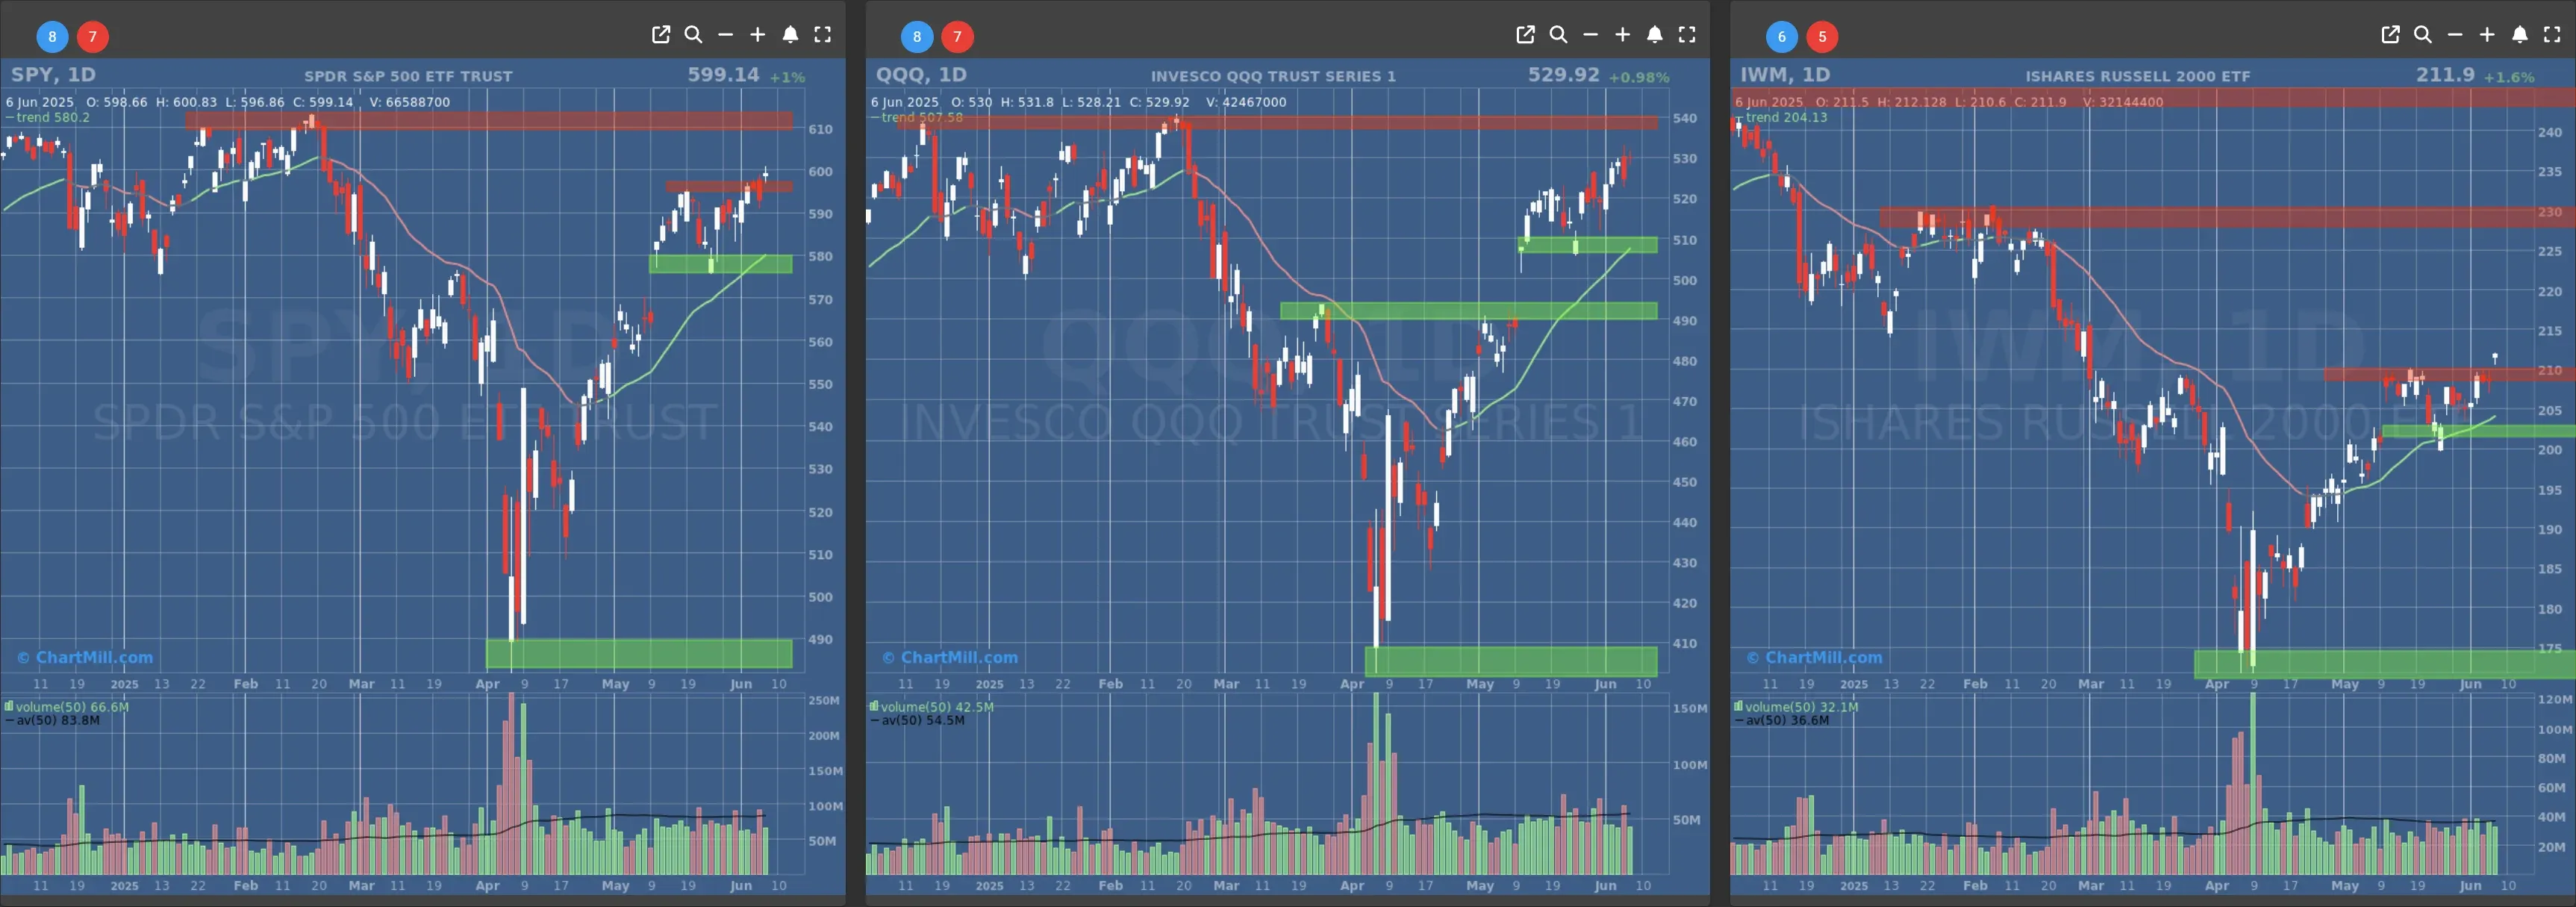
The all-time highs for SPY and QQQ are not far away and the scenario so far is still that they will be reached in the coming days/weeks.
Short Term Trend
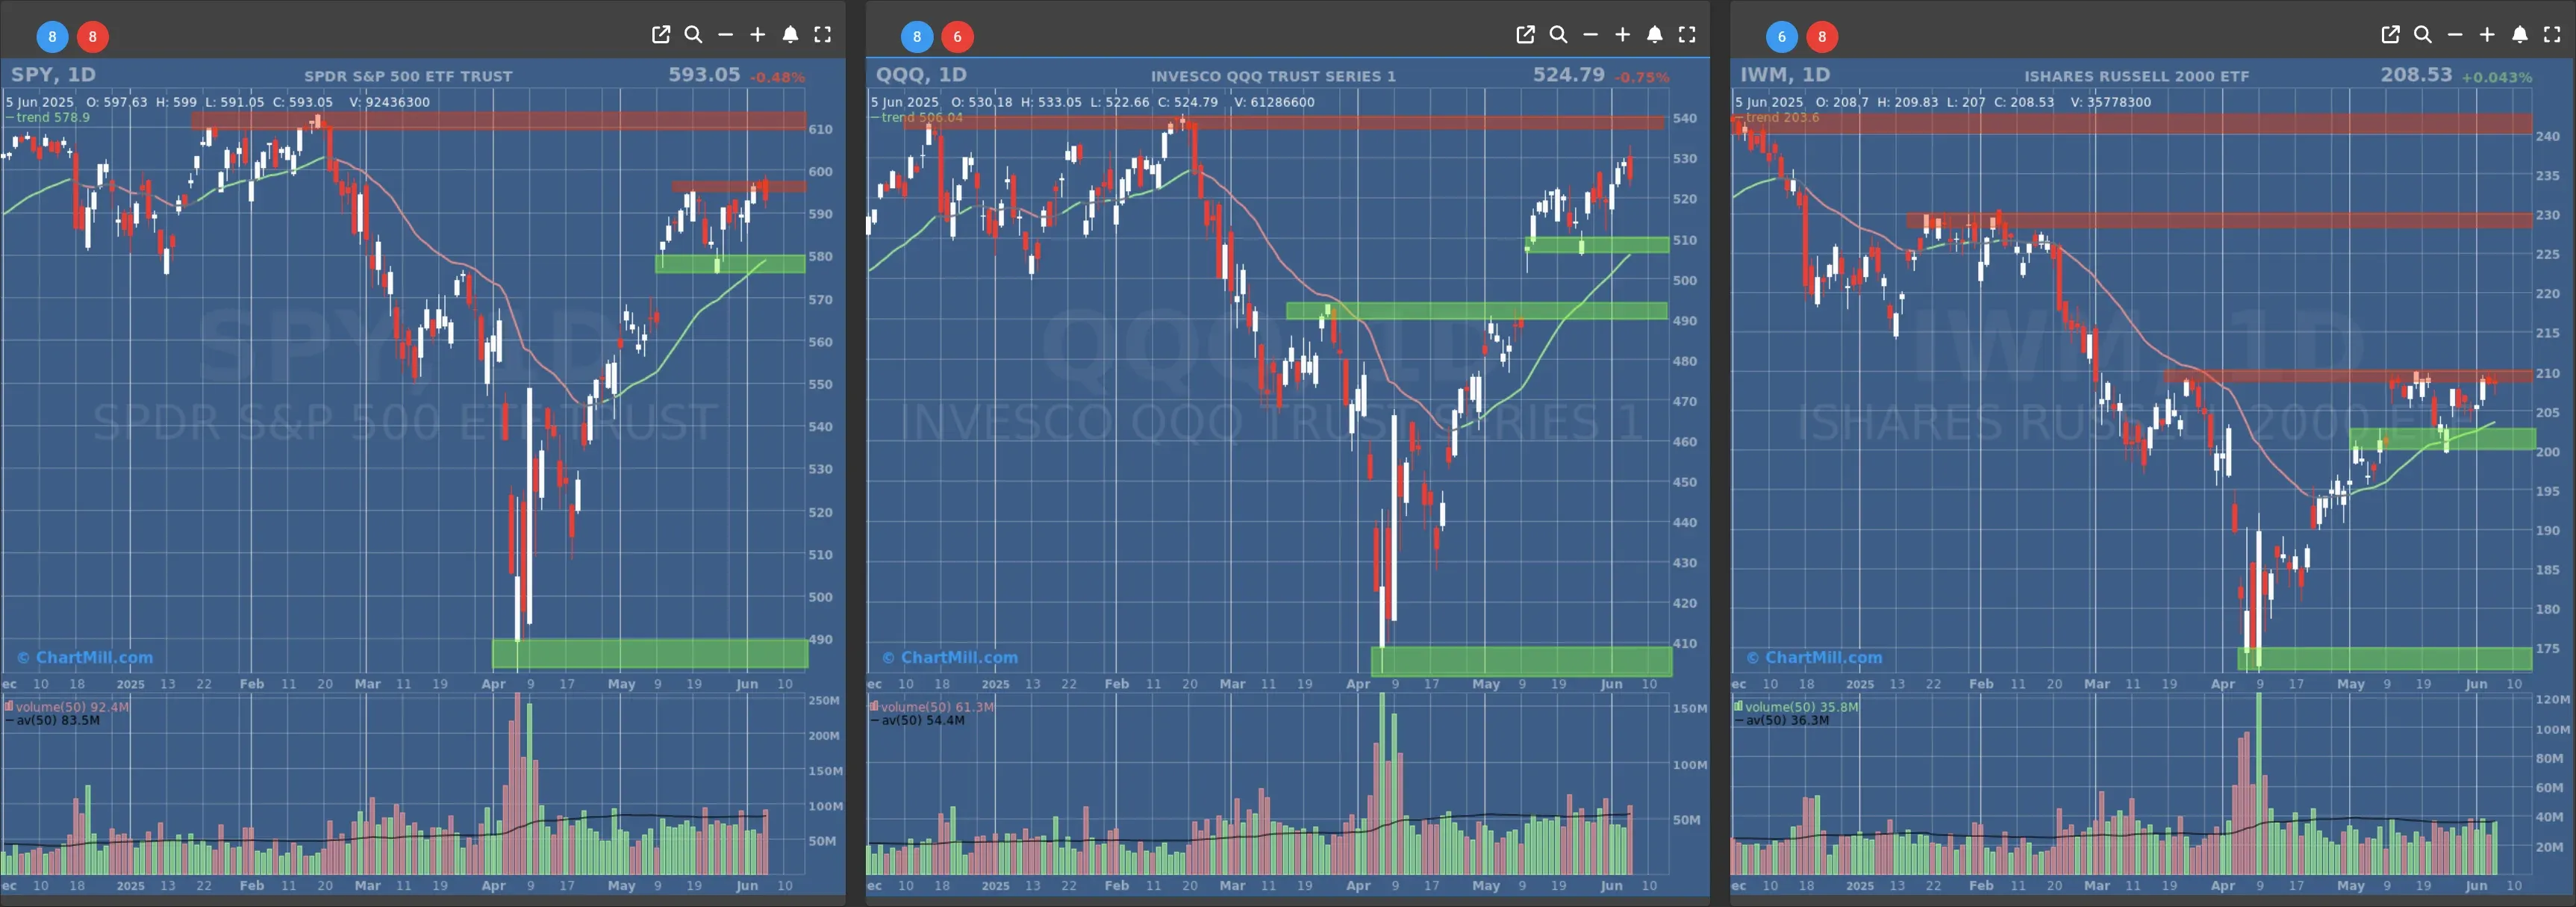
- Short-Term Trend: Bullish (no change)
- Next Support at $580
- Next Resistance at $610
- Volume: Below Average (50)
- Pattern: Doji Candle
- Short-Term Trend: Bullish (no change)
- Next Support at $520
- Next Resistance at $540
- Volume: Below Average (50)
- Pattern: Doji Candle
- Short-Term Trend: Bullish (no change)
- Next Support at $210 & $205
- Next Resistance at $215 & $230
- Volume: Slightly below Average (50)
- Pattern: Hanging Man Candle
Long Term Trend
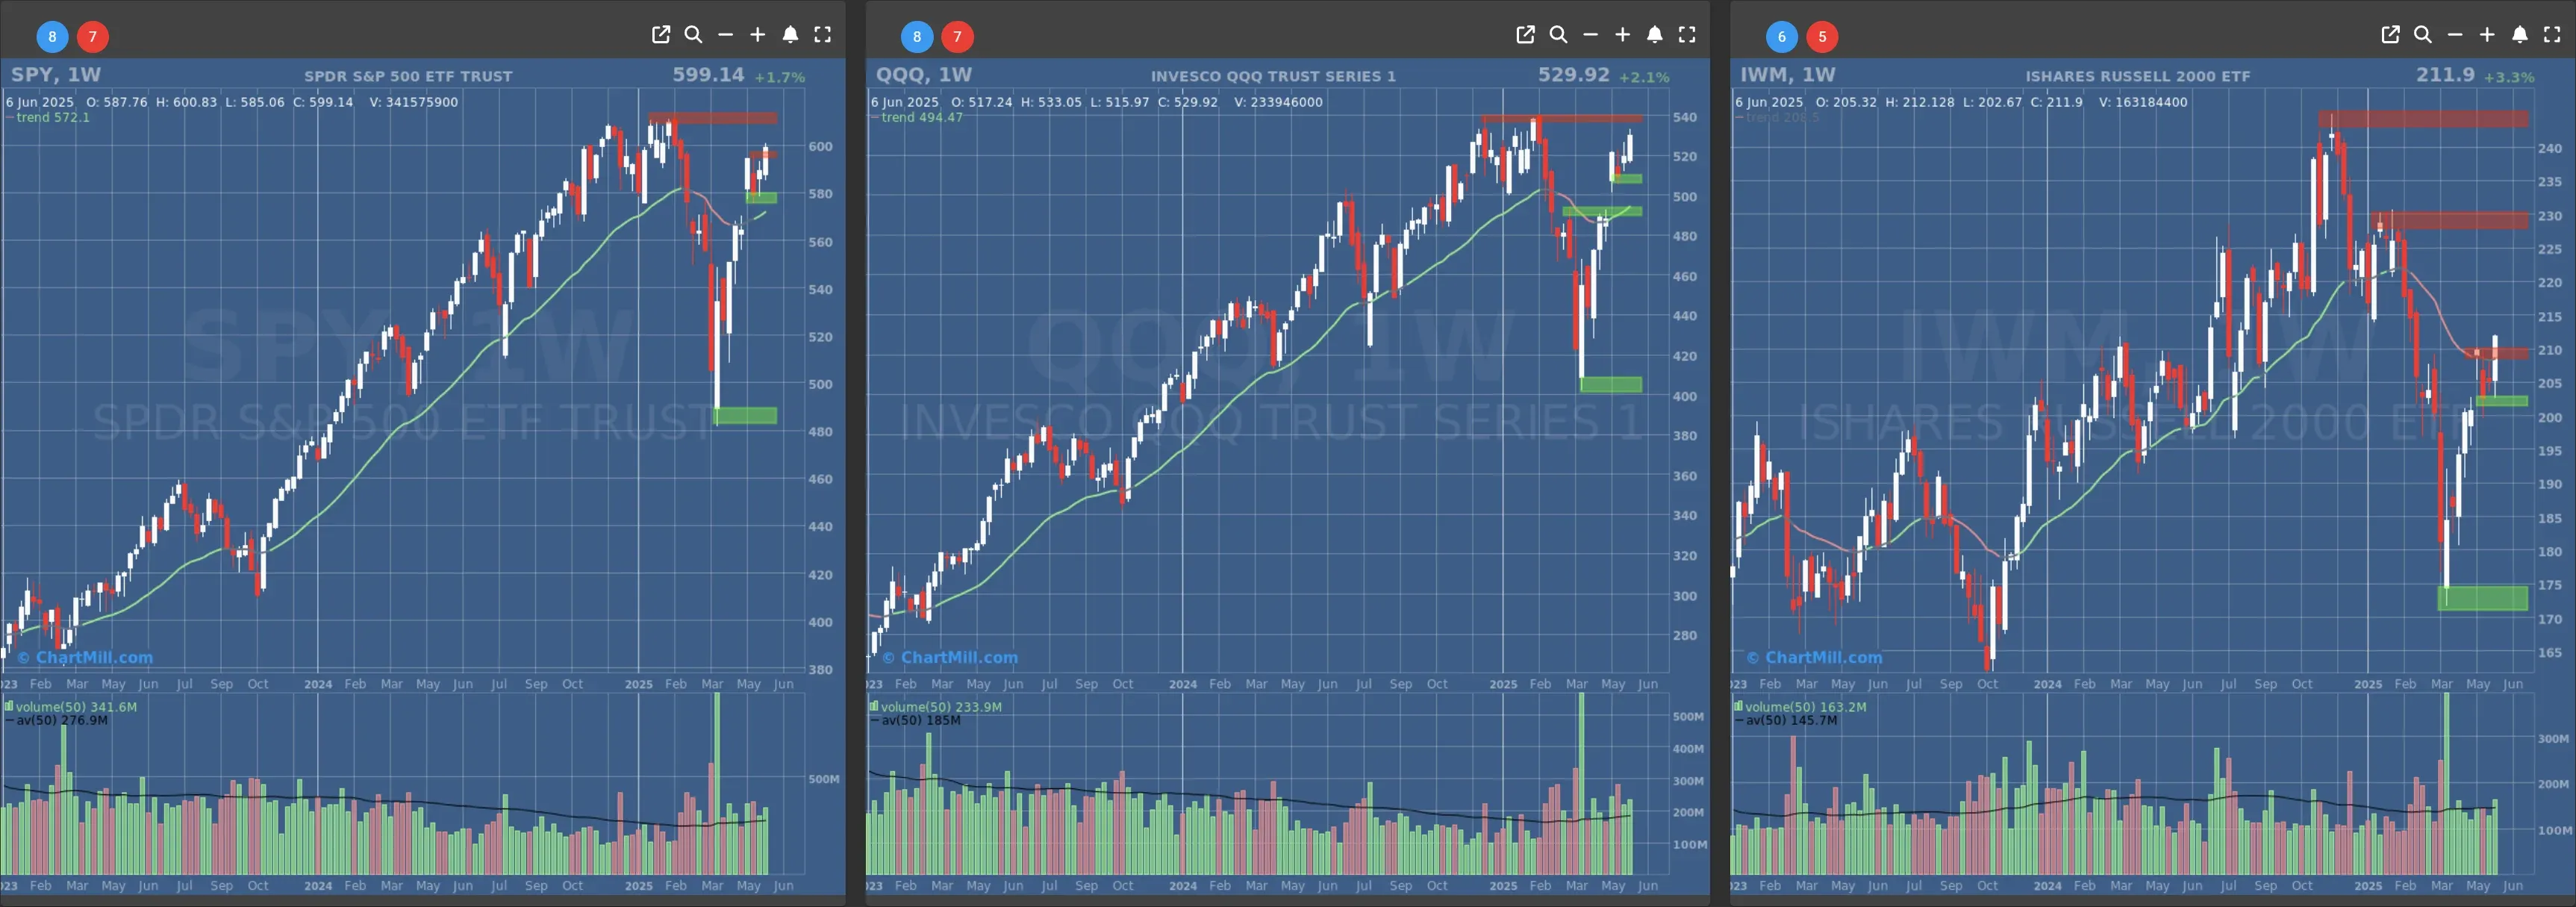
- Long-Term Trend: Positive (no change)
- Long-Term Trend: Positive (no change)
- Long-Term Trend: Neutral (no change)
Daily Market Breadth Analysis – June 06, 2025 (After Market Close)
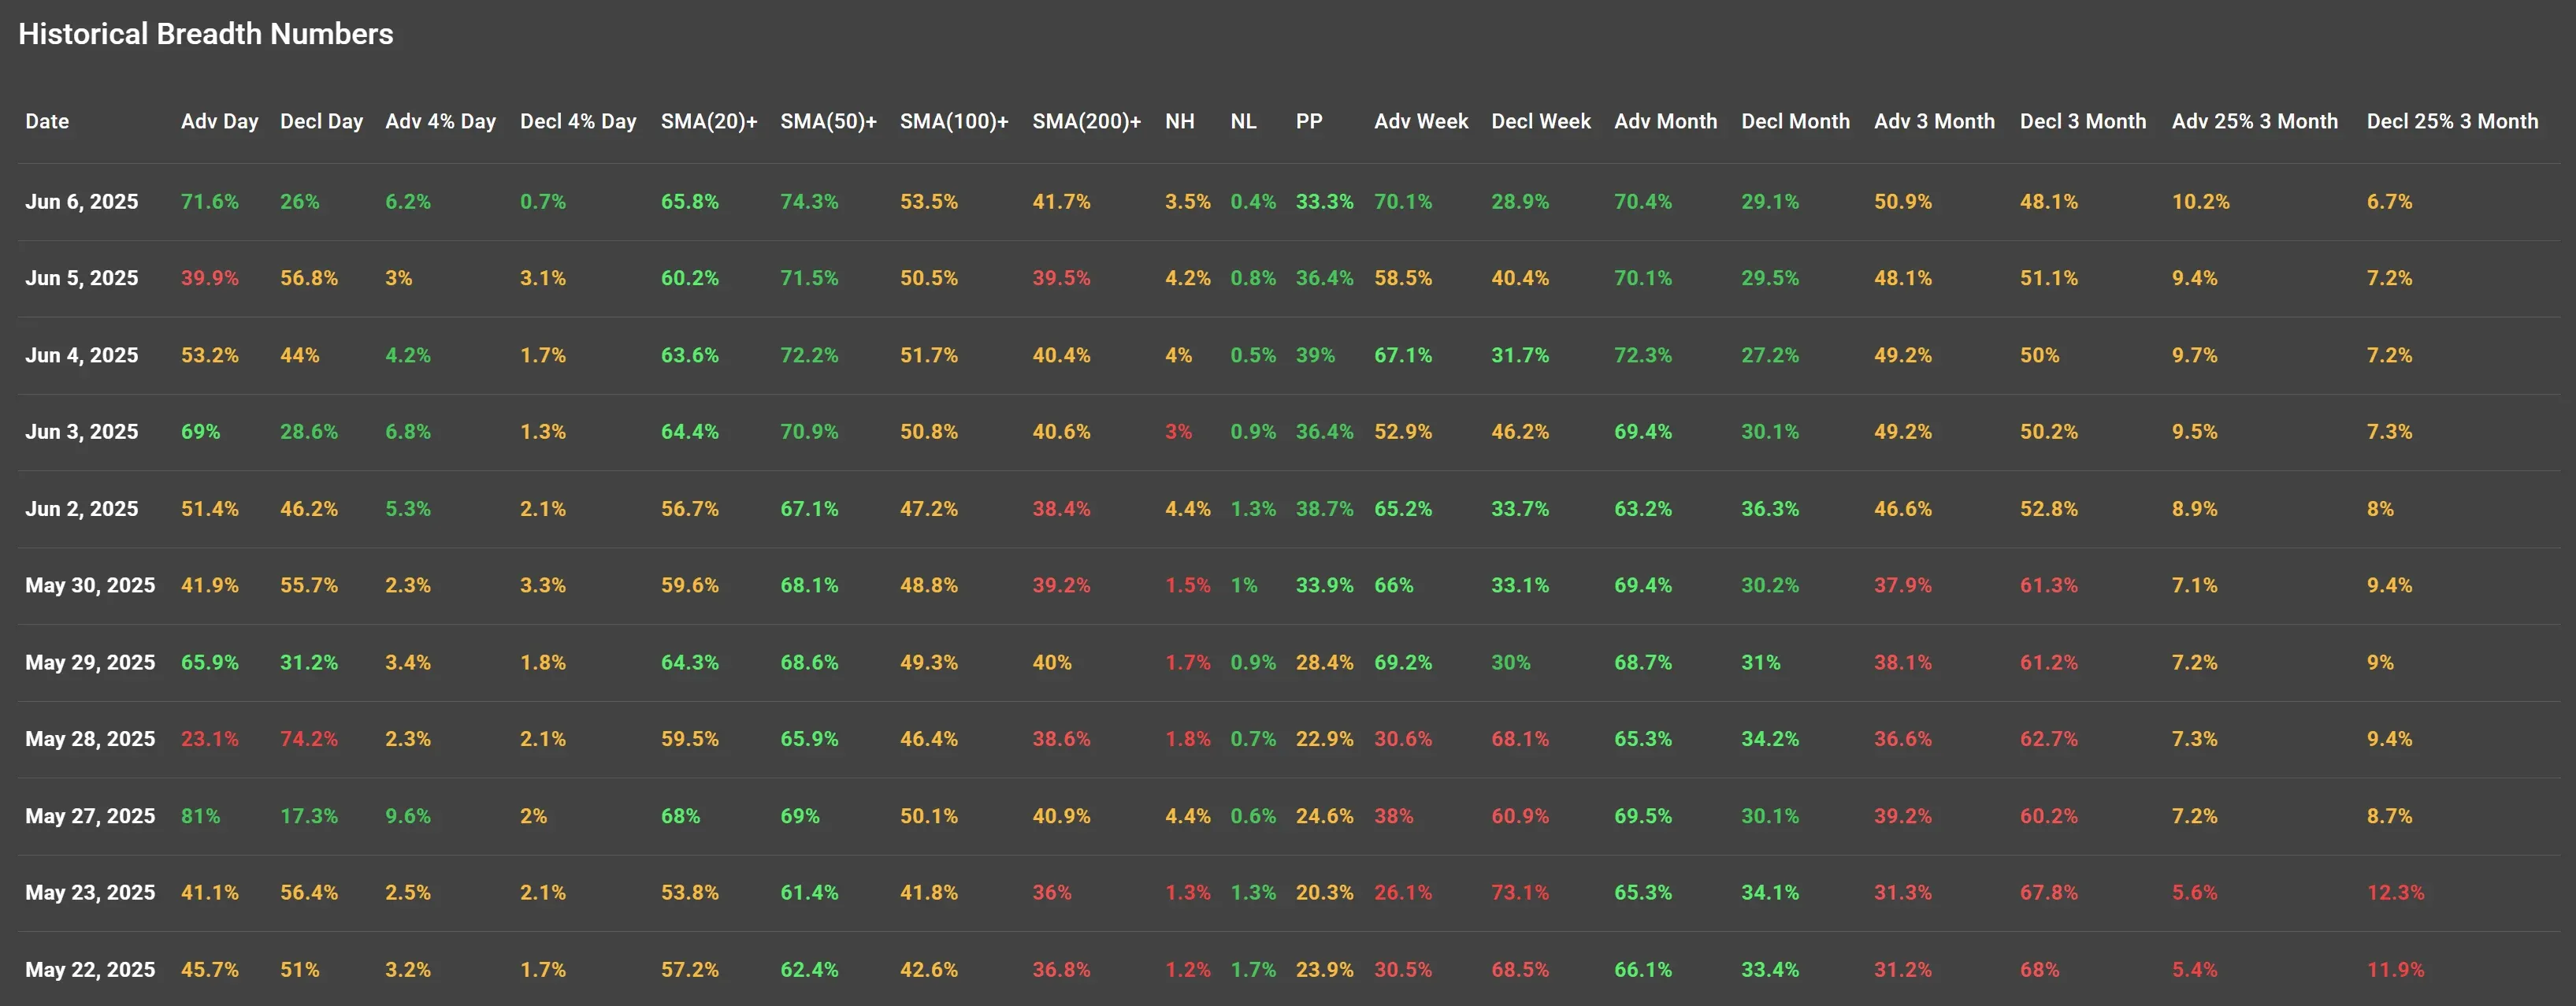
On Friday, June 6, market breadth metrics revealed a strong upside reversal in participation. Approximately 71.6% of all stocks advanced, significantly higher than Thursday’s 39.9%.
Declining stocks fell to 26%, indicating a broad rally rather than isolated strength.
This upsurge confirms and amplifies Thursday’s mixed signals, which showed slightly improving SMA metrics but lacked confirmation from the majority of advancing stocks. The June 6 data clearly flips the short-term tone back to bullish.
Key Observations:
Advancing vs Declining Stocks
The percentage of advancing stocks surged to 71.6%, while decliners dropped to 26%.
This follows Thursday’s weak breadth, where declining stocks outpaced advancers by more than 15 percentage points.
Momentum in Strong Movers (±4%)
6.2% of stocks advanced by 4% or more, versus just 0.7% declining 4%+, a major improvement over the previous day’s 3%/3.1% split.
Moving Average Participation
All key averages improved, especially the longer-term SMA(200), reinforcing the strength of the rally.
New Highs vs New Lows
-
New highs (NH): 3.5% (slightly down from 4.2%)
-
New lows (NL): 0.4% (down from 0.8%)
While the number of new highs dipped slightly, new lows dropped even more, showing a healthier market with less downside pressure.
Context vs Previous Sessions
This surge in market breadth comes after several sessions of mixed to improving metrics. As noted in our previous analysis:
“There’s cautious improvement in SMA breadth, but weak advancing volume and narrow leadership raise questions about sustainability.”
That question appears to be answered, June 6 saw confirmation across multiple breadth fronts, from SMA levels to explosive breadth in advancing stocks.
It builds upon the early strength seen on June 3 and June 4, forming a strong 3-out-of-4-day rally pattern.
Weekly and Monthly Breadth Outlook
-
Advancing stocks over the past week: 70.1%
-
Advancing stocks over the past month: 70.4%
These consistent levels near 70% confirm that the rally is more than a one-day wonder, it reflects sustained improvement.
Even the 3-month advancing vs declining measures are now nearly balanced:
-
Adv 3-Mo: 50.9%
-
Decl 3-Mo: 48.1%
The >25% movers also show improving sentiment:
-
Adv >25% (3 Mo): 10.2% (rising)
-
Decl >25% (3 Mo): 6.7% (falling)
Visual Insight
The chart below illustrates the sharp rebound in advancing stocks and the corresponding drop in declining stocks over the last 11 sessions.
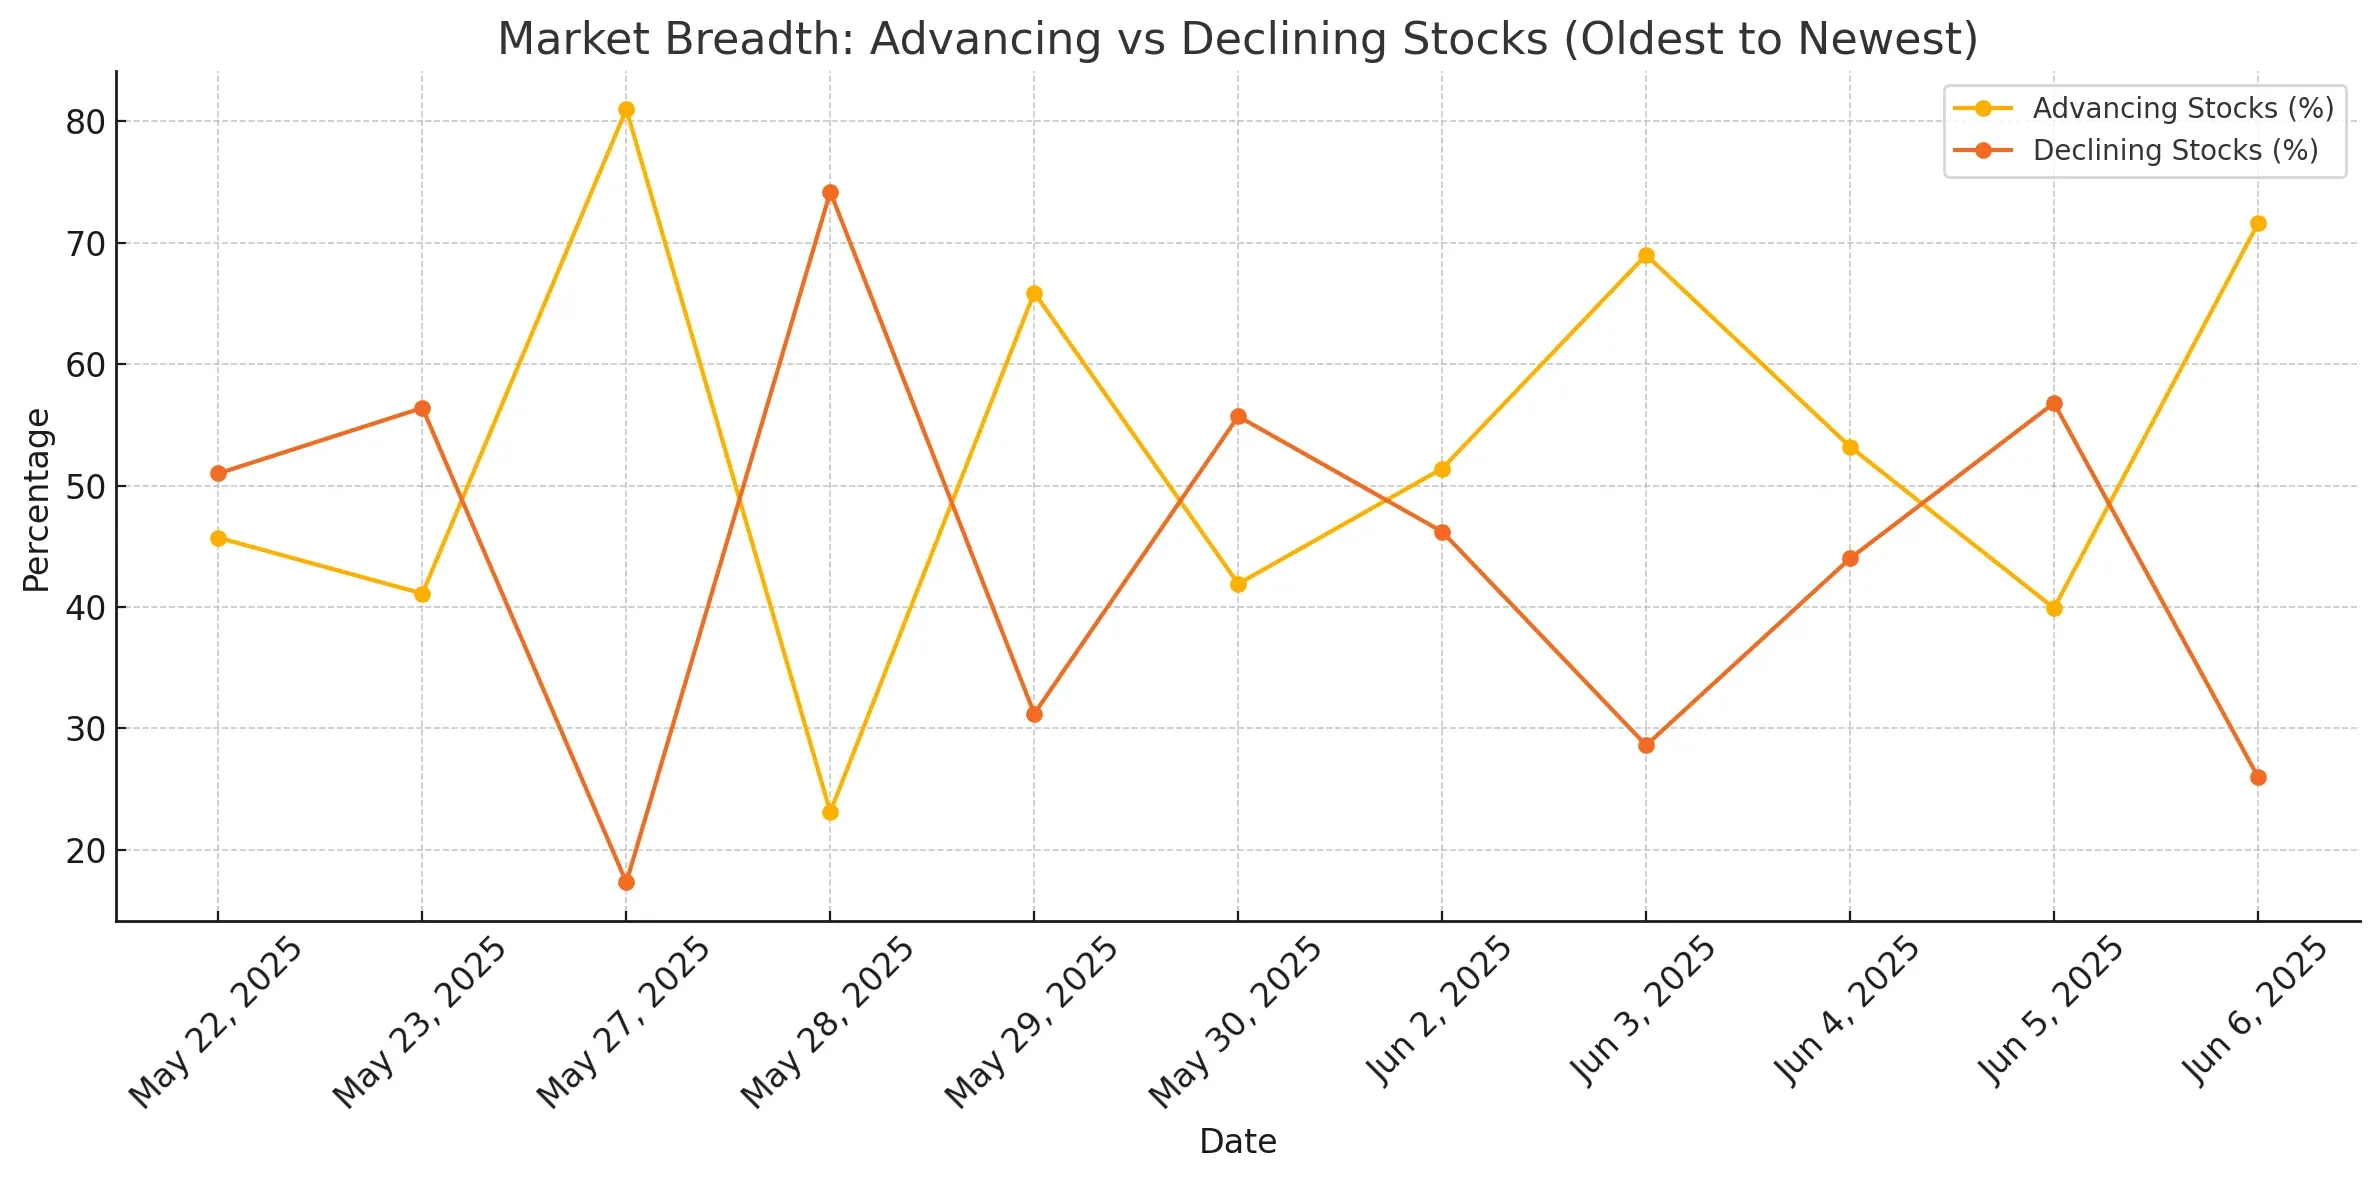
After the extreme weakness seen on May 28 (23.1% advancers vs 74.2% decliners), breadth has steadily improved, culminating in today’s bullish follow-through.
Conclusion: Strength Confirmed, But Watch Follow-Through
The June 6 session confirms that breadth is not only improving but now supporting the index-level gains we’ve seen in the major averages. The percentage of stocks trading above key SMAs and the volume in strong movers (>4%) add further conviction.
Going into the week of June 9, attention should focus on whether this improved breadth persists and how it reacts to upcoming macro catalysts (e.g., U.S.-China trade talks). Consistent breadth like this typically precedes stronger market trends.
Next to read: ChartMill Market Monitor News
211.9
+3.37 (+1.62%)
529.92
+5.13 (+0.98%)
599.14
+6.09 (+1.03%)
Find more stocks in the Stock Screener
IWM Latest News and Analysis
 7 hours ago - ChartmillMarket Monitor Trends (SPY, QQQ, IWM) and Breadth June 09
The June 6 session confirms that breadth is not only improving but now supporting the index-level gains we’ve seen in the major averages.
 3 days ago - ChartmillMarket Monitor Trends (SPY, QQQ, IWM) and Breadth June 06
SPY, QQQ both showing a distribution day after yesterday's session (down on above-average volume near the high).
 4 days ago - ChartmillMarket Monitor Trends (SPY, QQQ, IWM) and Breadth June 05
Breadth readings remain firm for now, this appears to be a healthy pause, not a reversal.
 6 days ago - ChartmillMarket Monitor Trends (SPY, QQQ, IWM) and Breadth June 04
Both the QQQ and the SPY broke out above their main resistance levels today.
 7 days ago - ChartmillMarket Monitor Trends (SPY, QQQ, IWM) and Breadth June 02
The indices continue to quote close to their next resistance. While headline indices may show only minor daily fluctuations, the underlying breadth data paints a more fragile picture.
 10 days ago - ChartmillMarket Monitor Trends (SPY, QQQ, IWM) and Breadth May 30
The data from May 29, 2025, confirms that market breadth has rebounded significantly, with strong participation and improving technical metrics across shorter moving averages.
 11 days ago - ChartmillMarket Monitor Trends (SPY, QQQ, IWM) and Breadth May 29
The breadth indicators signal a fragile and reactive market environment, prone to sharp swings and lacking sustained leadership. Bullish momentum may struggle to gain lasting traction.
 12 days ago - ChartmillMarket Monitor Trends (SPY, QQQ, IWM) and Breadth May 28
The May 27 surge in breadth confirms the bullish price action observed across major indices on that day, reinforcing the move’s credibility.
 14 days ago - ChartmillMarket Monitor Trends (SPY, QQQ, IWM) and Breadth May 26
The latest data show a market that is weakening internally, with fewer stocks supporting any upside and an increasing tilt toward broad-based selling.
 17 days ago - ChartmillMarket Monitor Trends (SPY, QQQ, IWM) and Breadth May 23
The market is in a cautious phase with waning momentum.
 18 days ago - ChartmillMarket Monitor Trends (SPY, QQQ, IWM) and Breadth May 22
The broad-based selling on May 21 wasn't a surprise, it was preceded by several days of narrowing breadth.
 19 days ago - ChartmillMarket Monitor Trends (SPY, QQQ, IWM) and Breadth May 21
While the major indices are holding up, breadth is beginning to diverge and fewer stocks are driving the rally, market participation is waning.
