Market Monitor Trends (SPY, QQQ, IWM) and Breadth June 06
By Kristoff De Turck - reviewed by Aldwin Keppens
Last update: Jun 6, 2025
(All data & visualisations by ChartMill.com)
Daily Market Trend Analysis – June 05, 2025 (After Market Close)
SPY, QQQ both showing a distribution day after yesterday's session (down on above-average volume near the high).
-
For the SPY, IT is the third distribution day within the current price range since May 12, 2025.
-
For the QQQ, it is the second distribution day in the same time frame of about 3 weeks.
-
The Russell 2000 index etf IWM also shows two previous distribution days.
This does not mean that we will automatically go lower but caution is certainly advised.
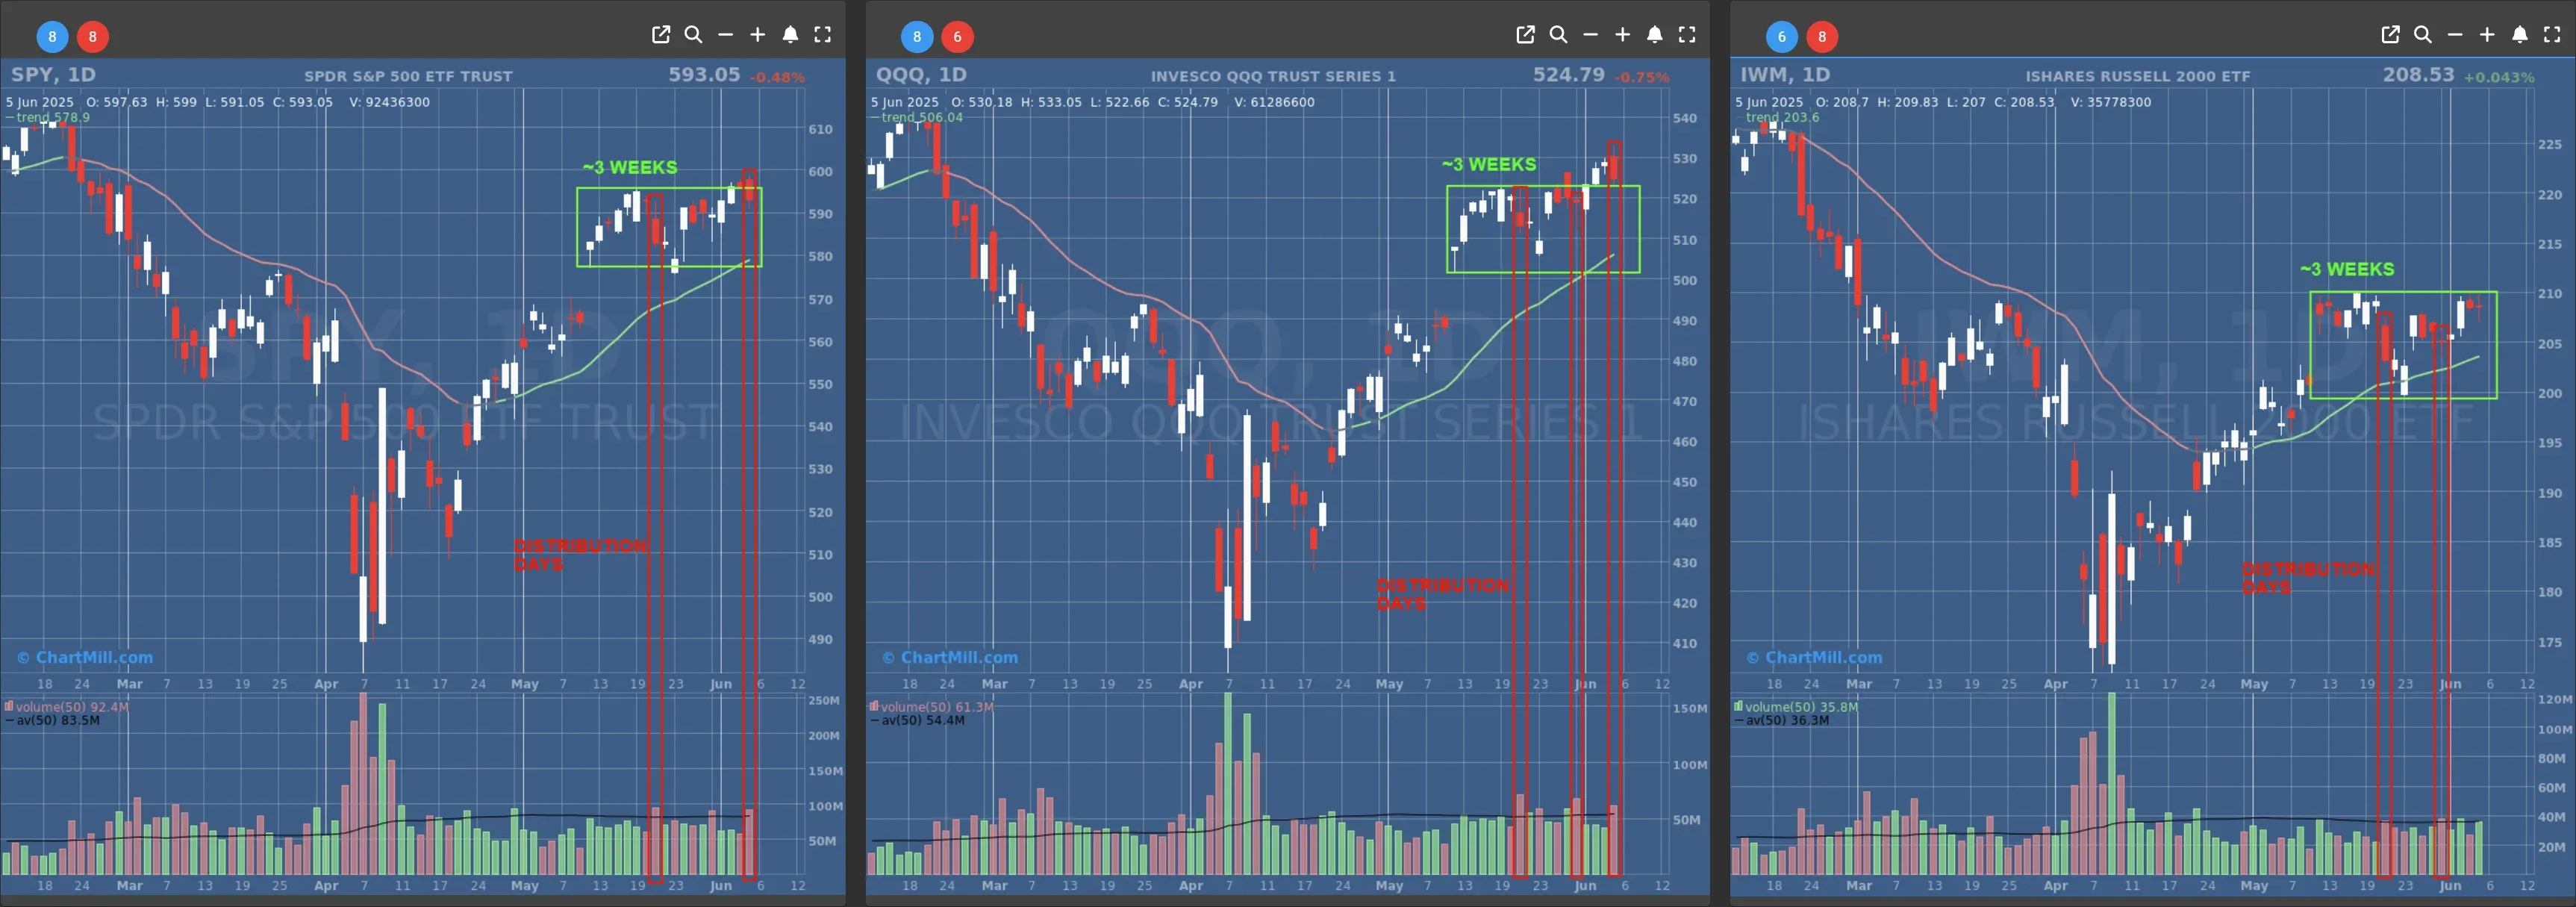
The all-time highs for SPY and QQQ are not far away and the scenario so far is still that they will be reached in the coming days/weeks.
Short Term Trend
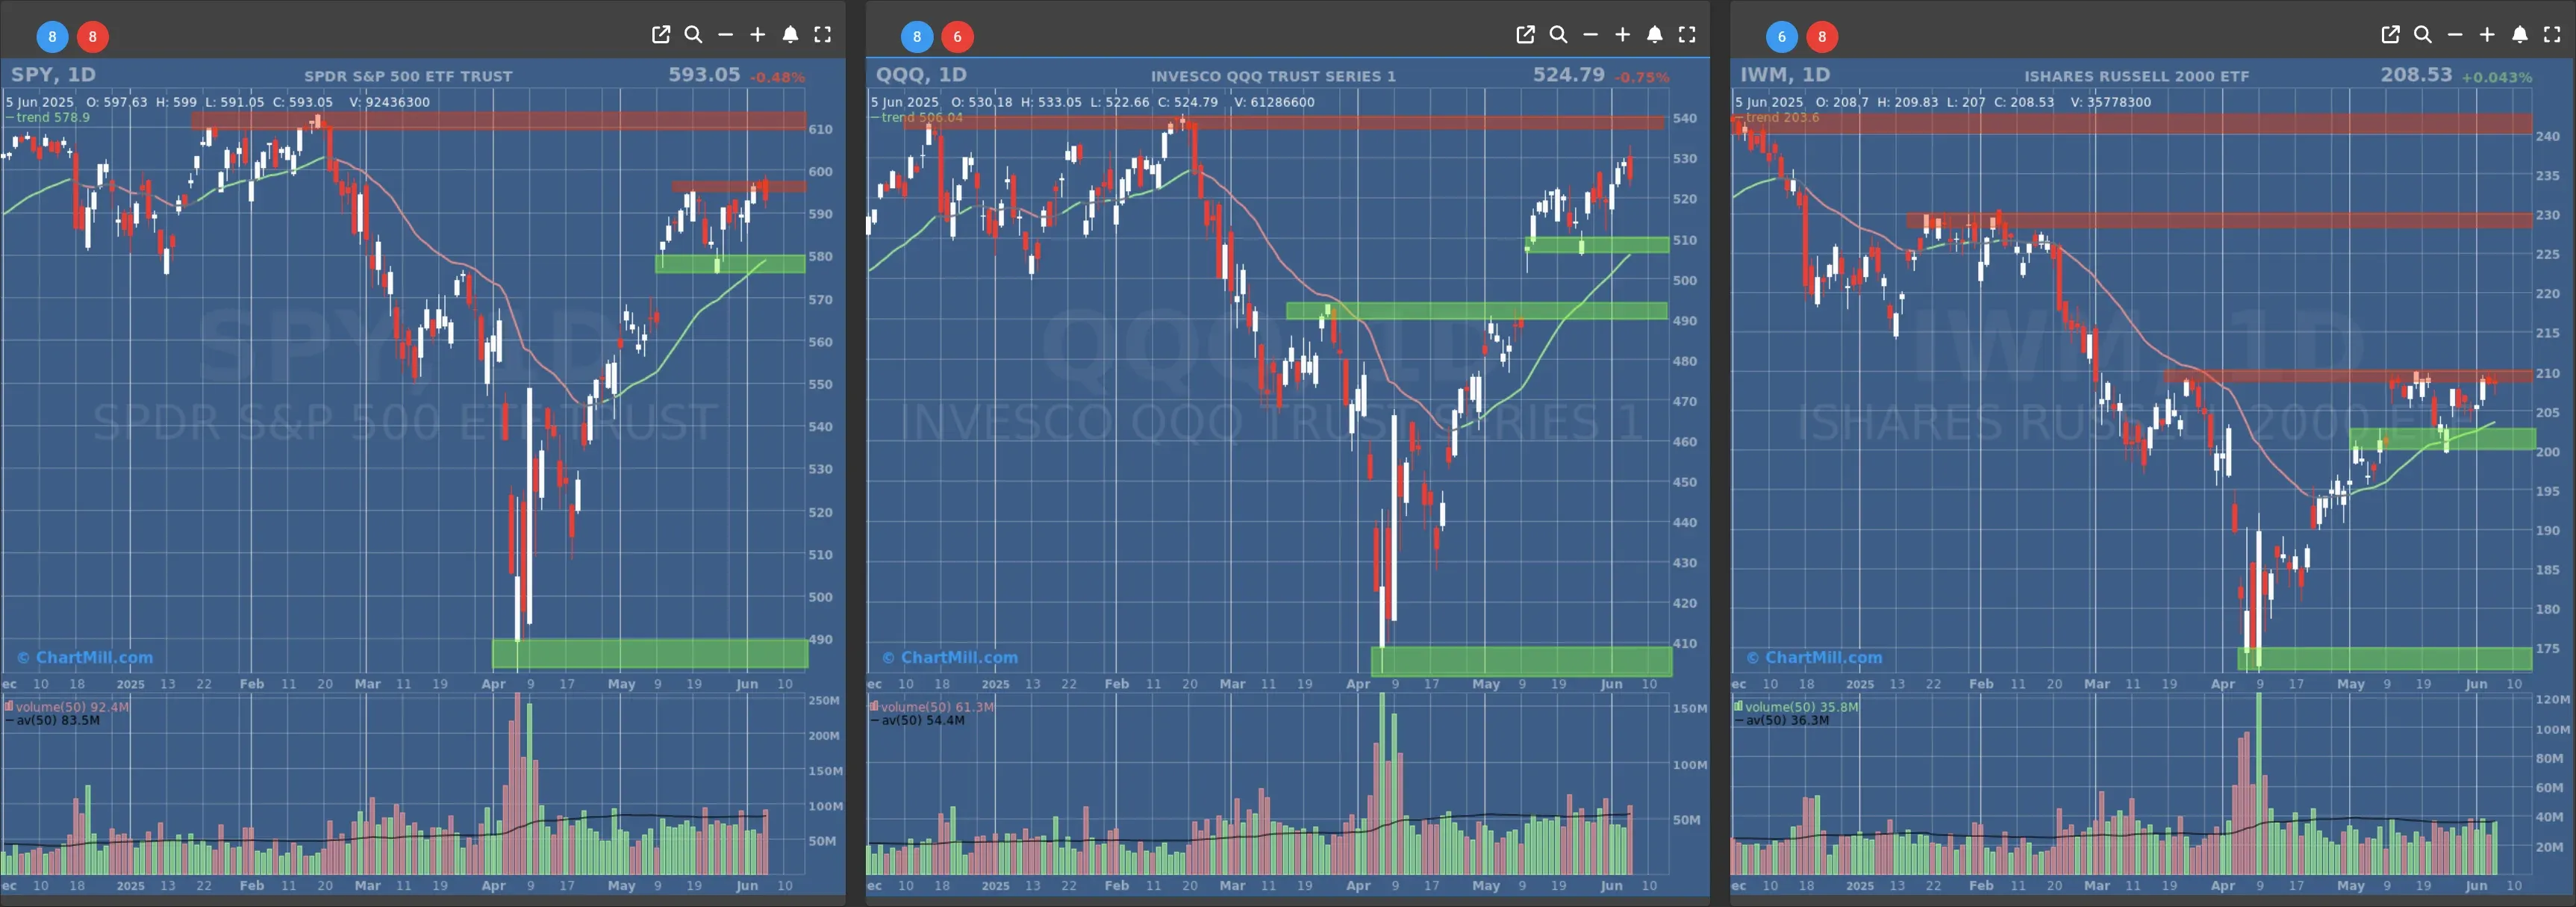
- Short-Term Trend: Bullish (no change)
- Next Support at $570
- Next Resistance at $595
- Volume: Above Average (50)
- Pattern: Distribution Down Day, Bearish Engulfing
- Short-Term Trend: Bullish (no change)
- Next Support at $490
- Next Resistance at $520
- Volume: Above Average (50)
- Pattern: Distribution Down Day, Bearish Engulfing
- Short-Term Trend: Bullish (no change)
- Next Support at $200
- Next Resistance at $205 & $210
- Volume: At Average (50)
- Pattern: Doji Candle, completed inversed H&S pattern
Long Term Trend
- Long-Term Trend: Positive (no change)
- Long-Term Trend: Positive (no change)
- Long-Term Trend: Neutral (no change)
Daily Market Breadth Analysis – June 05, 2025 (After Market Close)
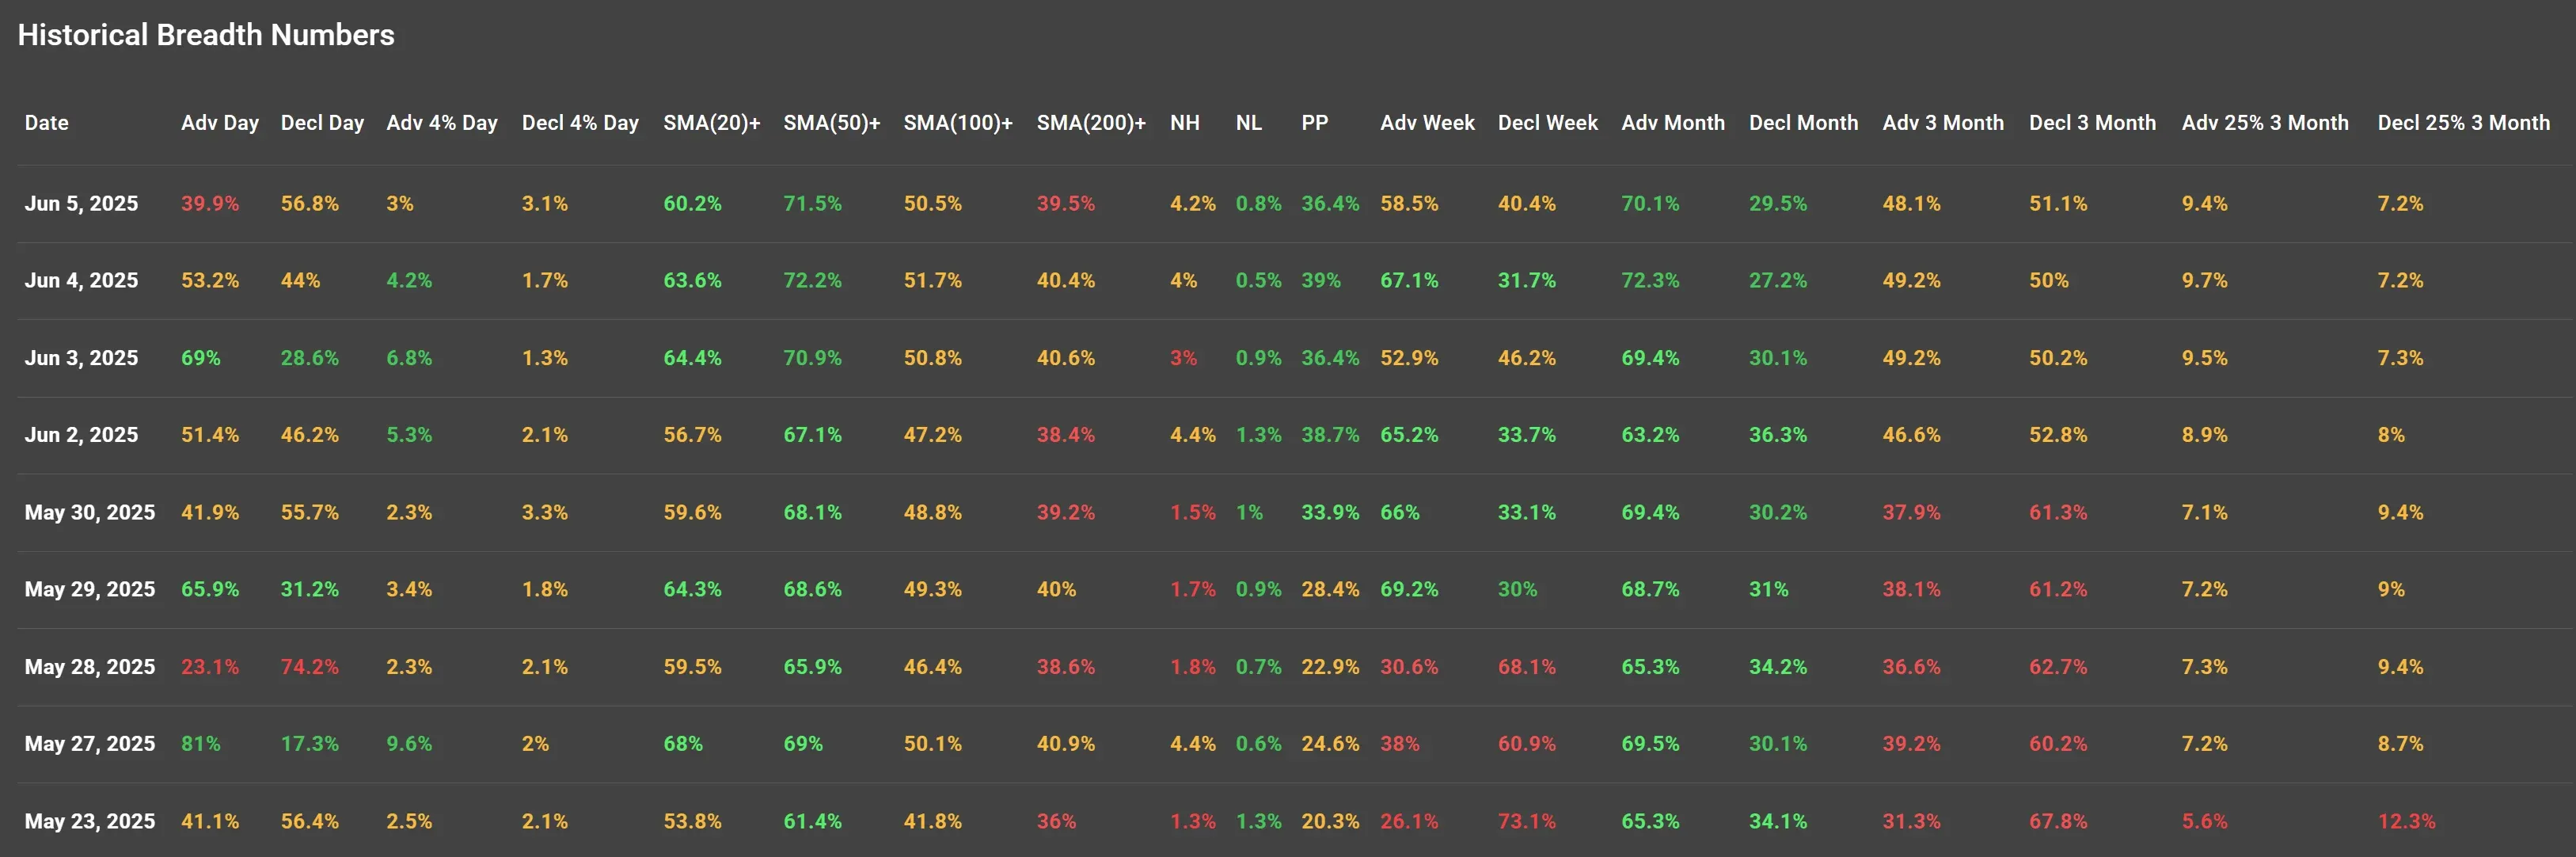
After a promising breadth signal earlier this week, the latest data from June 5 paints a more cautious picture.
Thursday's session showed weakening internals, with breadth indicators turning negative again across several key metrics.
Let’s break down what happened and how it compares to the prior sessions.
Declining Breadth After Brief Optimism
On June 5, only 39.9% of stocks advanced while 56.8% declined, a reversal from the solid breadth seen just two days earlier on June 3, when advancing stocks peaked at 69%. The drop-off signals a fading momentum and a growing defensive stance among investors.
This is a clear shift from our June 4 analysis, where we noted that although market breadth had narrowed from June 3, more than half of the stocks were still gaining (53.2%). The continuation of the downtrend suggests the bullish sentiment was short-lived.
Moving Average Participation Remains Stable But Stalled
Despite Thursday's weakness, the percentage of stocks above their:
-
20-day SMA stands at 60.2%
-
50-day SMA remains strong at 71.5%
-
100-day SMA is hovering at 50.5%
-
200-day SMA, however, lags at just 39.5%
This tells us that while short- to medium-term trends remain broadly intact, long-term trend participation has not meaningfully improved.
For context, these metrics are only marginally lower than on June 4 and June 3, suggesting recent price weakness hasn't yet broken the broader uptrend, but it's close to doing so.
Longer-Term Participation Ratios Are Eroding
Looking at the 3-month horizon:
-
Advancing Stocks (3-Month) dipped slightly to 48.1%, now below the 50% mark.
-
Declining Stocks (3-Month) climbed to 51.1%, showing a slow but steady shift in favor of bears.
Even more telling is that this is the third straight session where declining stocks outpaced advancing ones on a 3-month basis. It reflects a gradual deterioration in underlying strength, even though broader indexes may not yet reflect that weakness outright.
Breadth Momentum: Losing Steam
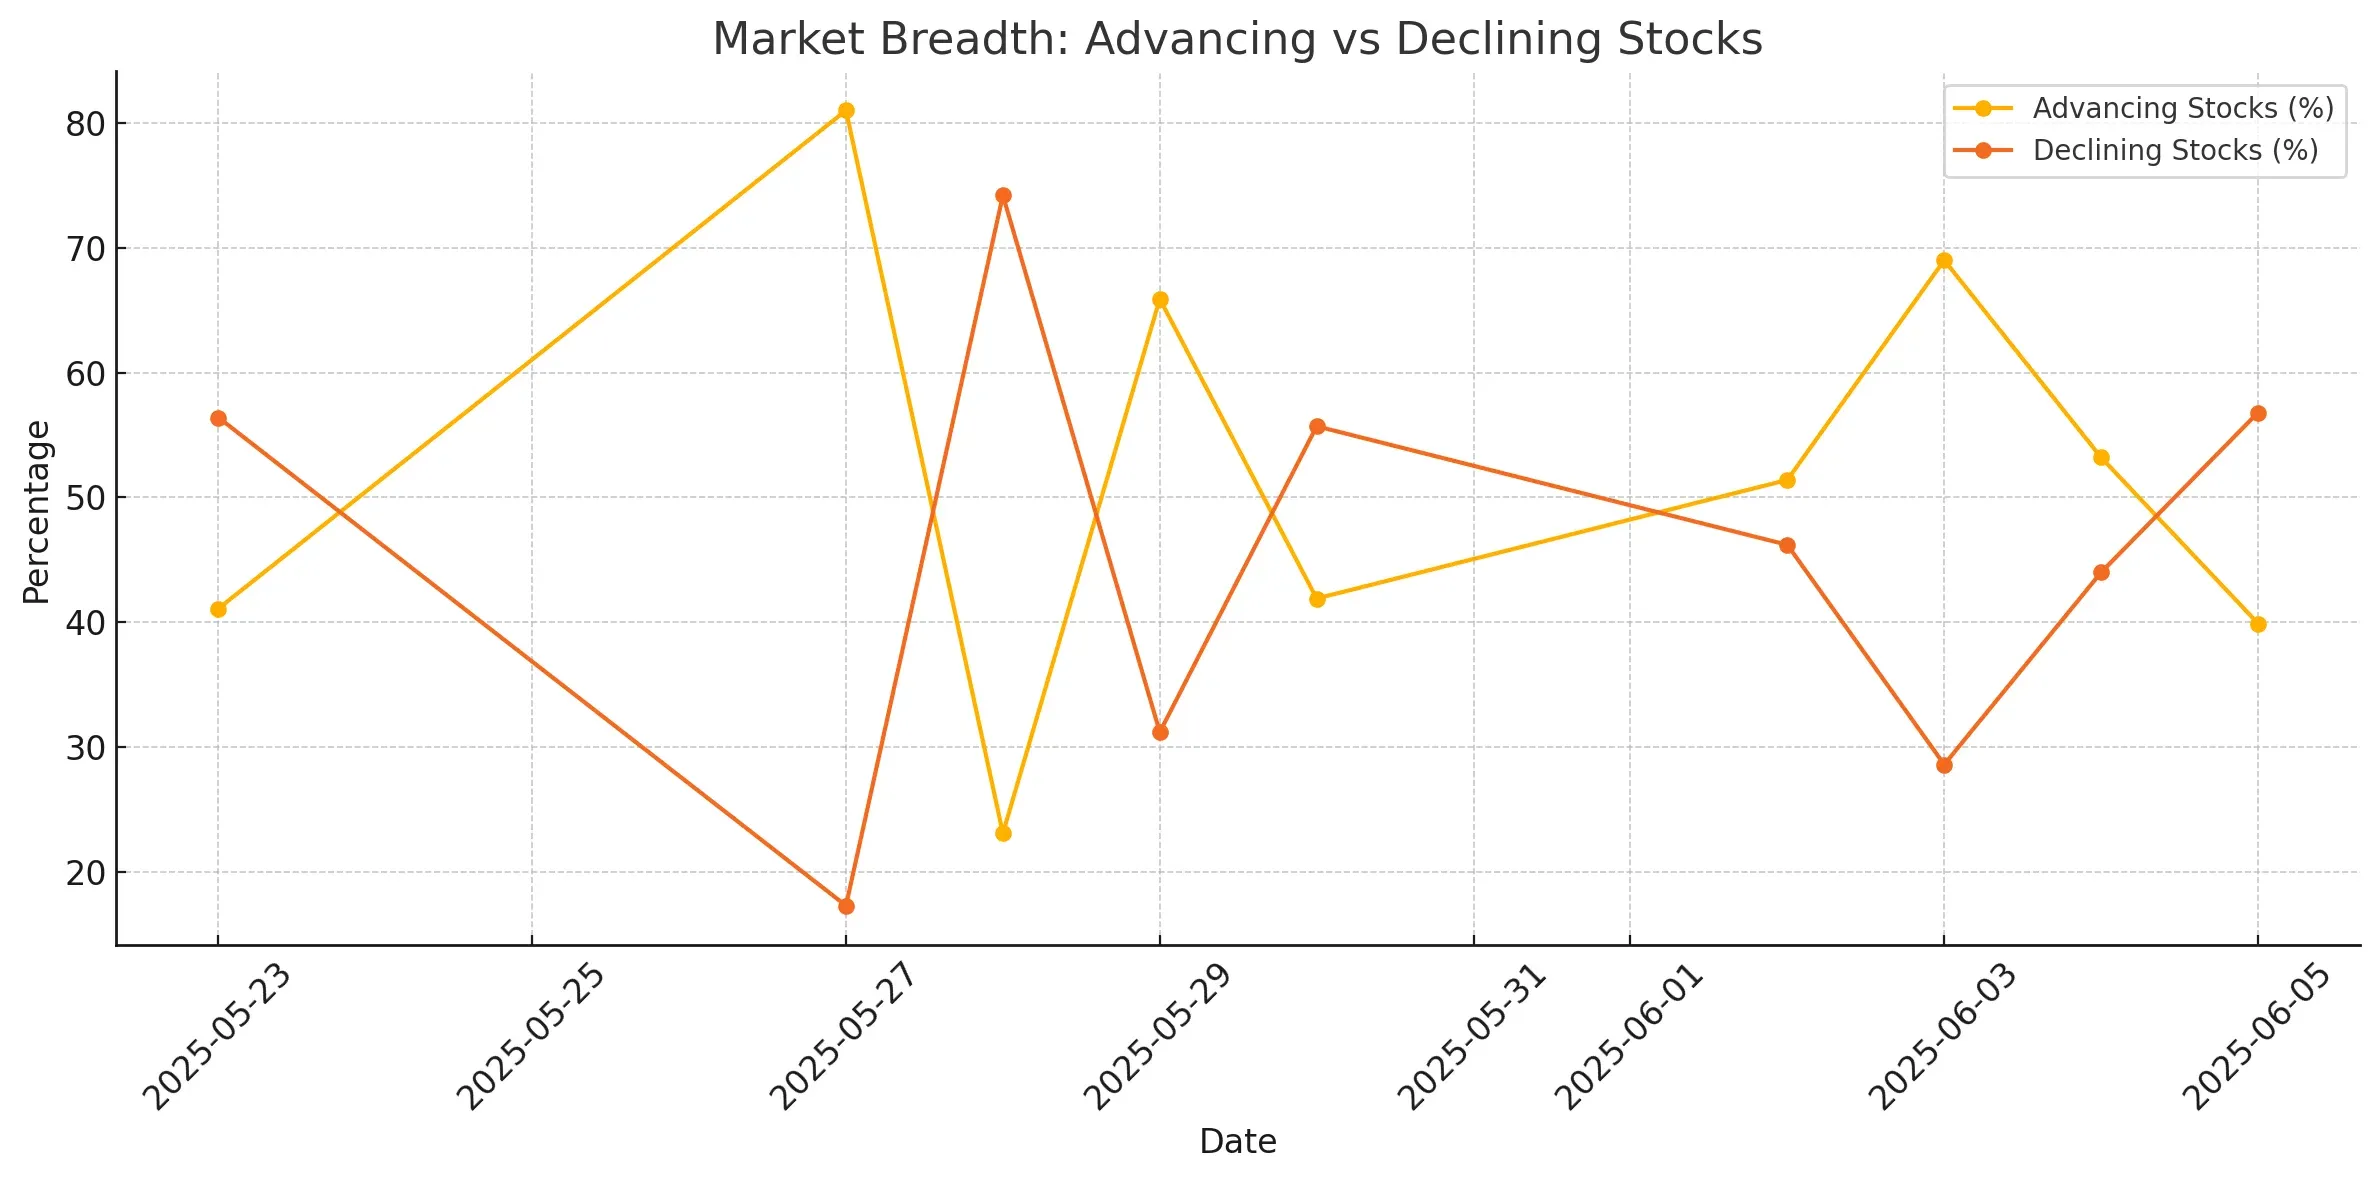
Our visual (above) highlights the tug-of-war between advancing and declining stocks over the past two weeks. The June 3 spike in advancing stocks appears to be a short-term anomaly, followed immediately by lower participation on June 4 and now clear negative breadth on June 5.
This repeated failure to hold gains suggests poor follow-through, a hallmark of indecisive or weakening markets. Unless the advance/decline ratio improves significantly in the coming days, this could signal the start of a broader pullback.
Conclusion: Tread Cautiously
Market breadth has weakened noticeably following a strong performance earlier in the week. While medium-term trend indicators remain healthy, long-term support is still lacking, and the recent deterioration in participation, especially on a 3-month basis, is worth monitoring closely.
As we await Friday's job report, this faltering breadth may reflect growing market anxiety. If the data disappoints, we may see further deterioration. For now, caution is warranted..
Next to read: ChartMill Market Monitor News, June 06
211.9
+3.37 (+1.62%)
529.92
+5.13 (+0.98%)
599.14
+6.09 (+1.03%)
Find more stocks in the Stock Screener
IWM Latest News and Analysis
 2 days ago - ChartmillMarket Monitor Trends (SPY, QQQ, IWM) and Breadth June 06
SPY, QQQ both showing a distribution day after yesterday's session (down on above-average volume near the high).
 3 days ago - ChartmillMarket Monitor Trends (SPY, QQQ, IWM) and Breadth June 05
Breadth readings remain firm for now, this appears to be a healthy pause, not a reversal.
 4 days ago - ChartmillMarket Monitor Trends (SPY, QQQ, IWM) and Breadth June 04
Both the QQQ and the SPY broke out above their main resistance levels today.
 6 days ago - ChartmillMarket Monitor Trends (SPY, QQQ, IWM) and Breadth June 02
The indices continue to quote close to their next resistance. While headline indices may show only minor daily fluctuations, the underlying breadth data paints a more fragile picture.
 9 days ago - ChartmillMarket Monitor Trends (SPY, QQQ, IWM) and Breadth May 30
The data from May 29, 2025, confirms that market breadth has rebounded significantly, with strong participation and improving technical metrics across shorter moving averages.
 10 days ago - ChartmillMarket Monitor Trends (SPY, QQQ, IWM) and Breadth May 29
The breadth indicators signal a fragile and reactive market environment, prone to sharp swings and lacking sustained leadership. Bullish momentum may struggle to gain lasting traction.
 11 days ago - ChartmillMarket Monitor Trends (SPY, QQQ, IWM) and Breadth May 28
The May 27 surge in breadth confirms the bullish price action observed across major indices on that day, reinforcing the move’s credibility.
 13 days ago - ChartmillMarket Monitor Trends (SPY, QQQ, IWM) and Breadth May 26
The latest data show a market that is weakening internally, with fewer stocks supporting any upside and an increasing tilt toward broad-based selling.
 16 days ago - ChartmillMarket Monitor Trends (SPY, QQQ, IWM) and Breadth May 23
The market is in a cautious phase with waning momentum.
 17 days ago - ChartmillMarket Monitor Trends (SPY, QQQ, IWM) and Breadth May 22
The broad-based selling on May 21 wasn't a surprise, it was preceded by several days of narrowing breadth.
 18 days ago - ChartmillMarket Monitor Trends (SPY, QQQ, IWM) and Breadth May 21
While the major indices are holding up, breadth is beginning to diverge and fewer stocks are driving the rally, market participation is waning.
 19 days ago - ChartmillMarket Monitor Trends (SPY, QQQ, IWM) and Breadth May 20
Markets continued to show resilience at the start of the week, with all major indices maintaining their short-term bullish trends.
