
(All data & visualisations by ChartMill.com)
Daily Market Trend Analysis – June 02, 2025 (After Market Close)
The major US index ETFs are trading back at the upper end of their current tight trading range.
Will we get a breakout toward all-time highs this week?
Short Term Trend
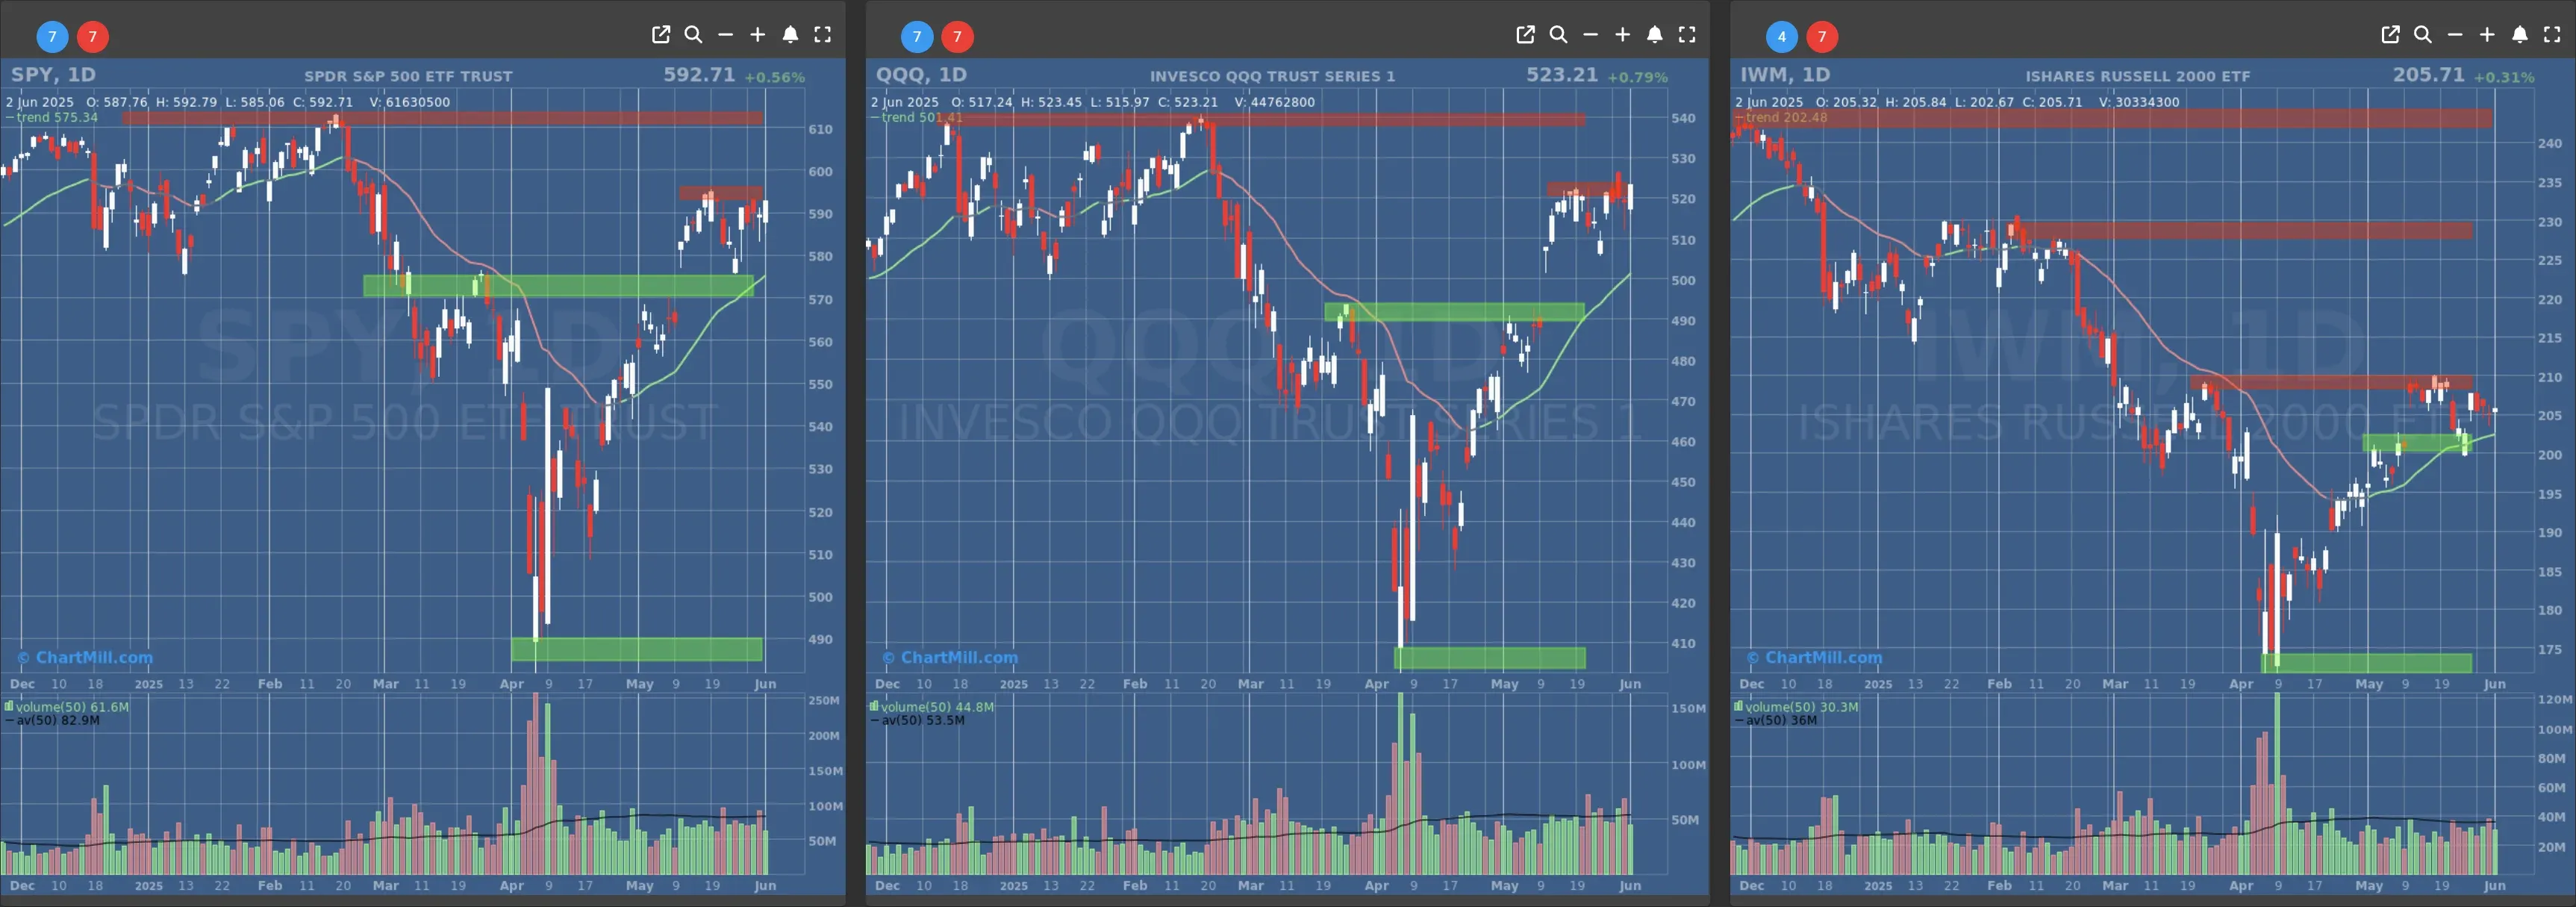
- Short-Term Trend: Bullish (no change)
- Next Support at $570
- Next Resistance at $595
- Volume: Slightly Below Average (50)
- Pattern: Bullish Engulfing, Up Day
- Short-Term Trend: Bullish (no change)
- Next Support at $490
- Next Resistance at $520
- Volume: Slightly Below Average (50)
- Pattern: Bullish Engulfing, Up Day
- Short-Term Trend: Bullish (no change)
- Next Support at $200
- Next Resistance at $205 & $210
- Volume: Slightly Below Average (50)
- Pattern: Doji Candle, Up Day
Long Term Trend
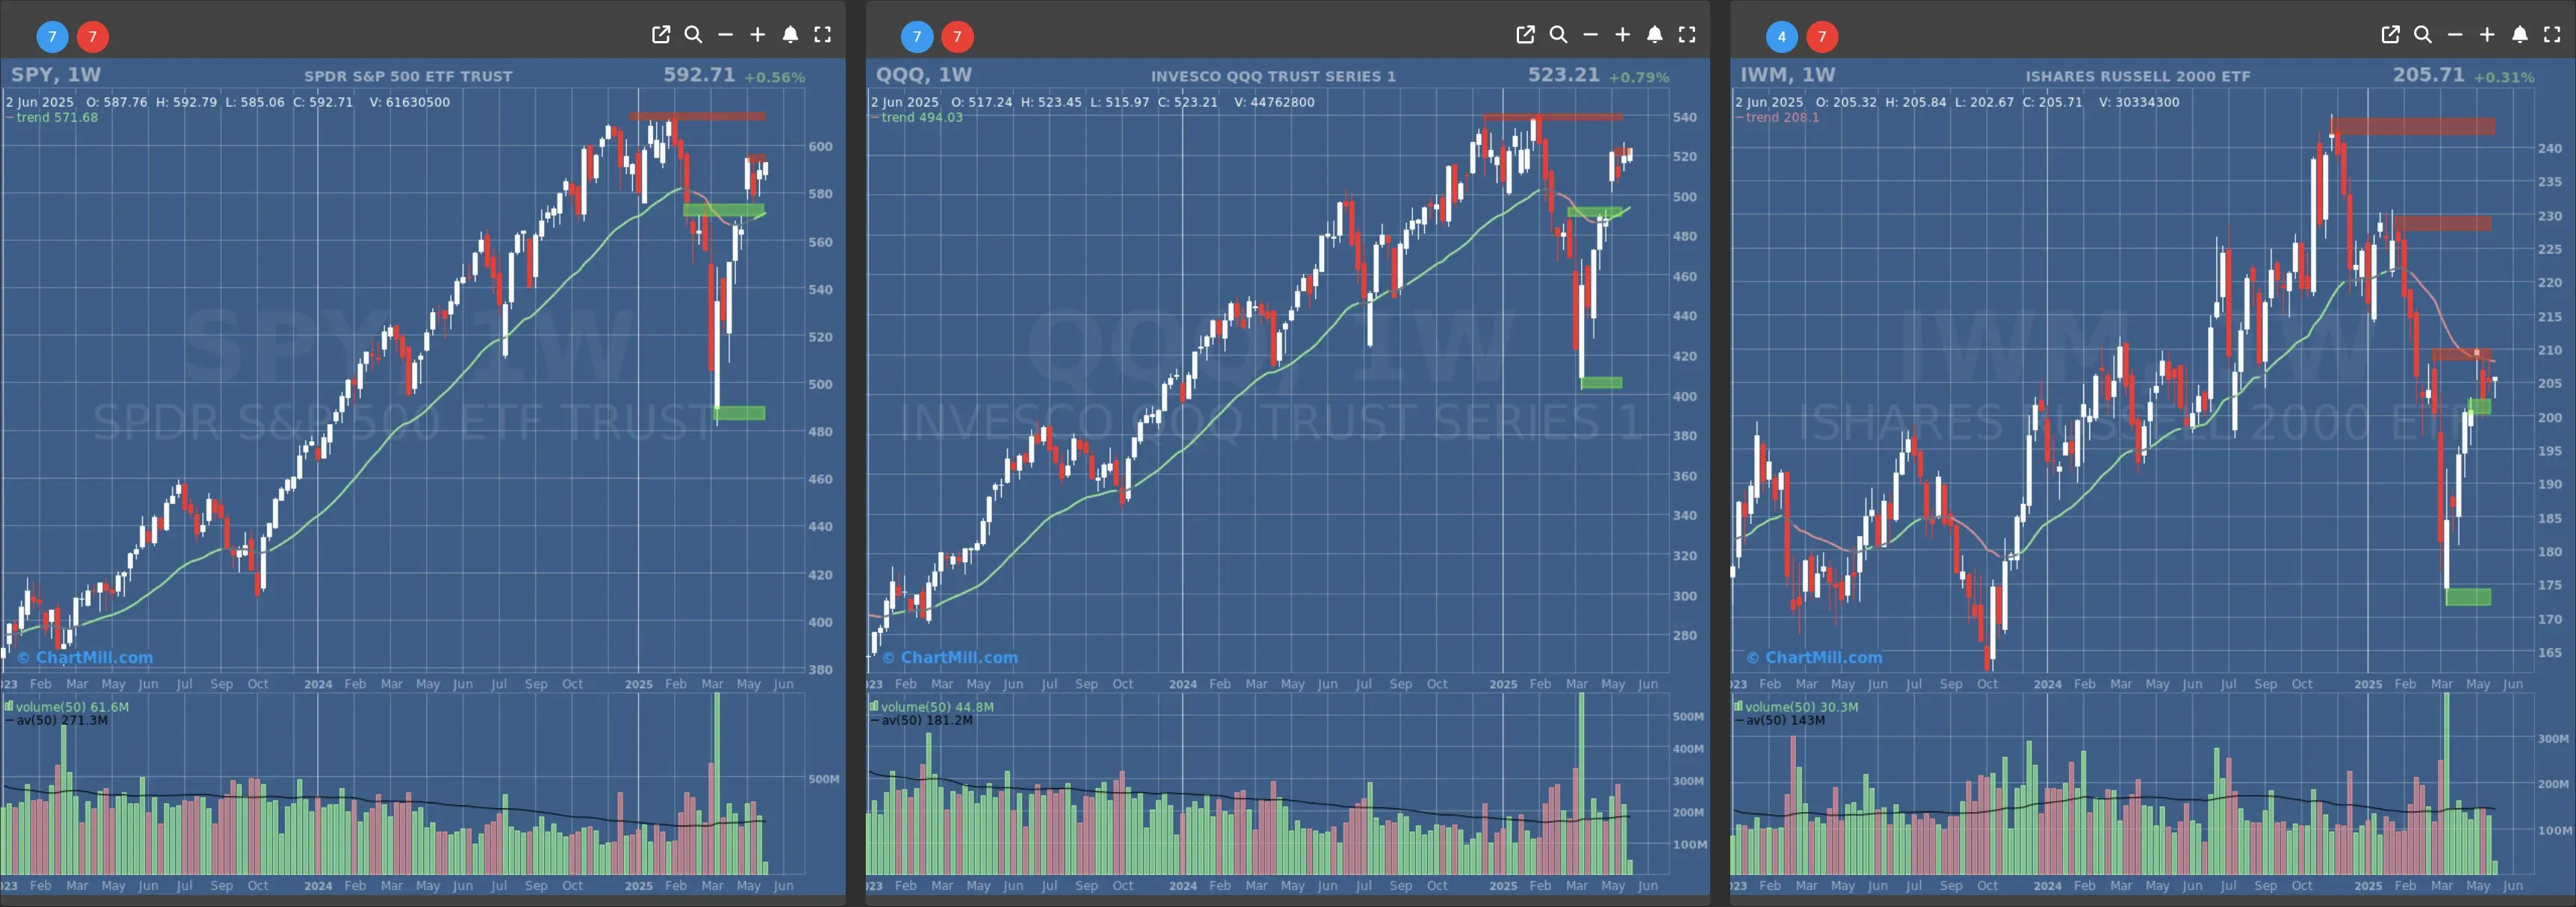
- Long-Term Trend: Positive (no change)
- Long-Term Trend: Positive (no change)
- Long-Term Trend: Neutral (no change)
Daily Market Breadth Analysis – June 02, 2025 (After Market Close)

The most recent market breadth data suggests a mixed but cautiously optimistic tone in the broader stock market, with moderate gains in advancing stocks, strength above key moving averages, and improvements in monthly participation metrics.
Short-Term Participation: Advancers vs. Decliners
On June 2, 2025, 51.4% of stocks advanced, while 46.2% declined, signaling a modestly positive session. This marked a recovery from May 30, when only 41.9% of stocks advanced.
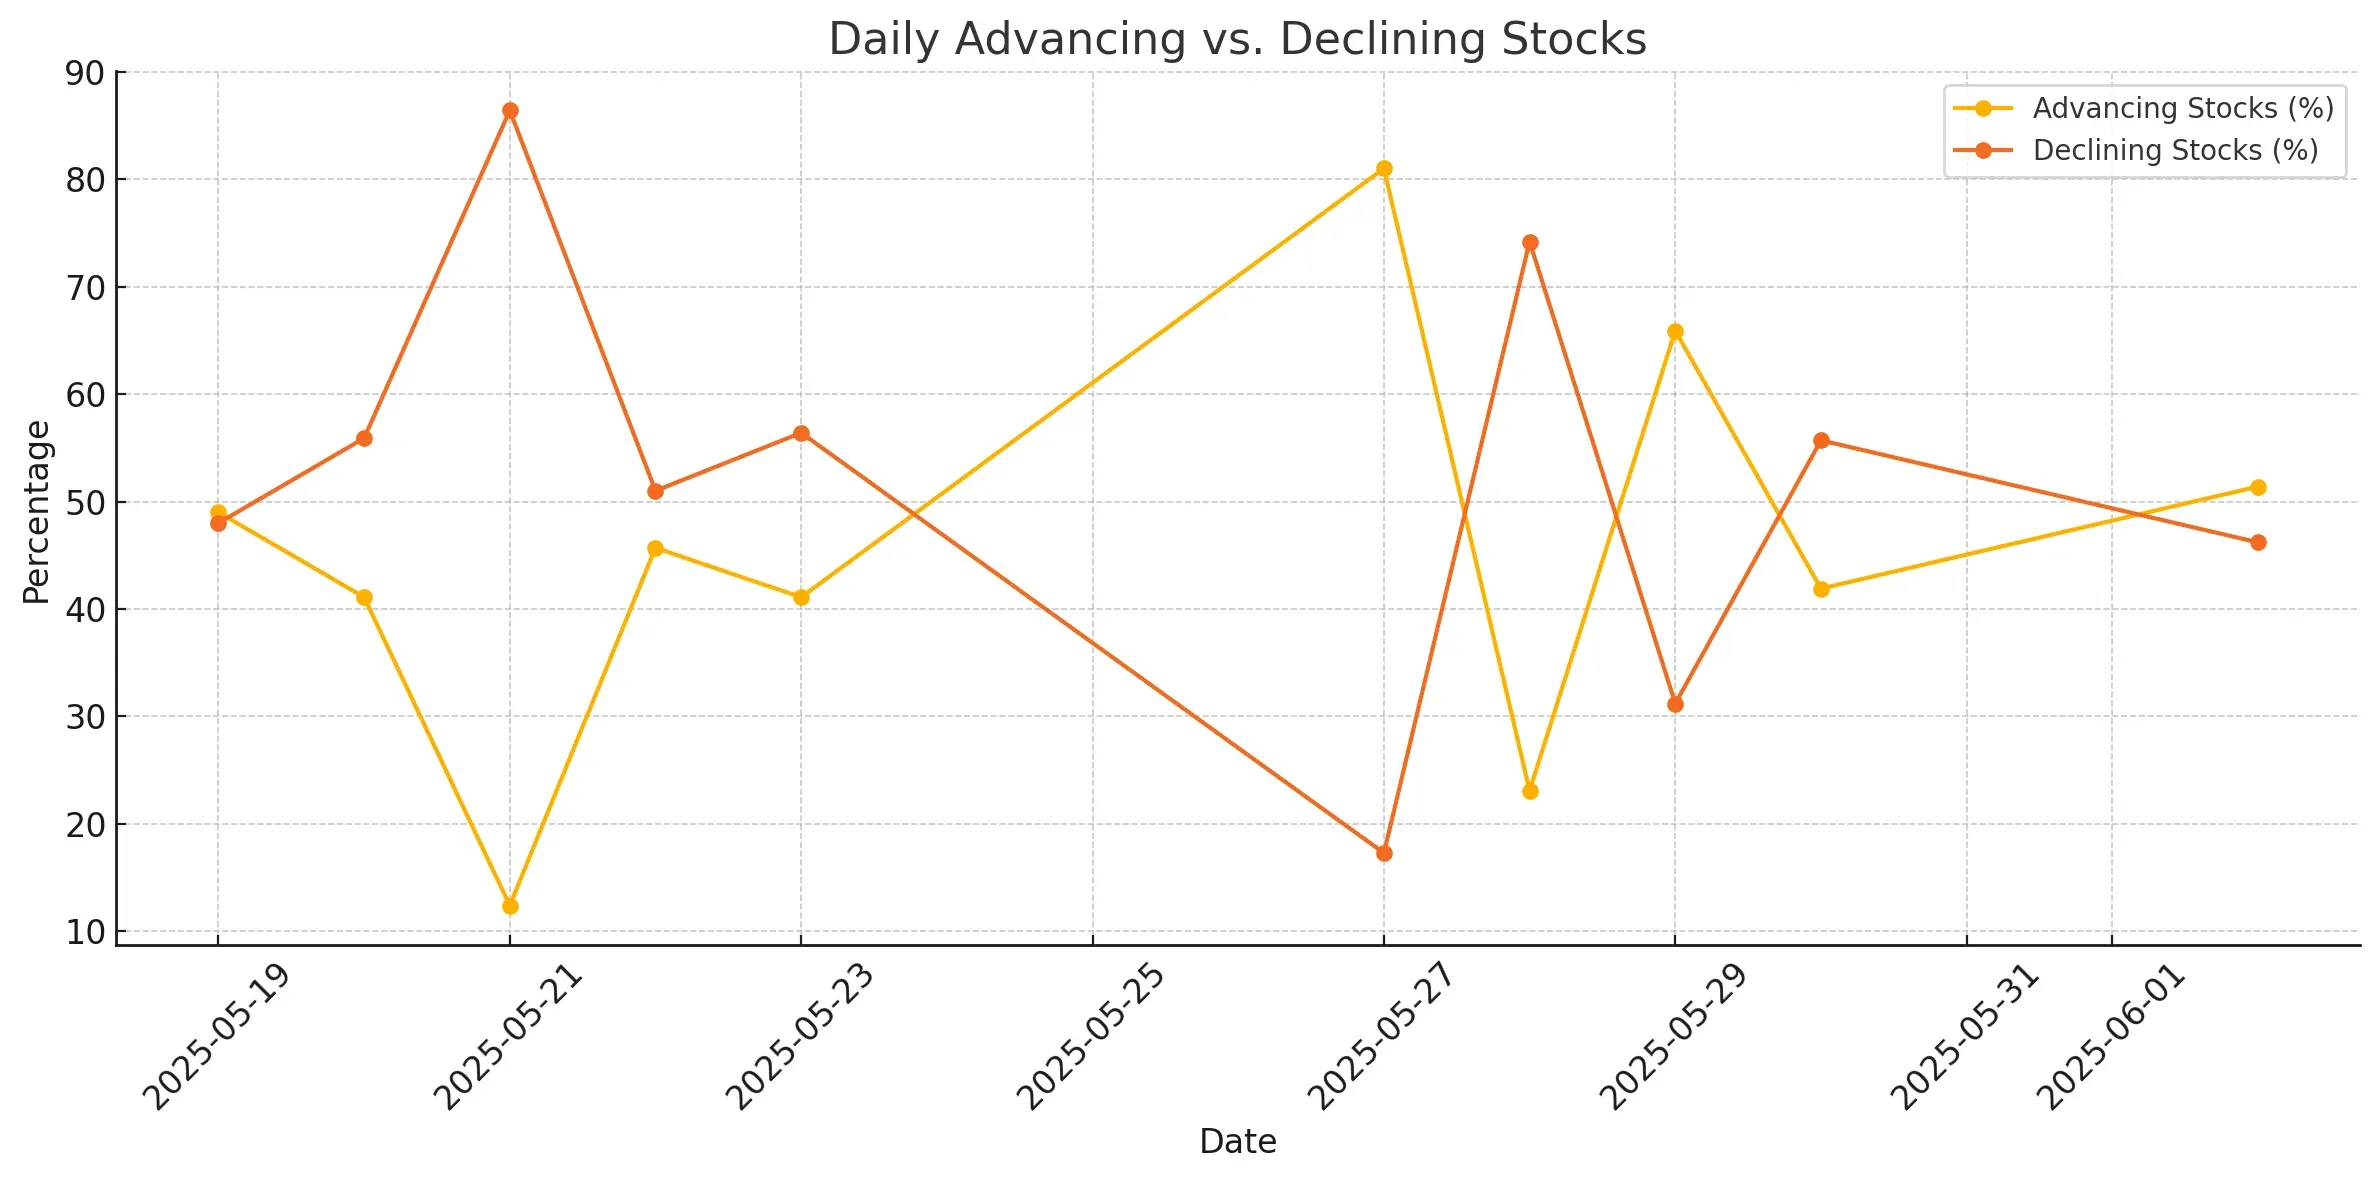
The visualized trend over the past two weeks shows high volatility in breadth, with notable extremes:
-
May 27: 81% advancers (strong breadth spike)
-
May 21: Only 12.4% of stocks advanced, while a massive 86.4% declined (clear selling pressure)
This tug-of-war between bulls and bears reflects uncertainty in market direction, likely driven by macroeconomic concerns and sector rotations.
Intermediate Trend Health: Stocks Above Key Moving Averages
As of June 2, 67.1% of stocks were trading above their 50-day simple moving average (SMA), and 38.4% remained above their 200-day SMA.
The 50-day SMA percentage remains consistently elevated, suggesting stronger short- to mid-term momentum.
The 200-day SMA percentage has flattened in the high 30s, indicating slower long-term recovery across the board.
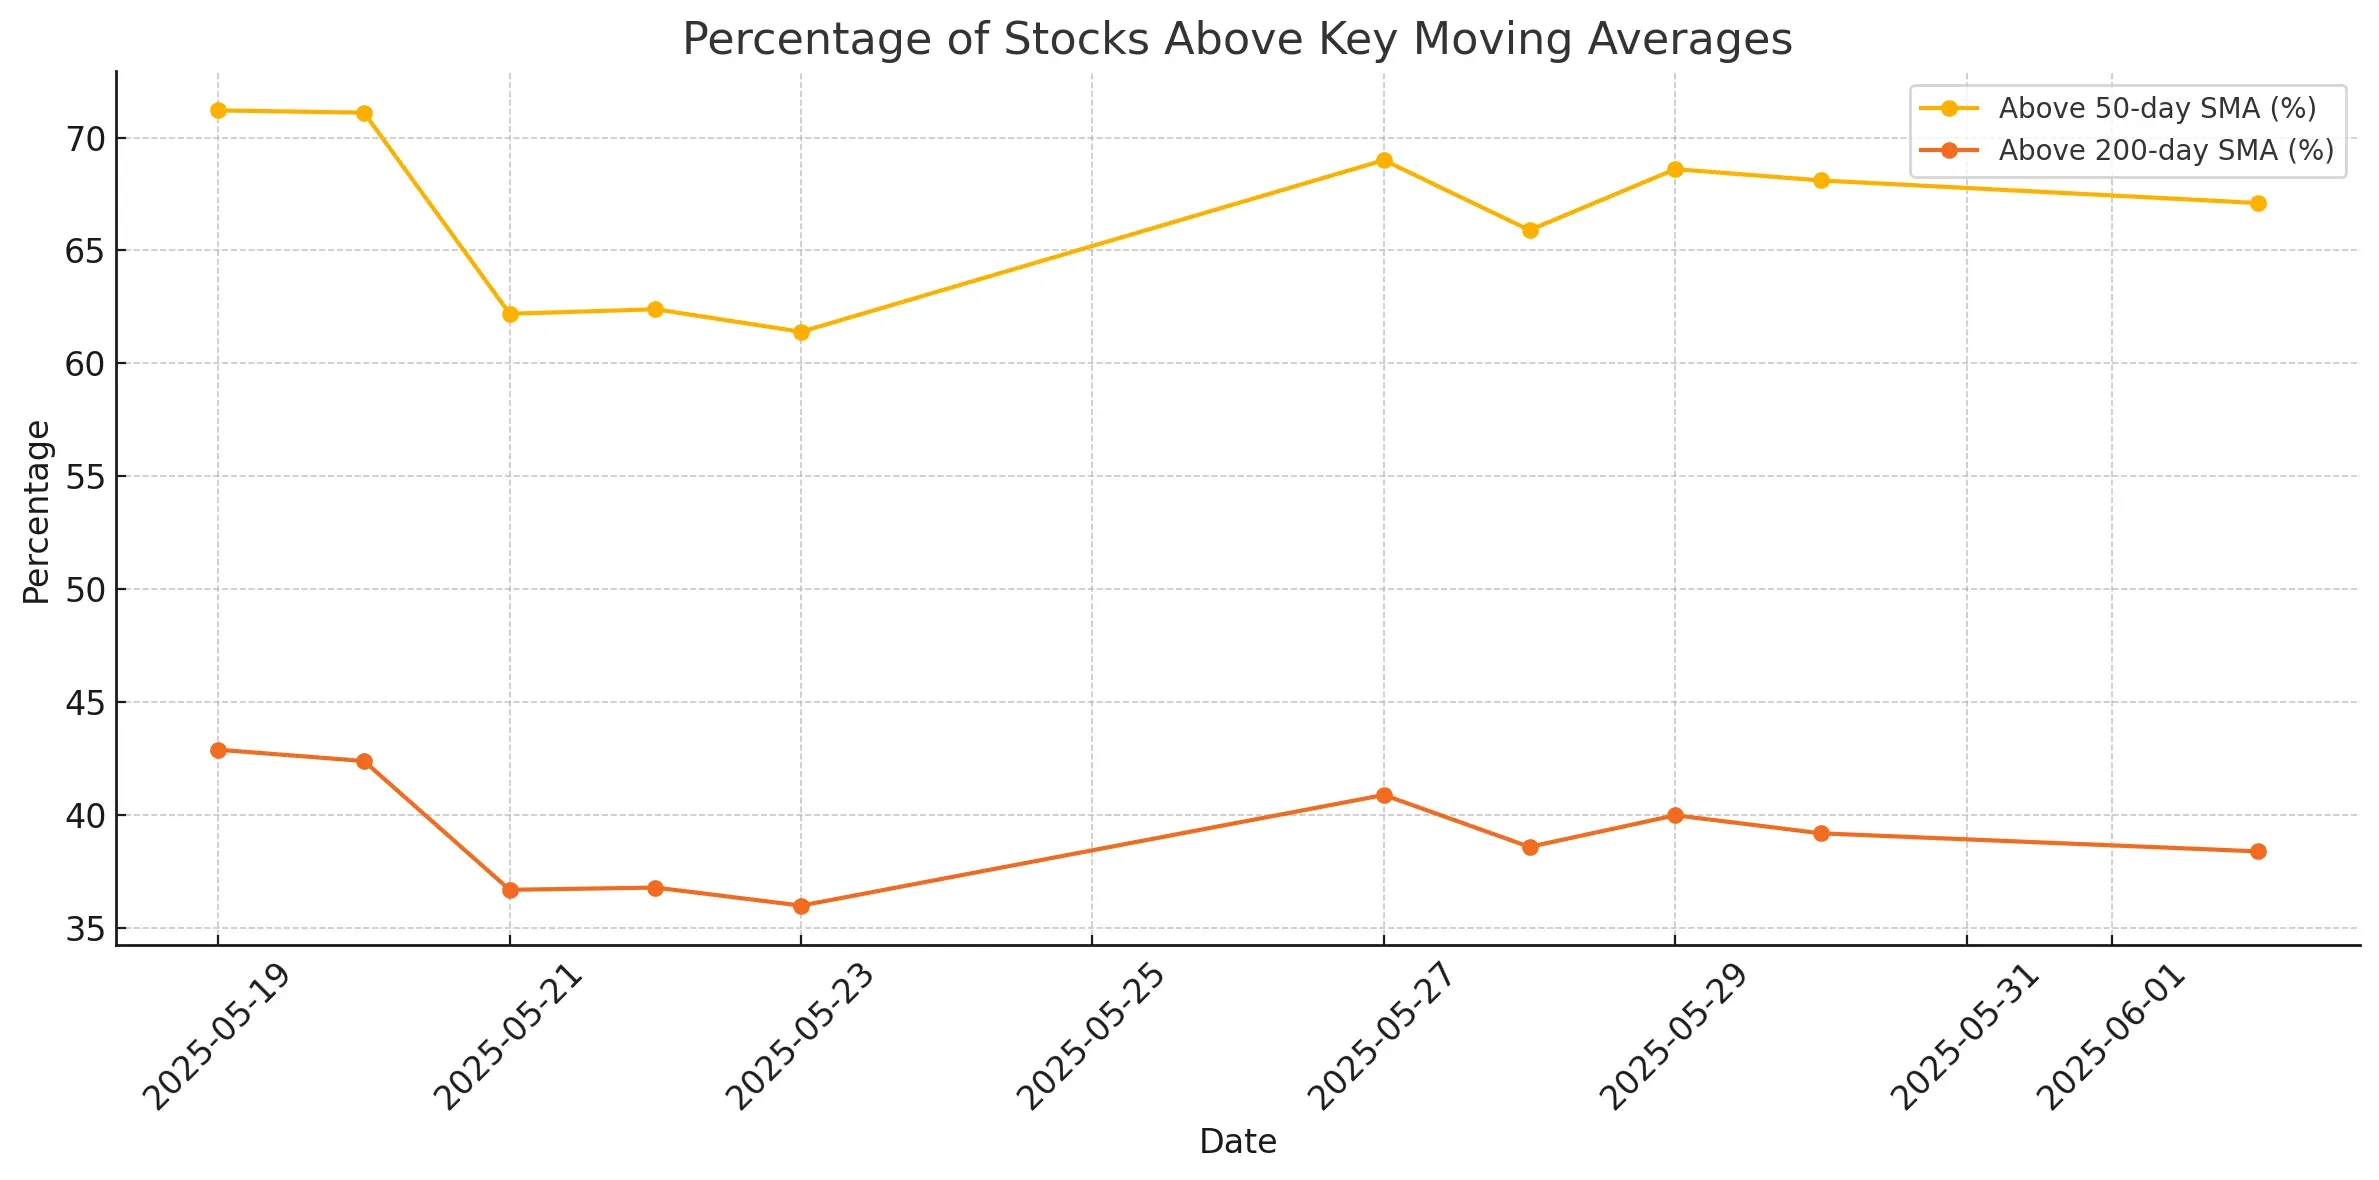
The chart shows that while shorter-term trends are improving, the longer-term uptrend still lacks broad confirmation.
Monthly Breadth Trends
Market internals also suggest improving strength over the past month:
- 63.2% of stocks have advanced over the past month versus 36.3% that declined.
These figures reinforce that bullish momentum has regained footing, especially compared to late May.
However, a closer look at extremes shows that:
-
Only 8.9% of stocks have rallied more than 25% in the past three months.
-
Similarly, 8% of stocks have dropped more than 25% in the same timeframe.
This balance indicates that while participation is improving, explosive upside remains limited, and deep drawdowns are tapering off.
Conclusion
Overall, the market is showing signs of stabilization, with improving short-term breadth and constructive intermediate-term signals.
While longer-term breadth (via 200-day SMA) still lags, recent data supports a cautiously bullish outlook. A sustained shift higher in 200-day SMA participation would strengthen this narrative, especially if supported by macro and earnings developments.
Next to read: Market Monitor News, June 03, 2025