Wednesday’s rebound did not receive any confirmation on Thursday. Market breadth rolled over sharply again, daily participation collapsed, and both SPY and QQQ were pushed back into key support zones, confirming that the market remains in a fragile, distribution-driven environment.
Index Overview (SPY, QQQ, IWM)
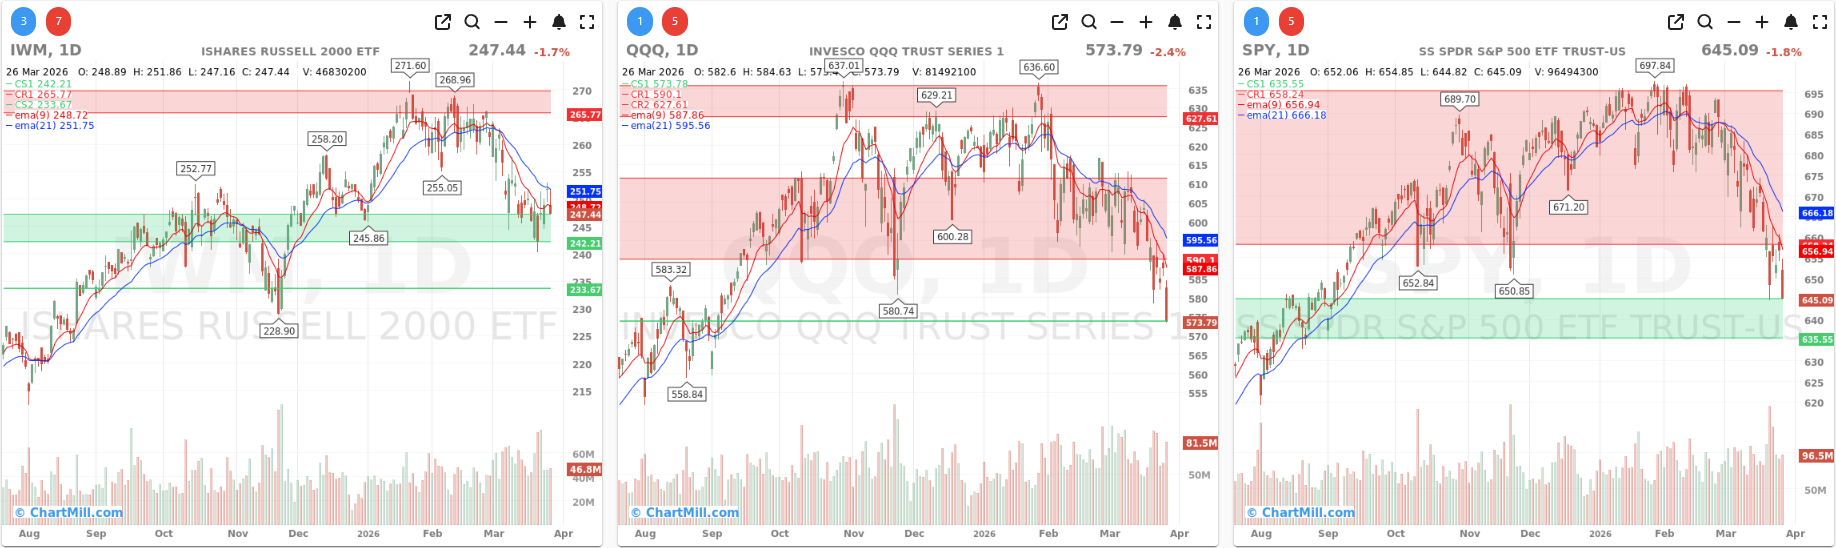
Short Term (Daily)
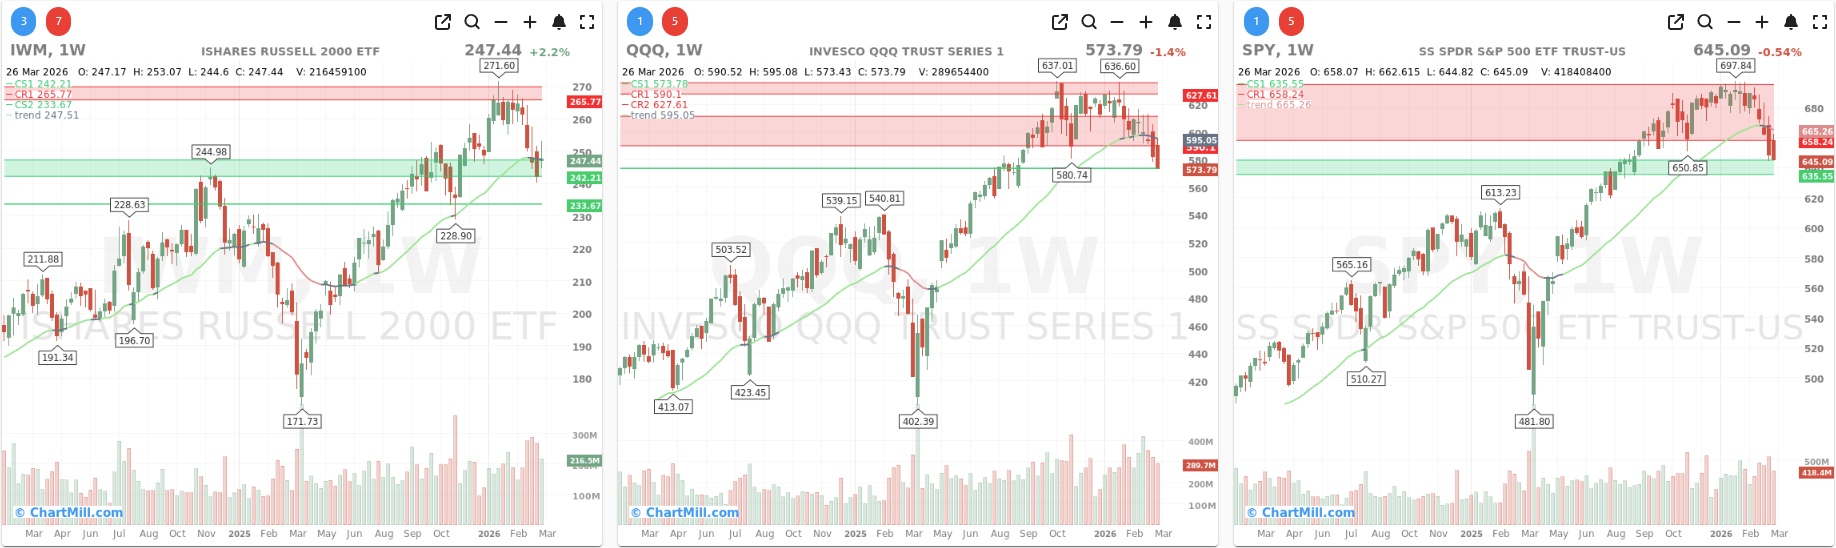
Long Term (Weekly)
SPY lost 1.8% on Thursday and gave back a large part of Wednesday’s rebound immediately. On the daily chart, price closed at $645.09, right back at the upper edge of the green support zone and clearly below both the EMA9 (656.94) and EMA21 (666.18). That is a weak technical position. The short-term bounce attempt has effectively failed unless buyers can reclaim the 656-657 area quickly.
On the weekly chart, SPY remains under pressure as well. The ChartMill Trend Indicator is still red, which is not a new development versus the previous update, but Thursday’s action made that warning more relevant. Price is now sitting between the lower red resistance area and the upper part of longer-term support, meaning the market is no longer merely consolidating near highs. It is now testing whether this pullback is becoming something structurally heavier.
QQQ was the weakest of the three major ETFs again, dropping 2.4%. The daily chart shows a decisive move lower, with price closing at $573.79, below both the EMA9 (587.86) and EMA21 (595.56) and right on top of a critical support area. The rebound seen on Wednesday had no follow-through at all. Instead, it turned into another lower high within a deteriorating short-term structure.
IWM also fell sharply, down 1.7%, but it continues to look slightly different from SPY and QQQ. On the daily chart, it closed at $247.44, below the EMA9 (248.72) and EMA21 (251.75), yet still inside an important support zone. So while the short-term chart has weakened again, small caps have not broken down as decisively as tech.
That relative difference also shows up on the weekly chart. IWM’s long-term trend backdrop is still less damaged than SPY and QQQ. The weekly trend line is essentially being tested around current levels, not clearly lost yet. That does not make IWM bullish, but it does mean small caps are still trying to stabilize while large caps and growth remain under heavier pressure.
Breadth data: Thursday erased Wednesday’s optimism
The clearest message from Thursday’s data is that Wednesday’s rebound was not the start of a sustained recovery. It was a pause inside a weak market.
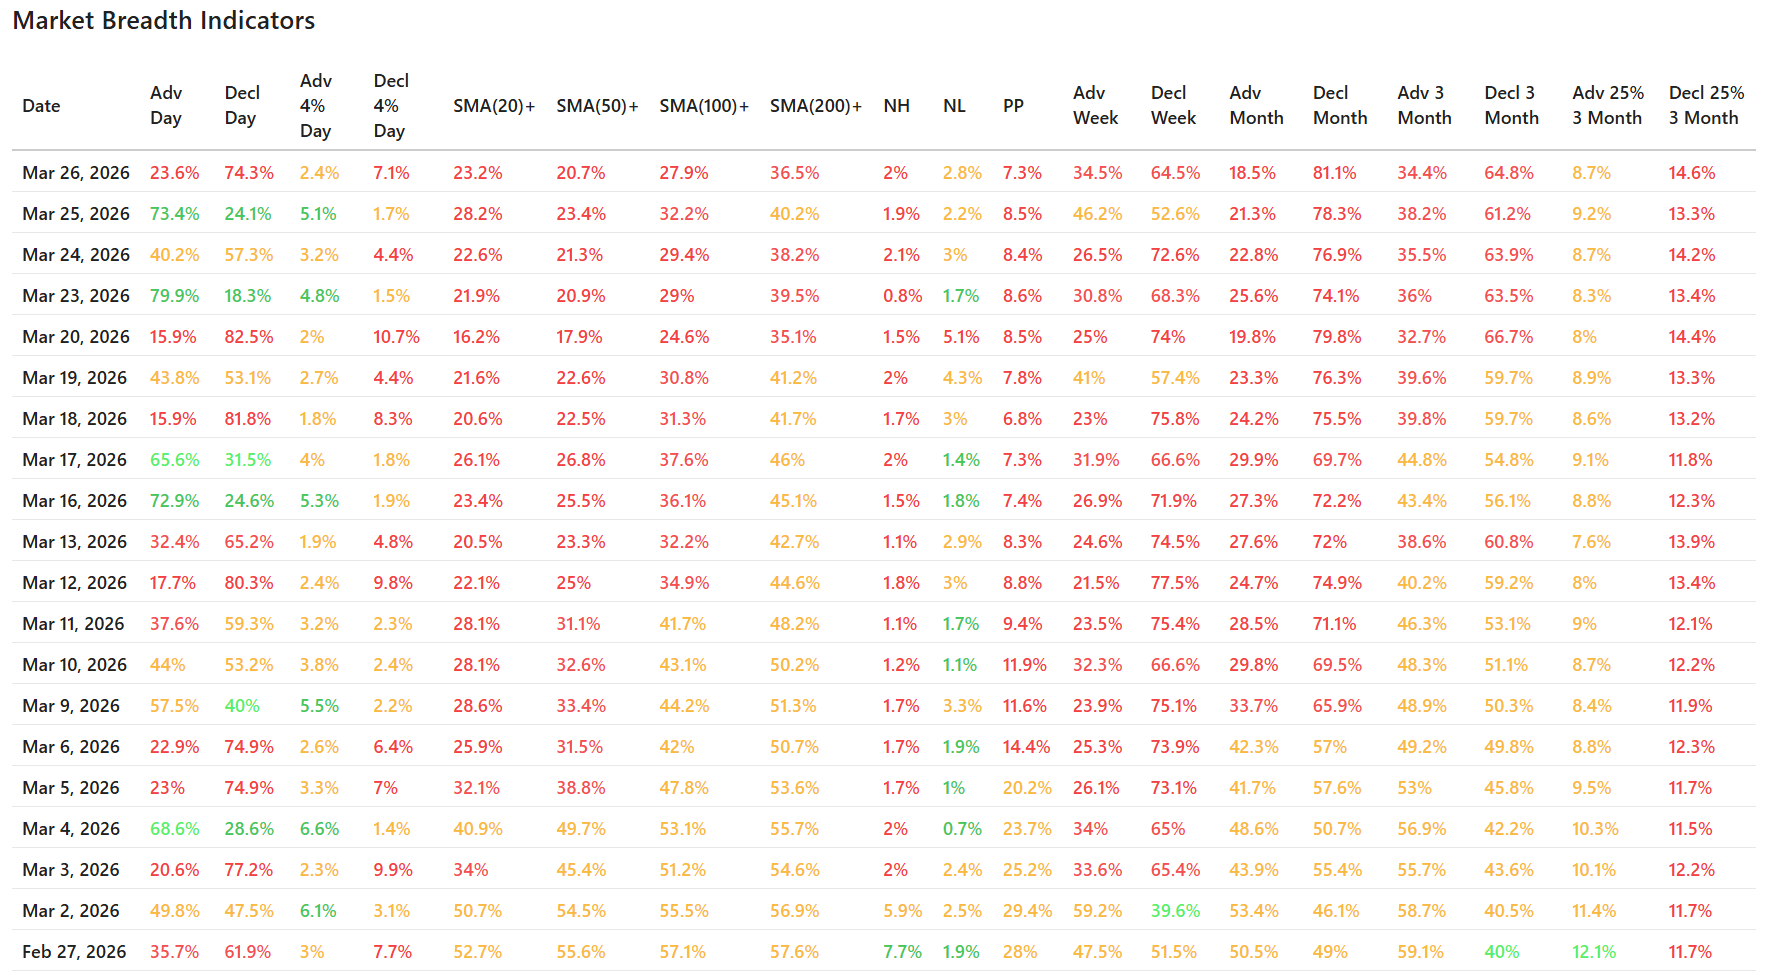
Daily breadth turned sharply lower again:
- Advancing stocks: 23.6%
- Declining stocks: 74.3%
That is a very poor reading and a major reversal from Wednesday’s 73.4% advancers. When a strong up day is followed immediately by such a broad selling wave, it usually means institutions were not accumulating aggressively. Instead, the rebound looks more like short-term relief inside a market that is still dominated by sellers.
The same pattern appears in the more extreme movers:
- Only 2.4% of stocks gained more than 4%
- 7.1% of stocks lost more than 4%
So not only did decliners dominate, but downside velocity also expanded again. This is exactly the kind of behavior you do not want to see after a supposed stabilization day.
Participation remains weak across all key trend measures
Breadth under the moving averages continues to paint a weak intermediate-term picture:
- 23.2% above SMA(20)
- 20.7% above SMA(50)
- 27.9% above SMA(100)
- 36.5% above SMA(200)
These numbers are not washed-out enough to suggest a fully exhausted market, but they are weak enough to confirm a broad loss of participation. The fact that only a little more than one-third of stocks remain above the 200-day average shows that the damage is not limited to a few high-beta names anymore.
Compared with Wednesday, all four participation metrics deteriorated again. So the rebound did not improve underlying structure in any lasting way. It was a one-day interruption in an already weak trend.
New highs remain scarce, and downside pressure still dominates
Thursday’s new highs (2.0%) remained very limited, while new lows (2.8%) stayed elevated. That is not a panic reading, but it is still consistent with a market where leadership is very thin and broad expansion is absent.
Just as important, the broader time-frame breadth readings continue to lean heavily bearish:
- Advancing week: 34.5%
- Advancing month: 18.5%
- Advancing 3 months: 34.4%
Against that:
- Declining week: 64.5%
- Declining month: 81.1%
- Declining 3 months: 64.8%
These are not the readings of a market that is simply digesting gains near highs. These are the readings of a market that has already been undergoing a meaningful internal correction for some time.
The 10-day picture still shows deterioration, not repair
Looking at the last 10 trading days, Thursday fits the same broader pattern we have been discussing in the previous breadth updates: rebounds keep occurring, but they do not stick.
That was also the key takeaway after Wednesday’s session. The market managed a strong one-day recovery, but the deeper metrics had not healed enough to justify confidence. Thursday confirmed that concern. Instead of follow-through buying, sellers came back immediately and pushed the major indexes back toward support.
So the current environment remains one where:
- upside bursts are possible,
- but conviction is low,
- participation is narrow,
- and the trend of the internals is still down.
Context and Interpretation
There does not need to be a single headline explanation to understand Thursday’s message. From a pure data perspective, this was a classic failed follow-through day after a rebound attempt. That typically reflects continued caution, weak conviction, and a market that is still quick to sell strength.
The most important point is that the weakness is not isolated. It shows up in:
- the index charts,
- the daily advance-decline data,
- the percentage of stocks above key moving averages,
- and the multi-week and multi-month breadth readings.
That alignment matters. When price and breadth tell the same story, the signal becomes stronger.
Conclusion
Thursday’s market breadth data clearly favor the bears again. Wednesday’s rebound looked constructive on the surface, but it lacked the internal repair needed to shift the bigger picture. Thursday exposed that weakness quickly.
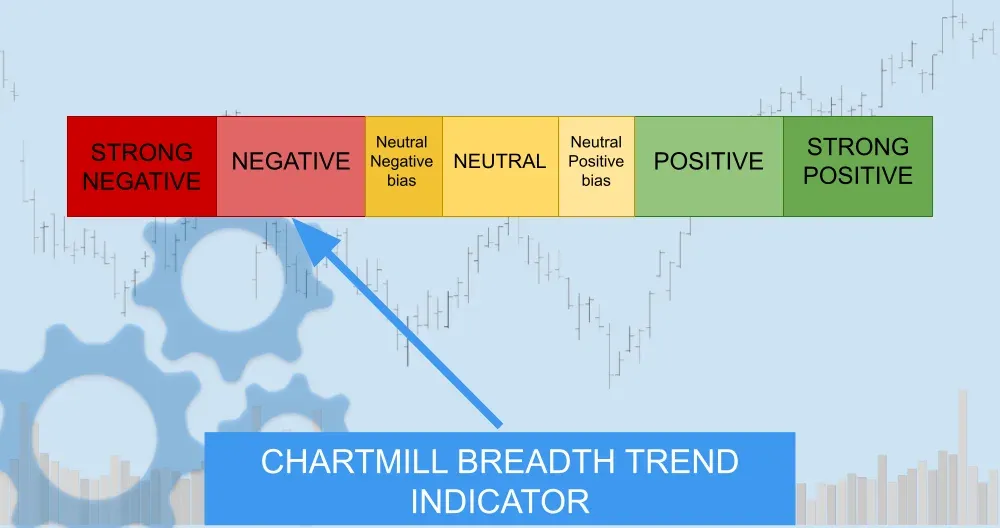
Breadth Trend Rating: 2/7 – Negative
SPY and QQQ remain the most vulnerable. IWM is holding up somewhat better structurally, but it also weakened again and is not yet offering a true leadership signal.
As long as breadth remains this poor, any short-term bounce should still be treated cautiously. The market can certainly rally from oversold conditions, but at this stage the data still describe a fragile environment with negative momentum and limited participation.
ChartMill Market Desk
This daily Market Breadth Report is prepared by ChartMill for informational purposes only and does not constitute investment advice. Always do your own due diligence before making investment decisions.
Next to read: Chips Crack as Iran Fears Grip Wall Street