A strong upside breadth day gave the market a needed reset after Friday’s heavy damage. Still, the broader participation data remains weak enough that this looks more like a relief rebound inside a fragile market than a fully restored bullish environment.
Index Overview (SPY, QQQ, IWM)
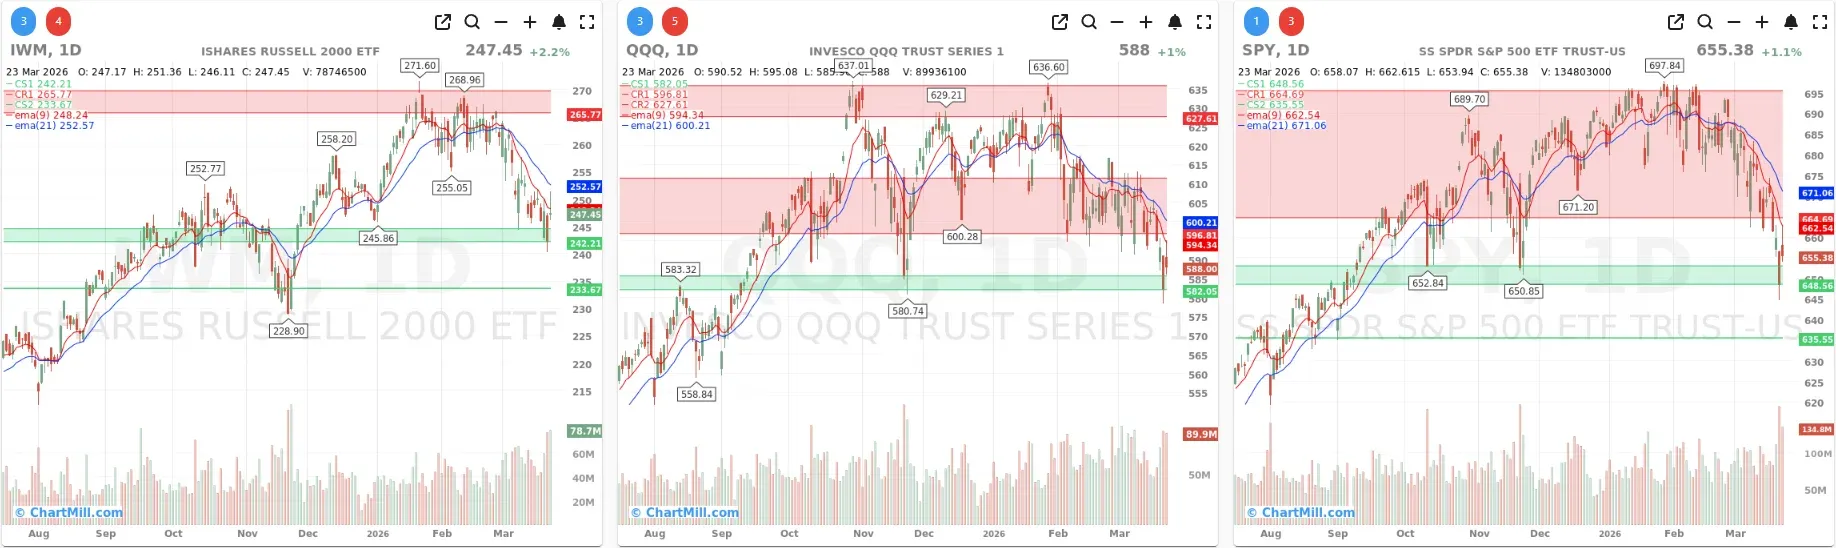
Monday’s session brought a meaningful bounce across the major index ETFs, but the charts still show markets trying to recover from technical damage rather than resuming clean uptrends.
Short Term (Daily)
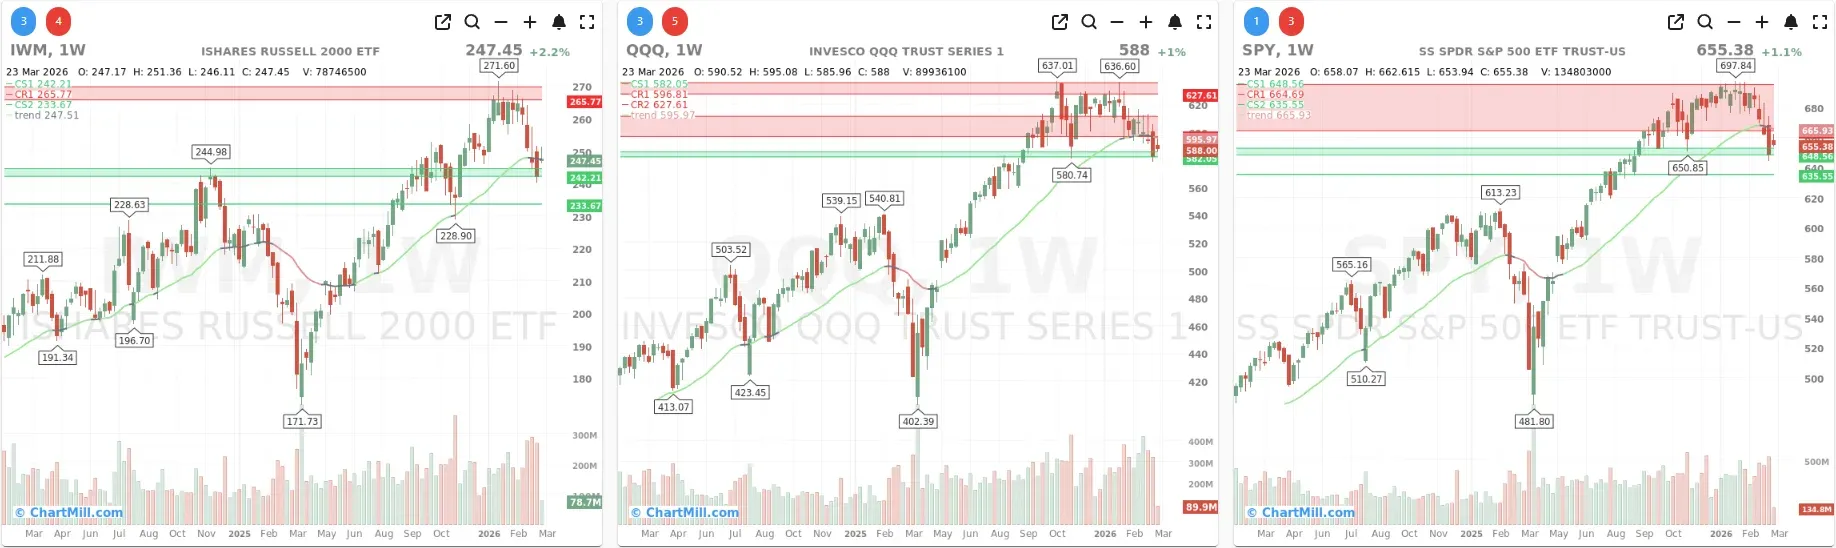
Long Term (Weekly)
SPY closed at $655.38, up 1.1%, after probing below its lower support zone and then reversing higher into the close.
That rebound from the 648.6 area is constructive in the short term, especially after Friday’s heavy selling pressure. Still, SPY remains below both the 9-day EMA (662.5) and the 21-day EMA (671.1), so the short-term trend has not yet been repaired.
The weekly chart adds an important note of caution.
SPY is trading below the ChartMill Trend Indicator near 665.9, and that indicator has now turned red intraWEEK. Since the weekly close is only confirmed on Friday, this is not yet an official confirmed long-term downtrend signal. But it is absolutely worth monitoring.
If SPY remains in this area through week’s end, the longer-term technical picture would deteriorate further. So while Monday’s bounce improved the daily tone, the higher-timeframe message remains fragile.
QQQ closed at $588, up 1.0%, also after successfully bouncing from key lower support near 582.5.
As with SPY, the response from that support zone is constructive, but the ETF still closed below both the 9-day EMA (594.3) and 21-day EMA (600.2). That keeps the Nasdaq 100 in a short-term corrective phase despite Monday’s rebound.
The weekly chart tells a similar story.
QQQ is now trading below the ChartMill Trend Indicator near 595.97, and that indicator too has turned red intraWEEK. Just like with SPY, that signal is not yet confirmed until Friday’s close, but it is a meaningful warning sign.
The rebound in Monday’s session helped stabilize conditions, but unless that strength continues, the weekly trend structure risks weakening further.
IWM was the strongest of the three, closing at $247.45, up 2.2%.
Small caps bounced sharply from support near 242.2 and reclaimed that level decisively by the close. That gives IWM a somewhat better short-term tone than the large-cap ETFs on a one-day basis.
Even so, IWM still finished just below the 9-day EMA (248.2) and remains clearly below the 21-day EMA (252.6), so it too is still in recovery mode rather than in a renewed uptrend.
On the weekly chart, IWM is sitting almost exactly on its ChartMill Trend Indicator near 247.5. Unlike SPY and QQQ, the trend line has not yet turned red, but small caps are clearly testing an important threshold.
That makes this an important area to watch over the rest of the week.
A powerful daily breadth rebound
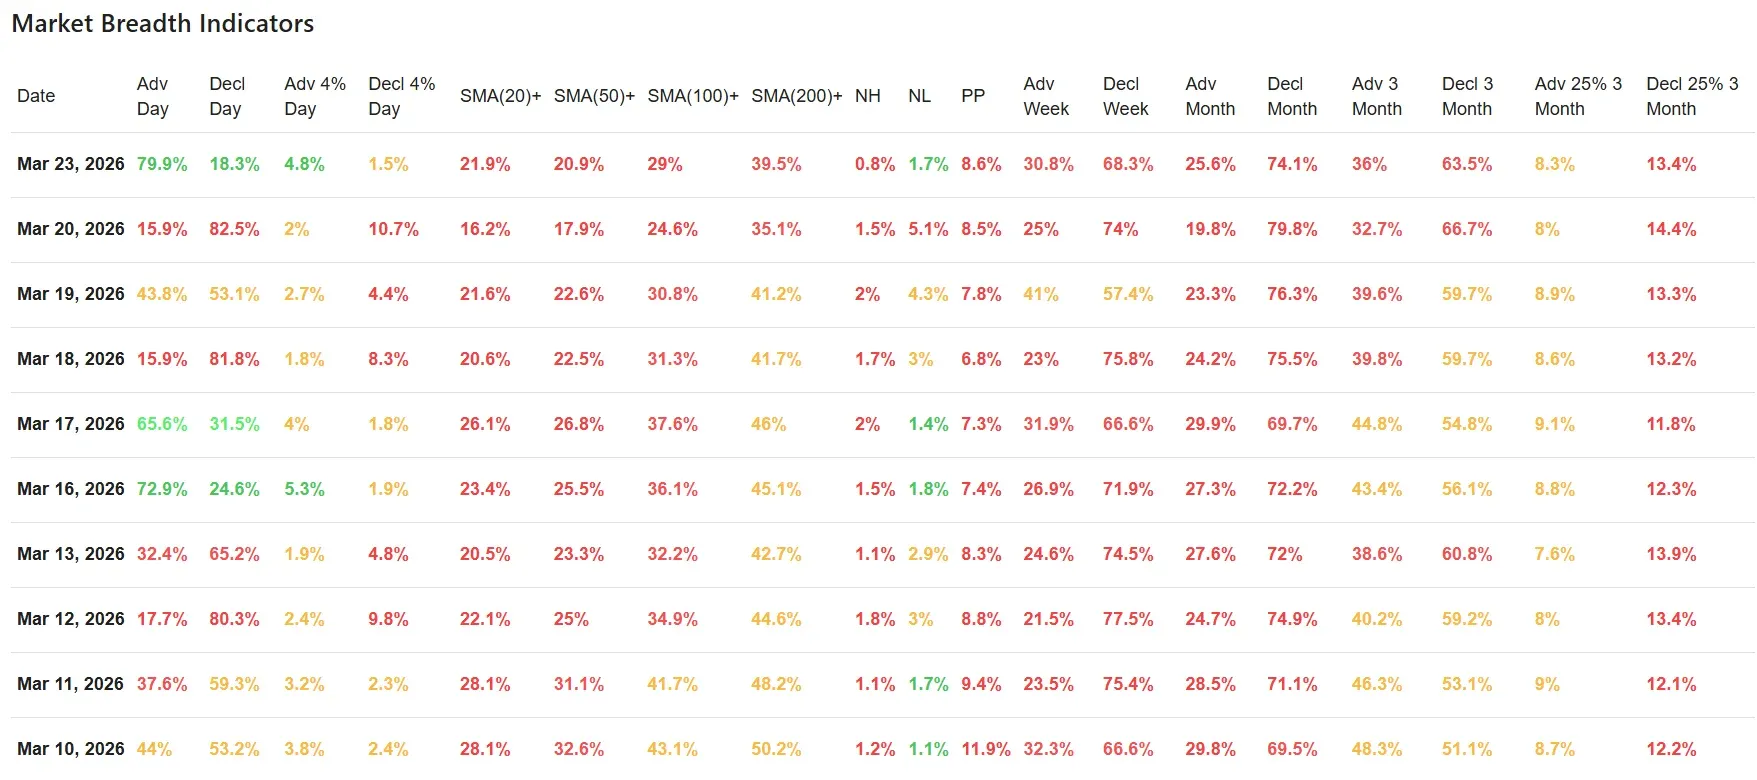
The breadth table shows that Monday was, first and foremost, a strong upside participation day.
After Friday’s deeply negative 15.9% advancers versus 82.5% decliners, Monday reversed sharply to 79.9% advancers and just 18.3% decliners. That is a significant improvement and confirms that the rebound was not limited to a narrow group of heavyweight stocks. Participation broadened meaningfully.
The more aggressive short-term momentum data also improved:
- Adv 4% Day: rose to 4.8% from 2.0%
- Decl 4% Day: fell to 1.5% from 10.7%
Friday had shown clear downside urgency, while Monday showed the opposite: buyers came in broadly and downside pressure cooled substantially.
This fits well with the price action in SPY, QQQ, and IWM. All three indices bounced from support, and the breadth data confirms that this was a real participation rebound rather than a hollow index move.
Better than Friday, but still weak under the surface
That said, the broader participation data still paints a weak picture overall.
Only:
- 21.9% of stocks are above their 20-day SMA
- 20.9% are above their 50-day SMA
- 29.0% are above their 100-day SMA
- 39.5% are above their 200-day SMA
Those readings did improve from Friday’s 16.2% / 17.9% / 24.6% / 35.1%, but they remain low in absolute terms. In a healthier market environment, you would expect a much larger share of stocks to be trading above at least their 20-day and 50-day moving averages.
So Monday clearly helped. But the key point is that it helped from a depressed starting point. This was a rebound inside a damaged market, not yet evidence of a fully repaired market structure.
New highs remain limited
The leadership side of the breadth table remains underwhelming.
- New Highs: 0.8%
- New Lows: 1.7%
- Pocket Pivots: 8.6%
These are slightly better than some of the weaker recent readings, but they still do not point to strong leadership expansion. In a robust rally environment, new highs should begin to expand more convincingly. That is not happening yet.
This is another reason Monday’s strong daily breadth should be treated as constructive, but not over-interpreted. The market got a needed bounce, but there is still little evidence that strong leadership is re-emerging in a durable way.
Weekly and monthly breadth still point to internal weakness
The bigger caution remains in the broader time-frame metrics.
Even after Monday’s rebound:
-
Adv Week: 30.8%
-
Decl Week: 68.3%
-
Adv Month: 25.6%
-
Decl Month: 74.1%
-
Adv 3 Month: 36.0%
-
Decl 3 Month: 63.5%
These are still clearly weak numbers. They show that while the market managed a strong one-day reversal, the medium-term internal trend remains under pressure.
This is also where Monday’s article should be linked back to Friday’s analysis. Friday’s breadth collapse warned that the market’s internals were still vulnerable despite prior signs of stabilization.
Monday did deliver the kind of rebound breadth bulls needed to see, but it did not yet undo the broader deterioration. In fact, the weekly ChartMill Trend Indicator on both SPY and QQQ turning red intraweek reinforces the idea that the market’s higher-timeframe structure is still being tested, not restored.
Human context
This kind of market behavior is typical of a fragile tape: after an intense downside session, the market becomes short-term stretched, buyers step in near support, and breadth snaps back sharply for a day. That often creates the impression of immediate repair, but in reality the next few sessions matter more than the initial bounce itself.
That is especially true now because the daily rebound is happening at the same time that the weekly trend model for SPY and QQQ is flashing a provisional warning. In practical terms, the market is showing better short-term participation, but worse higher-timeframe pressure. That tension is the real story of Monday’s session.
Final assessment
Monday was a constructive day. The rebound in SPY, QQQ, and IWM was real, the breadth participation was broad, and downside momentum cooled sharply from Friday’s extreme readings.
But the broader picture remains cautious. Participation above key moving averages is still weak, new highs remain limited, weekly and monthly breadth continue to lean bearish, and the ChartMill Trend Indicator has now turned red intraweek for both SPY and QQQ. While that weekly signal is not yet confirmed until Friday’s close, it is an important deterioration in the background trend structure.
So the market did improve on Monday, but it did not fully heal.
Breadth trend rating: 3/7 — neutral with a negative bias
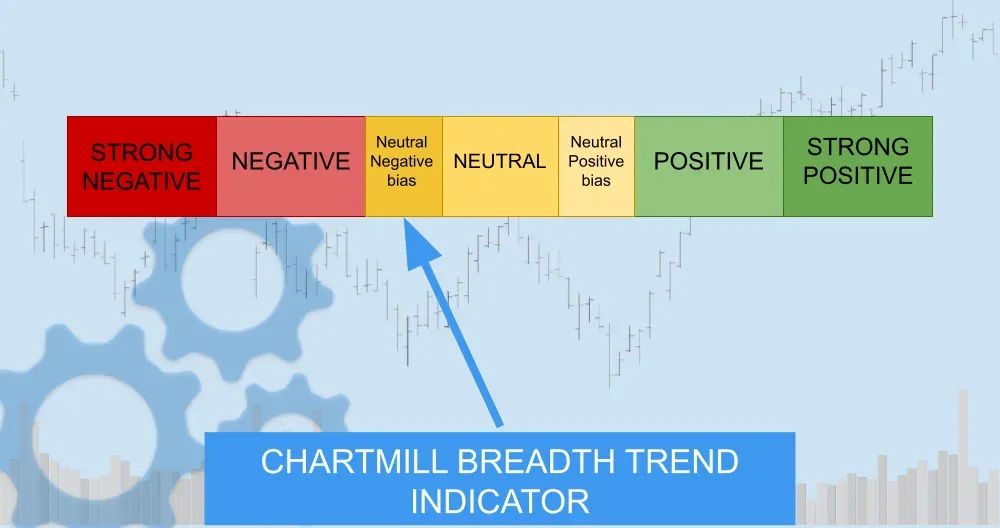
That rating reflects the same core conclusion as before, but with an even clearer warning from the weekly charts. The rebound was real and important, yet the market still needs meaningful follow-through before the broader technical picture can be considered stable again.
ChartMill Market Desk
This daily update is prepared by ChartMill for informational purposes only and does not constitute investment advice. Always do your own due diligence before making investment decisions.
Next to read: Trump Blinks on Iran And Wall Street Thanks Him for It