Index Overview (SPY, QQQ, IWM)
Monday’s session brought a meaningful bounce across the major index ETFs, but the charts still show markets trying to recover from technical damage rather than resuming clean uptrends.
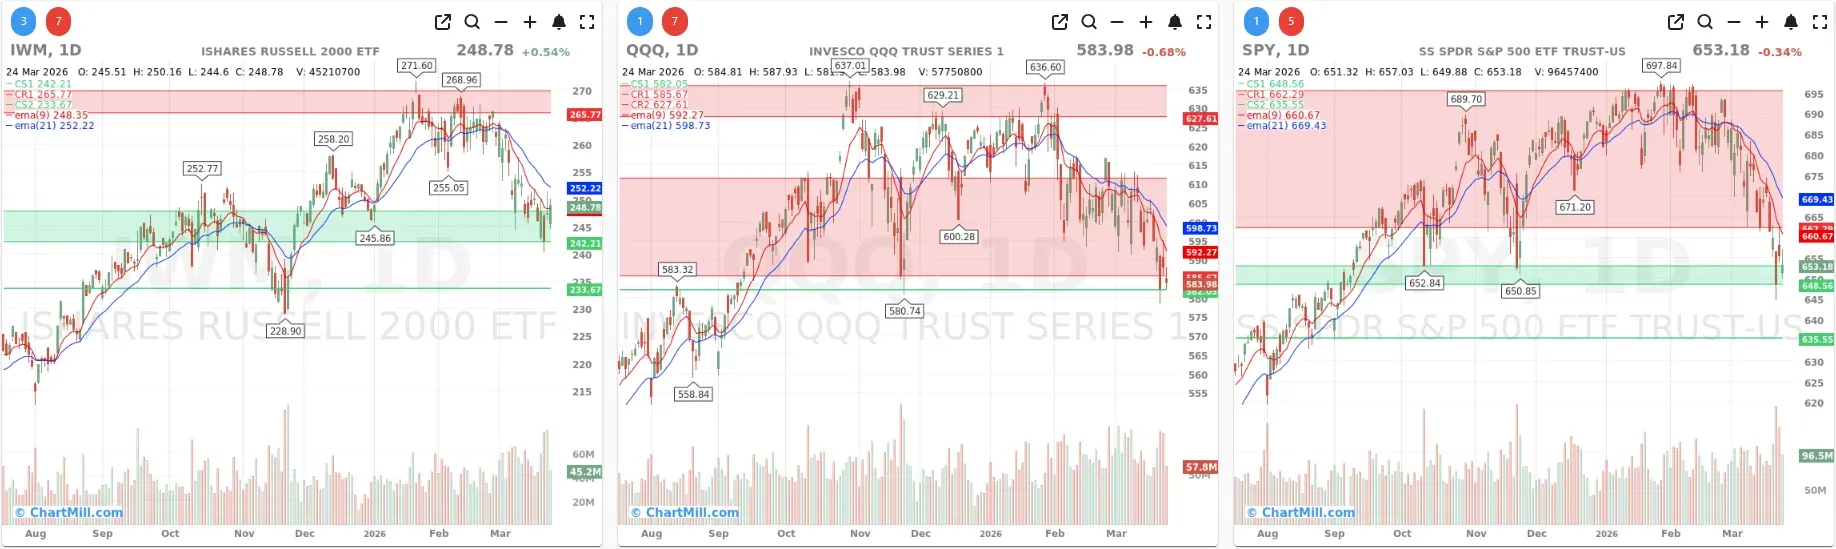
Short Term (Daily)
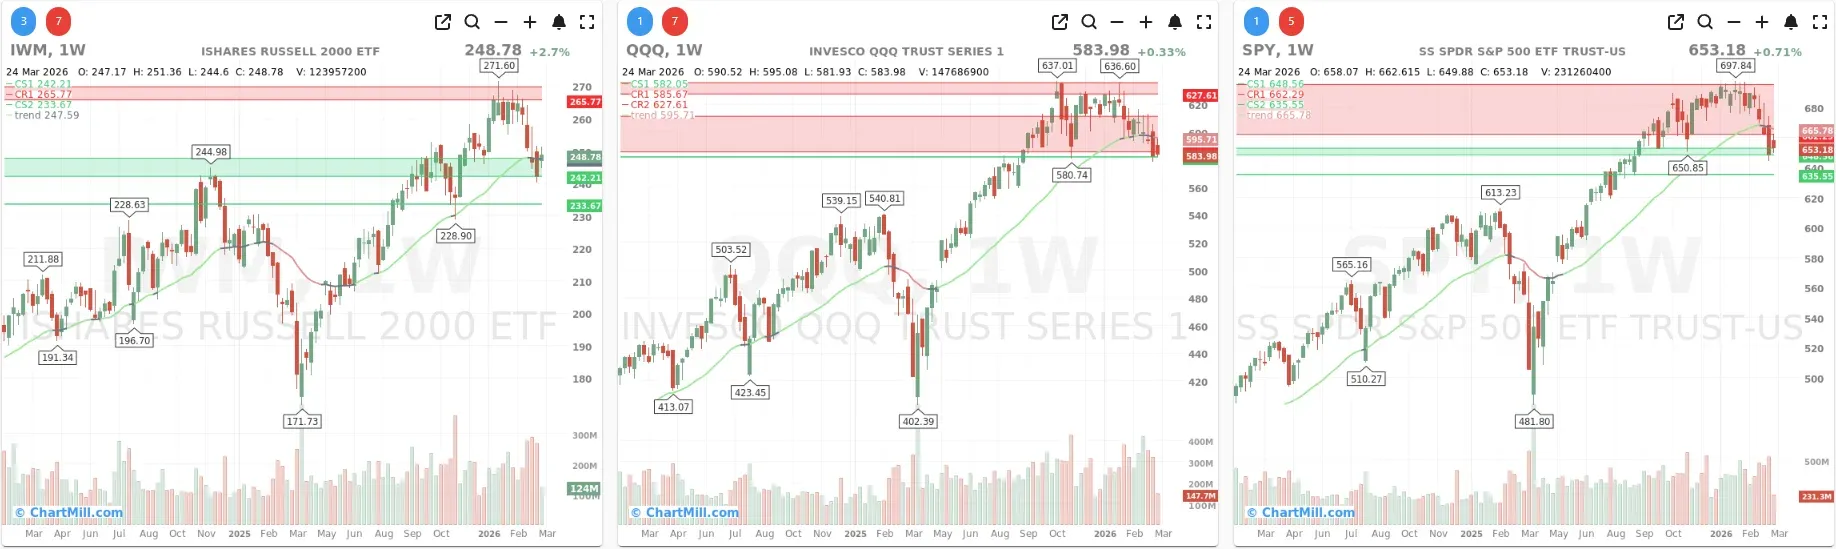
Long Term (Weekly)
SPY closed at $653.18, down 0.34%, but the daily chart tells a more nuanced story than the final percentage suggests. Price dipped into the nearby green support zone and managed to recover off the lows into the close. Even so, SPY remains below both the EMA9 (660.67) and EMA21 (669.43), which confirms that the short-term trend is still under pressure.
From a price-structure point of view, the market is now trying to stabilize around an area that previously acted as support. That is constructive on a very short-term basis, but the index has not yet done enough to suggest that momentum has meaningfully improved. The burden of proof remains on the bulls.
On the weekly chart, the ChartMill Trend Indicator remains red for SPY, exactly as already noted in Monday’s update. So this is not a new development, but rather an ongoing sign that long-term trend conditions have weakened. As noted yesterday, the weekly candle is only fully confirmed at Friday’s close, but the fact that the signal remained red on Tuesday keeps that longer-term warning firmly in place.
QQQ was the weakest of the three major ETFs again, closing at $583.98, down 0.68%. Price undercut the lower support region intraday and then bounced somewhat, but the index still finished weak and remains decisively below both its EMA9 (592.27) and EMA21 (598.73).
That continues the pattern already visible yesterday: even when the market tries to rebound, tech leadership is not convincingly returning. QQQ remains the most vulnerable of the large-cap benchmarks, and until it can reclaim the short-term moving averages, rallies in the broader market will remain suspect.
On the weekly chart, QQQ also remains on a red ChartMill Trend Indicator, which was already highlighted in Monday’s breadth update. So again, this is not a new signal on Tuesday, but a continuation of the same longer-term deterioration already in progress. Tuesday’s action simply did nothing to invalidate that warning.
IWM was relatively stronger, finishing at $248.78, up 0.54%. Small caps held their nearby support area and managed to close positive, which stands out favorably compared with the weakness in SPY and QQQ.
That said, the daily chart is still mixed rather than clearly bullish. IWM closed near its EMA9 (248.35) but remains below its EMA21 (252.22). So while small caps are showing somewhat better resilience near support, the short-term structure is still not fully repaired. This looks more like stabilization than fresh leadership.
On the weekly chart, IWM is holding up better than QQQ from a trend perspective, but it is also sitting at an important inflection point. The index is not breaking down aggressively, but neither is it showing broad risk-on conviction.
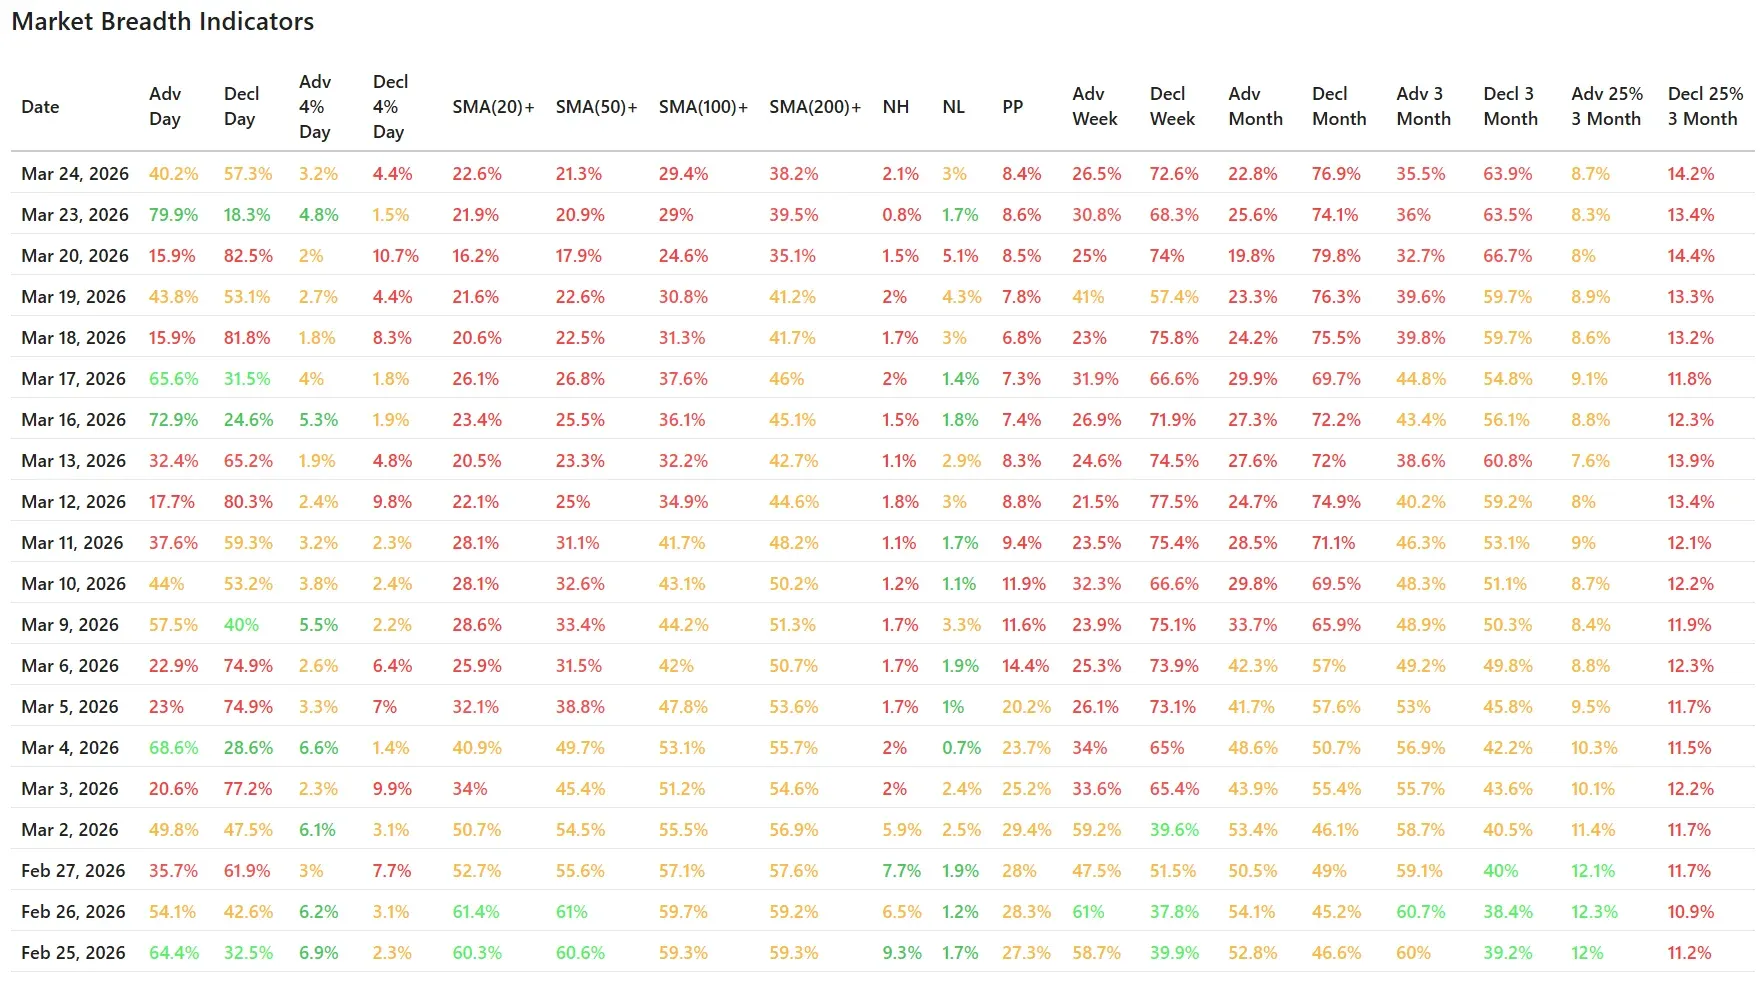
Breadth Indicators: Monday’s Rebound Did Not Hold
The clearest message from Tuesday’s breadth table is that Monday’s rebound failed to generate meaningful follow-through.
After Monday’s very strong 79.9% advancers, Tuesday fell back to just 40.2% advancers, while 57.3% of stocks declined. That is a sharp reversal in internal tone and a reminder that the prior session’s strength did not reflect a durable shift in participation.
This fits the broader pattern we have been tracking in recent updates: the market is still capable of producing sharp rebound days, but those rebounds are not yet translating into sustained internal improvement. Tuesday’s data strongly supports that interpretation.
The same message appears in the strong-move data. Only 3.2% of stocks advanced more than 4%, while 4.4% fell more than 4%. So downside expansion once again exceeded upside expansion. That is not what a healthy market rebound looks like beneath the surface.
Participation remains weak across trend measures
The moving-average participation figures continue to show just how damaged the average stock still is.
- 22.6% of stocks are above the 20-day SMA
- 21.3% are above the 50-day SMA
- 29.4% are above the 100-day SMA
- 38.2% are above the 200-day SMA
These numbers remain weak across all timeframes, especially on the short end. When only about one in five stocks is above the 20-day and 50-day averages, it tells you that the market’s rebound attempts are still narrow and fragile.
Compared with Monday, there was no meaningful improvement here. In fact, the overall message remains the same as in recent sessions: the indexes may be trying to defend support, but the average stock is still not participating in a way that suggests a healthier underlying trend.
That distinction remains crucial. Price support in SPY or IWM can help slow the decline, but it does not by itself signal internal recovery. For that, these participation numbers would need to improve far more decisively.
New highs, new lows and momentum pressure
The new high/new low data also remains unimpressive.
- New highs: 2.1%
- New lows: 3.0%
That still leaves new lows ahead of new highs, which is a negative sign for internal market health. It is not an extreme washout reading, but it is another indication that stocks are still breaking down more often than they are breaking out.
Weekly and monthly breadth remain firmly negative
The higher-timeframe breadth data continues to argue for caution.
- Advancing week: 26.5%
- Declining week: 72.6%
- Advancing month: 22.8%
- Declining month: 76.9%
- Advancing 3 months: 35.5%
- Declining 3 months: 63.9%
These are still deeply skewed to the downside. Even after Monday’s strong session, the weekly, monthly and three-month figures remain decisively negative. That tells us the recent weakness is broad and persistent, not just a short-lived wobble in a few areas of the market.
This also helps explain why rebound attempts continue to struggle. When the broader internal backdrop is this weak, rallies often fail quickly unless participation expands materially. Tuesday’s data suggests that expansion still is not happening.
What changed from Monday?
The most important change is that Tuesday exposed the limits of Monday’s rebound.
Yesterday’s session at least offered the possibility that the market might be starting a short-term recovery from oversold conditions. But Tuesday’s breadth data quickly pushed back on that idea. The rebound did not broaden. Instead, decliners regained control and the internal picture slipped back toward weakness almost immediately.
At the same time, Tuesday was not a total breakdown day. The major indexes did defend important support zones, and IWM even managed a modest gain. That means the market is still trying to find footing. But the internal evidence says that stabilization is not the same as recovery.
That is probably the best way to frame the current environment: price is attempting to stabilize, but breadth is not yet confirming a meaningful healing process.
Human context
This kind of tape often reflects a market where buyers are willing to respond at obvious support levels, but conviction remains limited. Traders may step in tactically after sharp weakness, yet broad sponsorship is still missing. The result is a market with sharp swings, weak follow-through, inconsistent leadership and an elevated risk of failed bounce attempts.
That remains a very accurate description of the current market environment.
Breadth Trend Rating
Rating: 2/7 – Negative
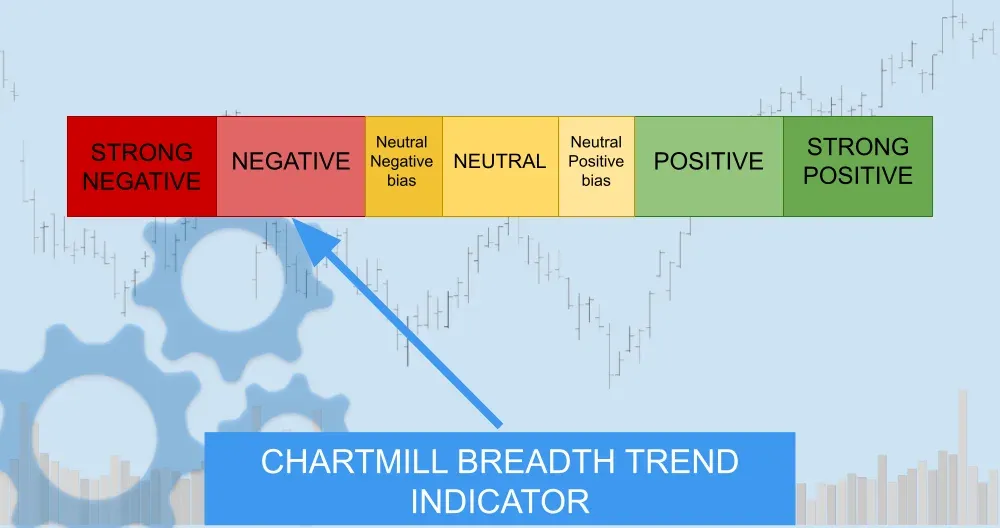
The rating remains 2 out of 7, and that still looks appropriate. Monday’s strong rebound was encouraging on the surface, but Tuesday showed that the broader internal trend remains weak.
Participation is still depressed, new lows remain ahead of new highs, the weekly and monthly breadth readings are decisively negative, and both SPY and QQQ continue to show red weekly ChartMill Trend Indicator readings that were already flagged in Monday’s update and remained unchanged on Tuesday.
So while the market may be trying to stabilize near support, the broader breadth trend is still negative rather than neutral.
Conclusion
Tuesday’s session did not bring a fresh wave of selling pressure, but it also did not validate Monday’s rebound. The major indexes found support and avoided a deeper breakdown, yet the internal data quickly weakened again. That combination points to a market that is trying to hold the line on price while still lacking the broad participation needed for a stronger recovery.
For now, the message remains cautious. Until breadth improves more convincingly and the major indexes begin to reclaim short-term trend levels, this still looks like a fragile stabilization attempt inside a broader corrective phase.
ChartMill Market Desk
This daily Market Breadth Report is prepared by ChartMill for informational purposes only and does not constitute investment advice. Always do your own due diligence before making investment decisions.
Next to read: Iran Puts a Match to Oil Markets as Wall Street's Tech Giants Buckle Under Rate Pressure