Market Breadth: The Ultimate Guide to Measuring Market Health
Market Breadth: The Ultimate Guide to Measuring Market Health
For many investors, checking the S&P 500 or the Nasdaq is the first thing they do every morning.
While these indices provide a good general overview, they rarely tell the whole story. As active participants in the market, we have found that to truly understand the internal health of the trend, you need to look beneath the surface.
This is where market breadth becomes an indispensable part of our daily routine.
In this article, we explain exactly what market breadth is, why we call it the "blood pressure" of the market, and how we use it daily to maintain a clear view of market sentiment.
What is Market Breadth?
Market breadth is a set of technical indicators that measure how many stocks are actually participating in a market movement. Instead of simply looking at the price of an index, market breadth analyzes the internal dynamics of that index.
The core concept is simple: a healthy market trend is supported by a large group of stocks (broad participation), while a weak trend relies on only a handful of heavyweights (narrow participation).
Why Market Breadth is Essential for Investors
Most major indices, such as the S&P 500, are market-cap weighted. This means the largest companies have a disproportionate influence on the index's performance.
The Masking Effect:
An index can rise even while the majority of underlying stocks are falling. This often happens when a small group of "mega-caps" (like the Magnificent Seven) pushes the index higher while the rest of the market lags behind.
Early Warning Signals:
Market breadth often deteriorates before the index itself reaches a top. Therefore, it serves as an early indicator of potential trend reversals or corrections.
Risk Management:
By analyzing breadth, you can determine how aggressively you want to be positioned. A market with a weak internal structure calls for caution and tighter risk controls.
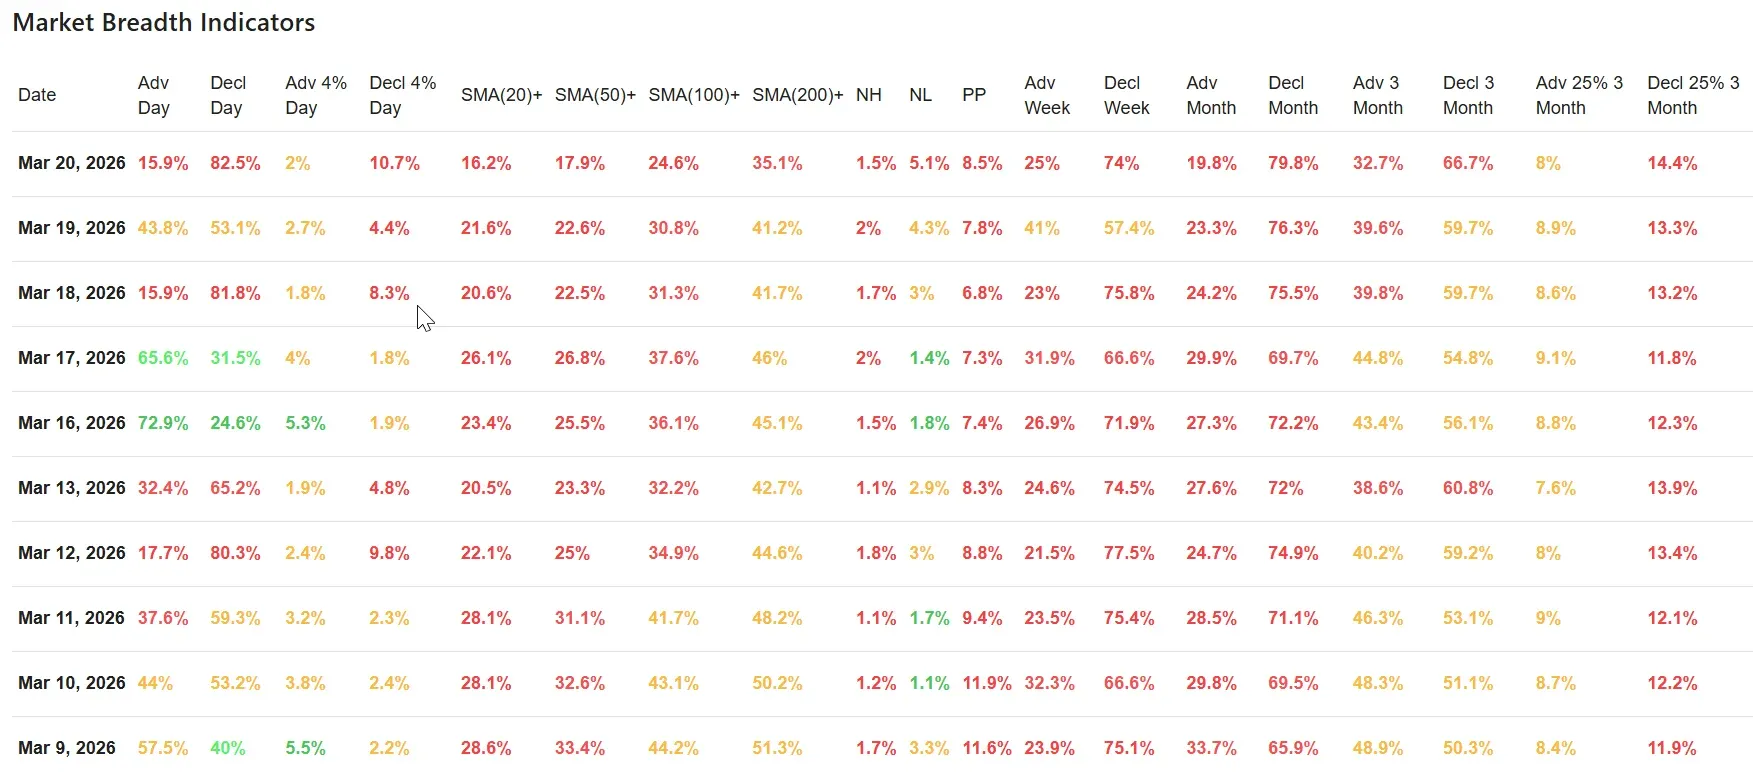
Key Indicators for Market Breadth
To keep a "finger on the pulse" of the market, professional traders and investors use several key data points:
1. Advance-Decline (A/D) Line
The A/D line compares the number of advancing stocks to the number of declining stocks on a given day. A rising line confirms a healthy uptrend, while a falling line during an index rally indicates a negative divergence.
2. New Highs vs. New Lows
This indicator measures how many stocks are reaching new 52-week highs or lows. A healthy bull market is accompanied by an expanding number of new highs. If the index hits a record but the number of new highs decreases, the "fuel" for the rally may be running out.
3. Participation: Stocks Above Their Moving Average (SMA)
One of the most powerful ways to visualize market breadth is by looking at the percentage of stocks trading above specific Simple Moving Averages:
-
SMA 20 & SMA 50: For short- to medium-term trends.
-
SMA 100 & SMA 200: For the long-term health of the market.
A market where only 20% of stocks trade above their 200-day average is in a fragile state, even if the headline index appears stable.
How We Use This: Moving from Theory to Execution
Experience has taught us that market breadth is most powerful when used to identify Divergence.
We have frequently seen the major indices hit new record highs while our internal breadth readings were already deteriorating. This "hollowing out" of the market is often the first sign that a correction is looming.
Conversely, identifying a "washout" - where selling becomes so broad that nearly everything is oversold - has been one of our most reliable signals for spotting potential market bottoms.
Our Daily Breadth Updates
It is essential not to view market breadth as a standalone signal, but as part of a broader risk management framework. In our daily updates, we translate this complex data into actionable insights:
Conviction and Participation: We don’t just look at whether the market is up; we look for a "thrust day" (powerful collective movement) versus a weak bounce after a "washout" (broad selling event).
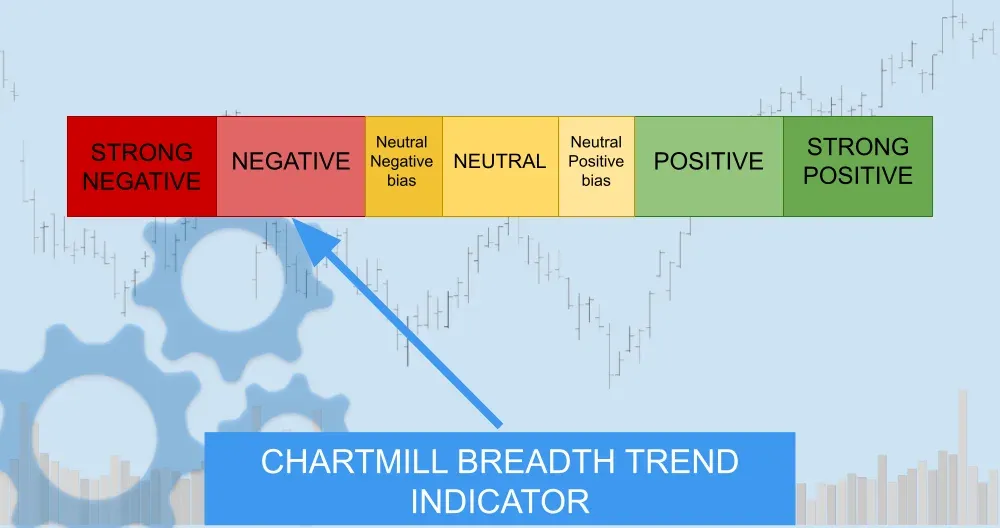
Breadth Trend Ratings: Based on indicators like the EMA9 and EMA21 for indices (such as SPY and QQQ) and internal participation figures, we assign a Breadth Trend Rating (e.g., 2/7 – Negative). This allows you to see at a glance whether the market is "healthy" or if the technical picture remains vulnerable.
The Full Picture: Combining Breadth with Daily Context
While market breadth tells us how the market is moving, we look to the daily news to understand why. A shift in breadth is often triggered by specific economic data, Fed announcements, or geopolitical shifts.
To provide a complete 360-degree view, we pair our technical breadth analysis with a comprehensive Daily US Stock Market News Update. By looking at the day's primary catalysts alongside the Breadth Trend Rating, we can determine if a move is a fundamental shift in sentiment or just short-term noise.
Daily Breadth and News Updates can be found on our blog section.
Conclusion
Market breadth allows you to look through the noise of index movements and assess the true state of the market. By tracking participation and "market internals" daily, you are better prepared for trend changes and can make decisions with more confidence.
Remember: an index can be pulled higher by a few giants, but a sustainable bull market needs the support of the many. Keep an eye on the breadth to know when to "buy the dip" or when it's time to harvest profits.
ChartMill Market Desk - Kristoff