Index Overview (SPY, QQQ, IWM)
Thursday’s data suggested the market might be trying to stabilize after the earlier damage, but Friday’s move made clear that this was not the start of a meaningful recovery. Instead, it looks more like a short-lived pause within a still-weak market structure.
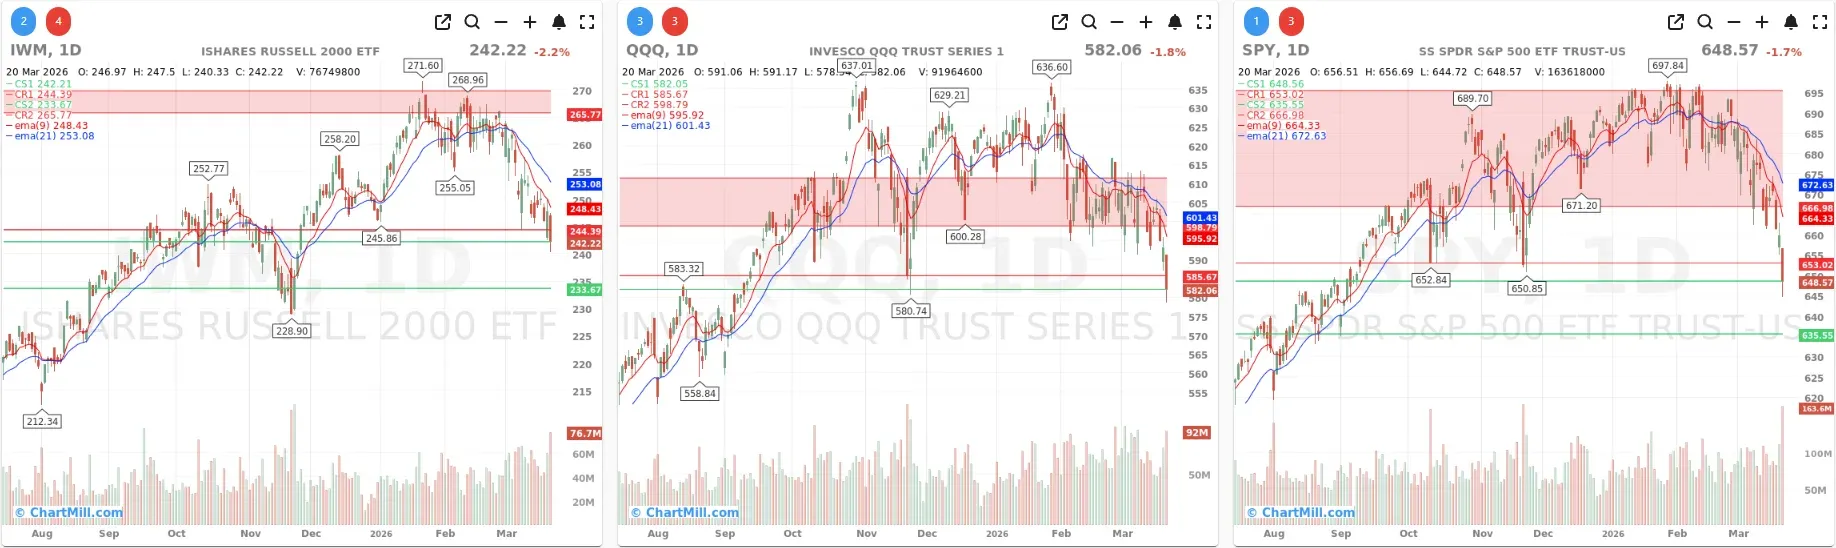
Short Term (Daily)
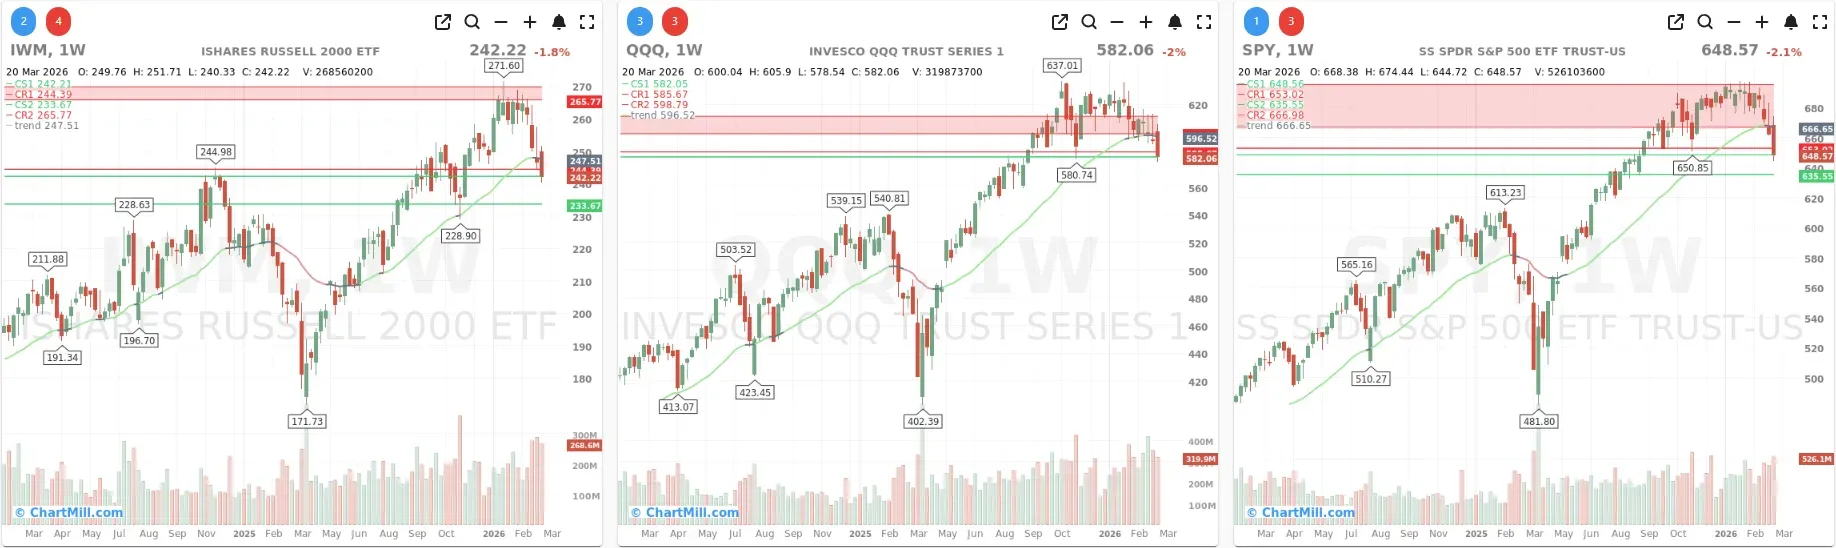
Long Term (Weekly)
SPY closed at 648.57, down 1.7%, and remains clearly below both the 9-day EMA (664.33) and 21-day EMA (672.63). That keeps the short-term trend firmly under pressure. Price also closed right near an important support area in the mid-640s, which means the index is no longer just drifting lower, but is testing an area where buyers really need to respond.
On the weekly chart, the damage is even more meaningful. SPY finished below the ChartMill Trend Indicator (666.65), a sign that the longer-term trend has weakened materially. As long as SPY remains below that level, the burden of proof is on the bulls.
QQQ closed at 582.06, down 1.8%, and is also trading well below its EMA9 (595.92) and EMA21 (601.43). Thursday’s rebound attempt did not create any lasting technical improvement. Friday simply pushed QQQ back toward the lower end of its recent range.
The weekly chart is particularly important here. QQQ closed around the 582 support zone and below the weekly Trend Indicator (596.52). That tells us leadership stocks are no longer providing the kind of support they did earlier in the year. If QQQ cannot quickly reclaim the 596 area, the recent weakness starts to look less like a pullback and more like a deeper trend deterioration.
IWM again showed the weakest profile, closing at 242.22, down 2.2%. It is well below both the EMA9 (248.43) and EMA21 (253.08) and has now undercut nearby support. Small caps had already been lagging, and Friday’s action reinforces that risk appetite remains weak.
On the weekly chart, IWM also closed below its Trend Indicator (247.51). That matters because small caps often reflect the market’s willingness to embrace broader participation. Right now, they are doing the opposite. Instead of leading, they are confirming caution.
Breadth analysis: Friday confirms that Thursday’s stability was fragile
The key message from Thursday’s breadth report was that the market had stabilized somewhat, but that the improvement was still too narrow and too tentative to call it a real turn. Friday confirmed exactly that concern.
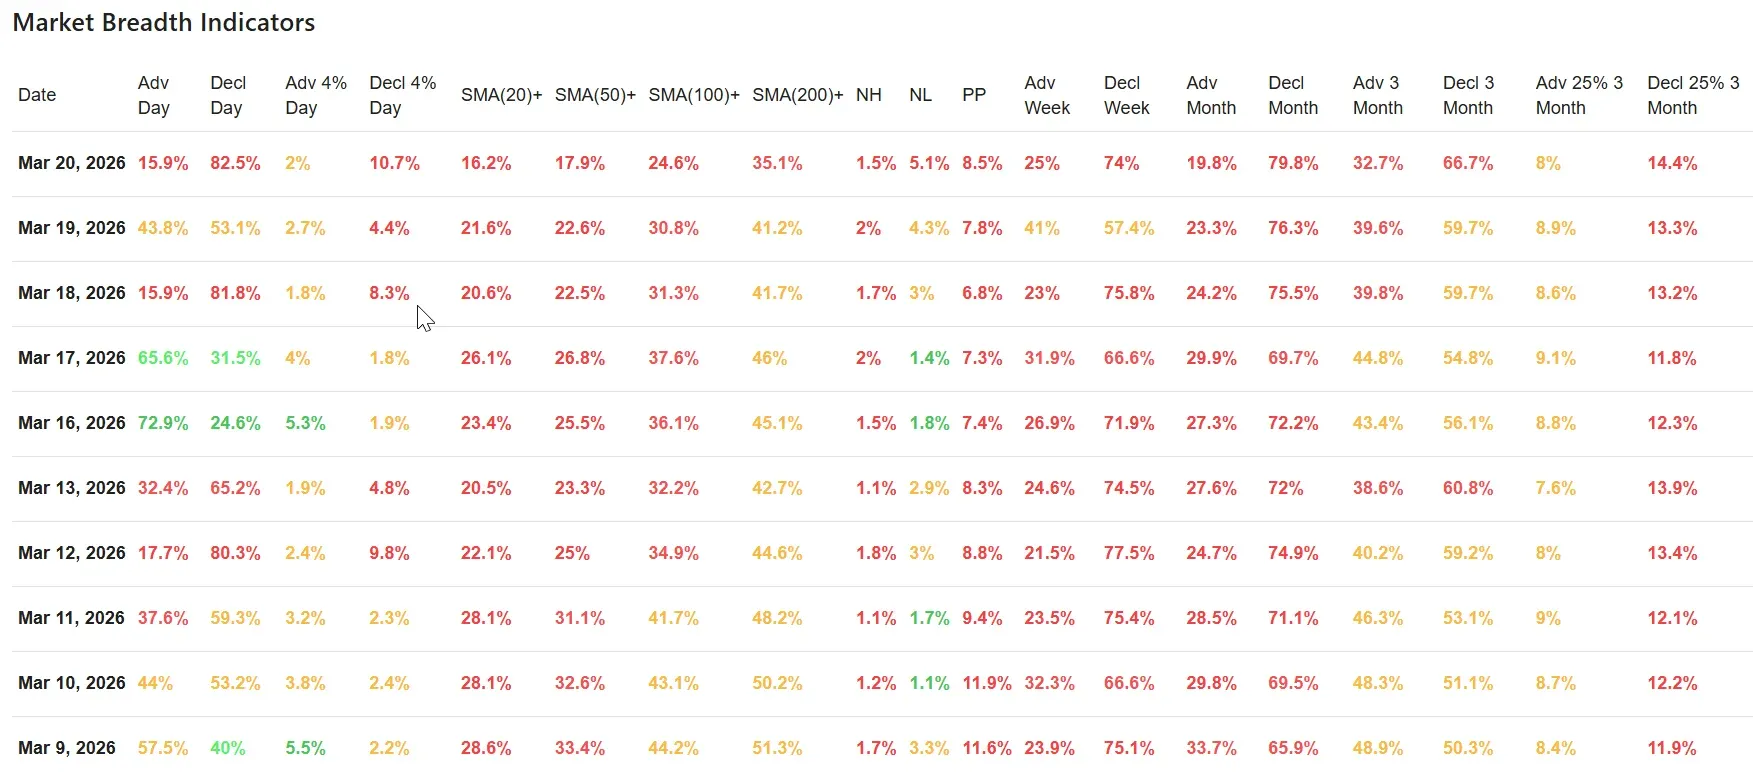
Daily breadth collapsed:
- Advancers: 15.9%
- Decliners: 82.5%
That is not ordinary weakness. It is decisive distribution. After Thursday’s 43.8% advancers and 53.1% decliners, one could still argue that the market was trying to regain balance. Friday removed that argument. The market did not build on Thursday’s relative improvement; it reversed it immediately and aggressively.
The same pattern showed up in more aggressive short-term breadth measures:
- Advancing 4%+ stocks: 2.0%
- Declining 4%+ stocks: 10.7%
This is important because it shows that not only were most stocks down, but downside momentum was again much stronger than upside momentum. Thursday had already shown only limited upside thrust, and Friday’s figures underline that buyers still lack conviction.
Participation remains extremely weak beneath the surface
The moving-average participation metrics continue to paint a very poor picture:
- Above SMA(20): 16.2%
- Above SMA(50): 17.9%
- Above SMA(100): 24.6%
- Above SMA(200): 35.1%
Compared with Thursday, all four readings worsened again. That is a critical detail. Thursday’s session created a temporary improvement in some headline breadth numbers, but the broader participation backdrop never truly healed. Friday simply brought those underlying weaknesses back into full view.
A market in healthy condition does not usually have only 16.2% of stocks above their 20-day average and just 35.1% above the 200-day average. These are depressed readings that suggest weakness is not isolated to one or two sectors. It is widespread and persistent.
New highs vs. new lows: still a bearish internal profile
Friday’s internal leadership picture remained unfavorable:
- New Highs: 1.5%
- New Lows: 5.1%
That is slightly worse than Thursday’s already weak balance of 2.0% new highs versus 4.3% new lows. In other words, even after Thursday’s apparent stabilization, leadership never meaningfully broadened. Friday kept the market in a state where breakdowns still outnumber fresh breakouts.
The Pocket Pivot reading at 8.5% also remains subdued. That suggests there is still only limited positive price pressure across the market.
The broader time windows are not improving
One of the strongest bearish arguments in the current data set is that weakness is not confined to a single session. The weekly, monthly, and 3-month measures all remain heavily skewed toward decliners.
Weekly breadth
- Adv Week: 25.0%
- Decl Week: 74.0%
Thursday’s readings were already weak at 41.0% advancers and 57.4% decliners for the week. Friday pushed those numbers sharply worse again. That means the entire week ended on a much weaker note than Thursday’s single-session stabilization had implied.
Monthly breadth
- Adv Month: 19.8%
- Decl Month: 79.8%
That is an extremely weak monthly backdrop. It tells us the damage has been building for some time and has not yet been repaired.
3-month breadth
- Adv 3 Month: 32.7%
- Decl 3 Month: 66.7%
These longer-range readings continue to show that the market’s internal trend has been deteriorating for a while. Friday did not create that weakness; it confirmed it.
Trend across the last 10 trading days
The 10-day sequence now looks very telling.
There were only two sessions in this period that showed notably constructive daily breadth: March 16 and March 17. Those stronger sessions briefly suggested the market might be trying to establish a rebound phase. But instead of building on that, the market quickly fell back into repeated heavy-decliner days on March 18 and now again on March 20.
That sequence matters. A healthy market usually follows strong breadth days with at least some follow-through. Here, the opposite happened. Good breadth was short-lived, while poor breadth returned quickly and forcefully.
Even Thursday, which looked somewhat calmer on the surface, now reads more like a pause inside a broader downtrend rather than the beginning of a sustainable recovery. Friday’s figures strongly support that interpretation.
Context and sentiment
Where there is clear macro or sentiment pressure, it can influence breadth very quickly, especially when indexes are already trading below short-term moving averages. In this kind of environment, uncertainty around growth, rates, or risk sentiment can easily trigger broad selling rather than isolated weakness. The charts and breadth data suggest that whatever news flow was present, the market was already in a fragile technical position and therefore vulnerable to another wave of distribution.
Conclusion
The main takeaway is straightforward: Thursday’s stabilization attempt failed. Friday brought another broad washout, and the internal damage remains significant across nearly every important breadth measure.
All three major ETFs closed below their short-term moving averages. On the weekly charts, SPY, QQQ, and IWM are all now trading at or below key long-term trend reference points. Beneath the surface, participation remains very weak, new lows continue to exceed new highs, and the weekly and monthly breadth numbers show that this is not just a one-day problem.
The market can certainly stage oversold bounces from conditions like these, but the data does not yet support the view that a durable internal repair is underway. For that to change, we would need to see multiple sessions of strong advancing breadth, better improvement in the moving-average participation metrics, and leadership expanding again through a healthier new-high/new-low balance.
Breadth trend rating: 2/7 — Negative
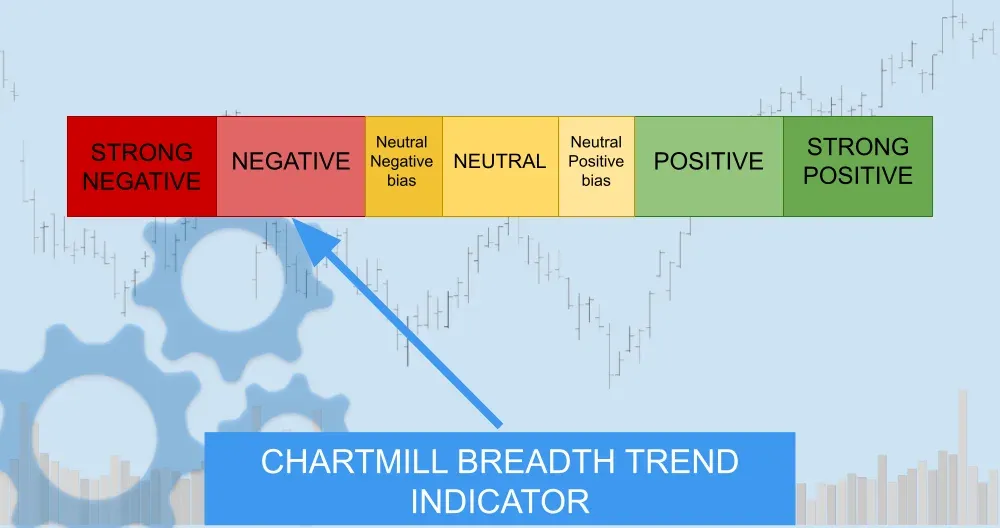
This remains a negative breadth environment.
That rating is justified because:
Friday’s session saw 82.5% decliners short-term participation metrics deteriorated again all major indexes remain technically damaged on the daily chart weekly trend structures have weakened materially longer-term breadth windows still strongly favor decliners
Compared with Thursday, the message is actually clearer now. Yesterday’s analysis described stabilization, but with clear caution because the internals were still too weak. Friday confirmed that caution was warranted. The market did not transition from stabilization to recovery; it slipped back into broad internal weakness.
ChartMill Market Desk
This daily update is prepared by ChartMill for informational purposes only and does not constitute investment advice. Always do your own due diligence before making investment decisions.
Next to read: Wall Street Drowns in Red as Iran War Escalates and a Chip-Smuggling Scandal Rocks AI Infrastructure