Index Overview (SPY, QQQ, IWM)
A second straight improvement in daily breadth helped stabilize the market on March 25, with advancers clearly outpacing decliners and short-term participation expanding. Still, the broader backdrop remains fragile: most medium- and longer-term breadth measures are weak, SPY and QQQ remain below their short-term moving averages, and the weekly trend picture continues to argue for caution.
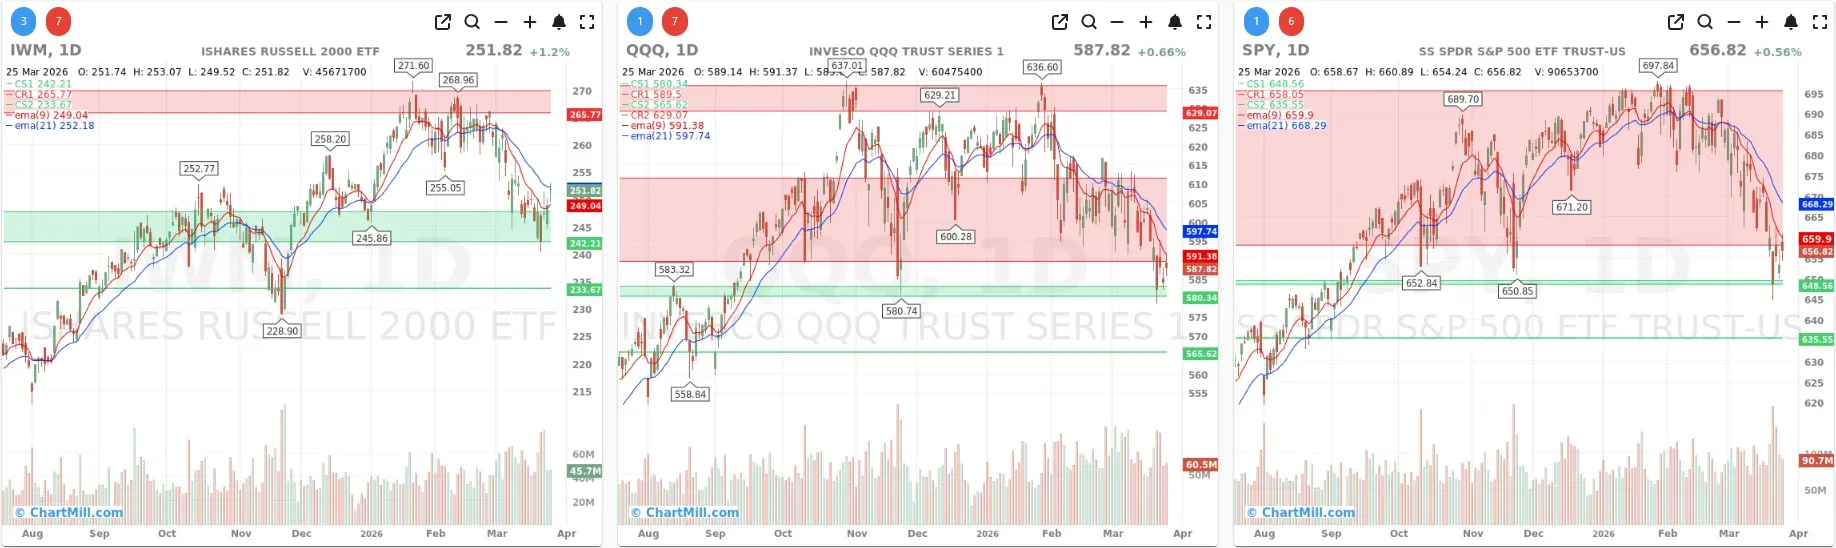
Short Term (Daily)
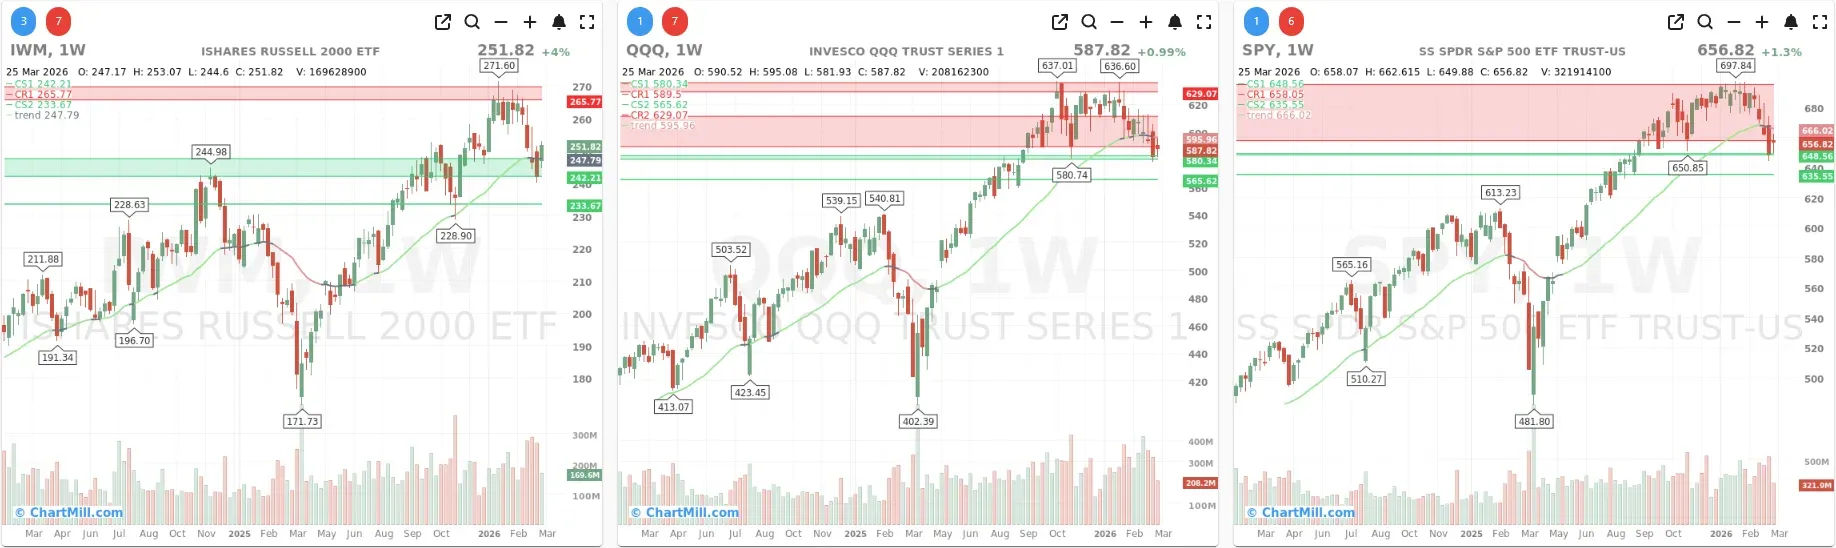
Long Term (Weekly)
SPY added 0.56% and closed at $656.82, extending Tuesday’s rebound attempt. That said, the ETF remains below both the EMA9 (659.9) and EMA21 (668.3) on the daily chart, so the short-term trend has not yet turned constructive again. The market did hold above the key support band around 648.6, which is a positive near-term development, but price is still trading inside a damaged structure after the recent selloff.
On the weekly chart, the situation is still more cautious than the last two daily candles might suggest. The ChartMill Trend Indicator remains red, which is not a new signal anymore, but it continues to underline that the longer-term backdrop has weakened. This week’s bounce is helping SPY stabilize above the lower support area, yet as long as price remains below the weekly trend line near 666, the recovery still looks more like a rebound inside a pressured trend than a confirmed bullish reset.
QQQ gained 0.66% to $587.82. Like SPY, it managed to continue Tuesday’s rebound, but the close still sits below both the EMA9 (591.4) and EMA21 (597.7). That means the short-term downtrend remains intact for now. The important constructive point is that buyers again defended the lower support zone around 580.3, preventing a deeper breakdown.
The weekly chart tells the same story as SPY: the ChartMill Trend Indicator is still red, as already noted in the previous update, and QQQ remains below that weekly trend level near 596. So while the daily action has improved, the bigger picture is still one of damaged leadership rather than renewed strength.
IWM was the relative winner on the day, rising 1.2% to 251.82. That pushed the ETF back above its EMA9 (249.0) and close to its EMA21 (252.2). Small caps therefore showed the strongest short-term response of the three major index ETFs. The bounce from the 242–245 support zone is becoming more visible on the chart.
On the weekly timeframe, IWM looks a bit less weak than SPY and QQQ. Its ChartMill Trend Indicator is still neutral/grey, not red, and price is trying to hold above that longer-term trend area around 247.8. That does not make IWM a leadership market yet, but it does suggest that small caps are currently holding up slightly better on a structural basis.
Breadth data: a clear one-day improvement

The biggest positive from Wednesday’s session is that breadth strengthened further after Tuesday’s rebound day.
- Advancers: 73.4%
- Decliners: 24.1%
- Stocks up more than 4%: 5.1%
- Stocks down more than 4%: 1.7%
That is a meaningful improvement from March 24, when advancers were only 40.2% and decliners still led at 57.3%. It also follows Monday’s very strong breadth thrust (79.9% advancers), which means that in two of the last three sessions the market has shown broad upside participation. That is an important change from the heavy selling pressure seen on March 18 and March 20.
In other words, the market is no longer acting like it is in immediate breadth freefall. The rebound has broadened out.
But the broader participation profile is still weak
The problem is that the medium-term breadth picture remains poor despite the short-term bounce.
On March 25, the percentage of stocks above key moving averages improved only modestly to:
- Above SMA20: 28.2%
- Above SMA50: 23.4%
- Above SMA100: 32.2%
- Above SMA200: 40.2%
These numbers are better than Tuesday’s readings, but still objectively weak. When fewer than one-third of stocks are above their 20-, 50-, and 100-day moving averages, it tells you that the rebound has not yet repaired the internal damage done over the past several weeks.
The 10-day comparison makes that even clearer. On March 2, breadth was far healthier, with 50.7% of stocks above the SMA20, 54.5% above the SMA50, 55.5% above the SMA100, and 56.9% above the SMA200. Since then, participation has deteriorated sharply. Wednesday’s bounce helps, but it only slightly lifts a market that is still far below where it stood earlier this month.
New highs vs. new lows: still not convincing
Wednesday’s new highs (1.9%) nearly matched new lows (2.2%). That is better than several recent sessions, and much better than the more stressed readings from March 19 and March 20, but it still does not show a market producing strong upside leadership.
A healthy trending market usually sees new highs clearly dominate new lows. Right now, that is not happening. The market is stabilizing, but leadership is still thin.
Weekly and monthly breadth remain decisively negative
This is where the caution really comes in:
- Advancing week: 46.2%
- Declining week: 52.6%
That is an improvement versus Tuesday’s 26.5% / 72.6%, but weekly breadth still favors the bears.
The monthly numbers remain even more negative:
- Advancing month: 21.3%
- Declining month: 78.3%
- Advancing 3-month: 38.2%
- Declining 3-month: 61.2%
Those are not the readings of a market that has fully repaired itself. They are the readings of a market trying to rebound from a broad and still-unresolved correction phase.
How this compares with the previous update
Tuesday’s analysis already pointed out that breadth had improved, but that the move still needed confirmation because the broader structure remained weak and SPY/QQQ were still under pressure on both the daily and weekly charts.
Wednesday’s data largely confirms that view.
What improved:
- The rebound broadened meaningfully.
- Daily participation got much stronger.
- Small caps showed better relative strength.
- Key support levels in SPY and QQQ held again.
What did not improve enough:
- SPY and QQQ are still below their daily EMA9 and EMA21.
- The weekly trend indicator remains red for both SPY and QQQ.
- The percentage of stocks above major moving averages is still too low.
- Monthly breadth remains heavily negative.
So this is best viewed as a continuation of the rebound attempt, not yet as proof that a durable new uptrend is underway.
Final assessment
Wednesday’s session was constructive. Breadth expanded, downside pressure eased, and the market followed through on Tuesday’s stabilization. That matters, especially after the heavy internal deterioration seen earlier in March.
But the more important conclusion is that the rebound has not yet changed the broader character of the market. Participation remains weak beneath the surface, longer-term breadth is still negative, and the major growth-heavy indexes continue to show structural damage on both the daily and weekly charts.
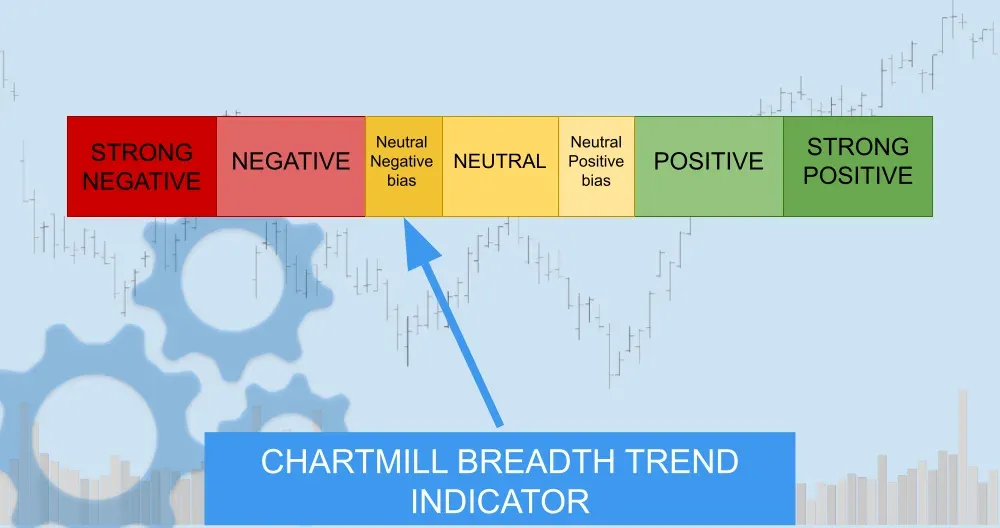
Breadth Trend Rating: 3/7 — neutral with a negative bias
For now, the market has moved from acute weakness to tentative stabilization, but not yet to true strength. Bulls have gained some breathing room over the last two sessions, yet they still need much more follow-through to turn this into a real breadth recovery rather than just a short-lived rebound inside a fragile market.
ChartMill Market Desk
This daily Market Breadth Report is prepared by ChartMill for informational purposes only and does not constitute investment advice. Always do your own due diligence before making investment decisions.
Next to read: ARM Makes Its Move While Wall Street Watches the Strait